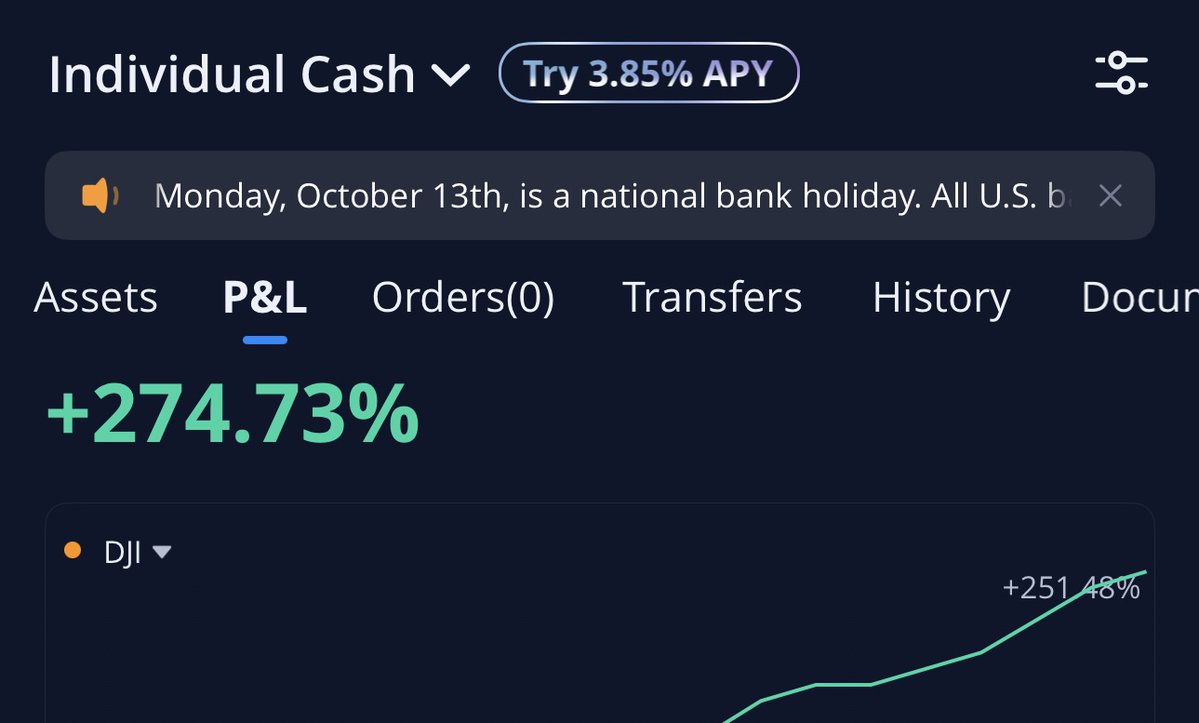
$SPY A thread 🧵 detailing the strategy I use to stay consistent and profitable in the stock market!
Following these methods has lead me to having only 1 red day in the past 6 weeks of trading! And I'm going to show you exactly how I do this right now!
Lets dive right in 👇
Following these methods has lead me to having only 1 red day in the past 6 weeks of trading! And I'm going to show you exactly how I do this right now!
Lets dive right in 👇

It starts by determining which direction has the better R/R to play that day. There are usually 3 options.
Balanced/Range day📈📉
Uptrend day 📈
Downtrend day📉
Picking up on which one it will be quickly makes it a lot easier to place winning trades that day.
Balanced/Range day📈📉
Uptrend day 📈
Downtrend day📉
Picking up on which one it will be quickly makes it a lot easier to place winning trades that day.
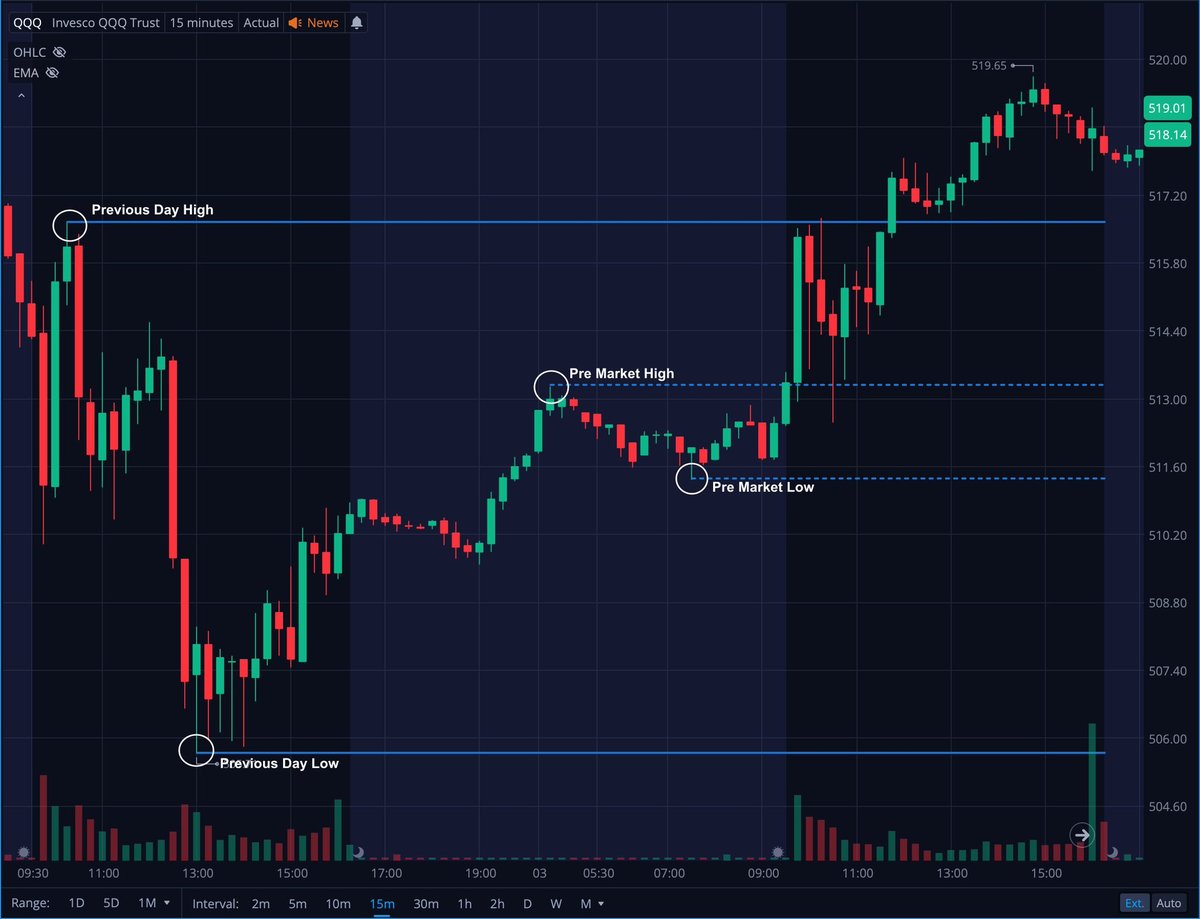
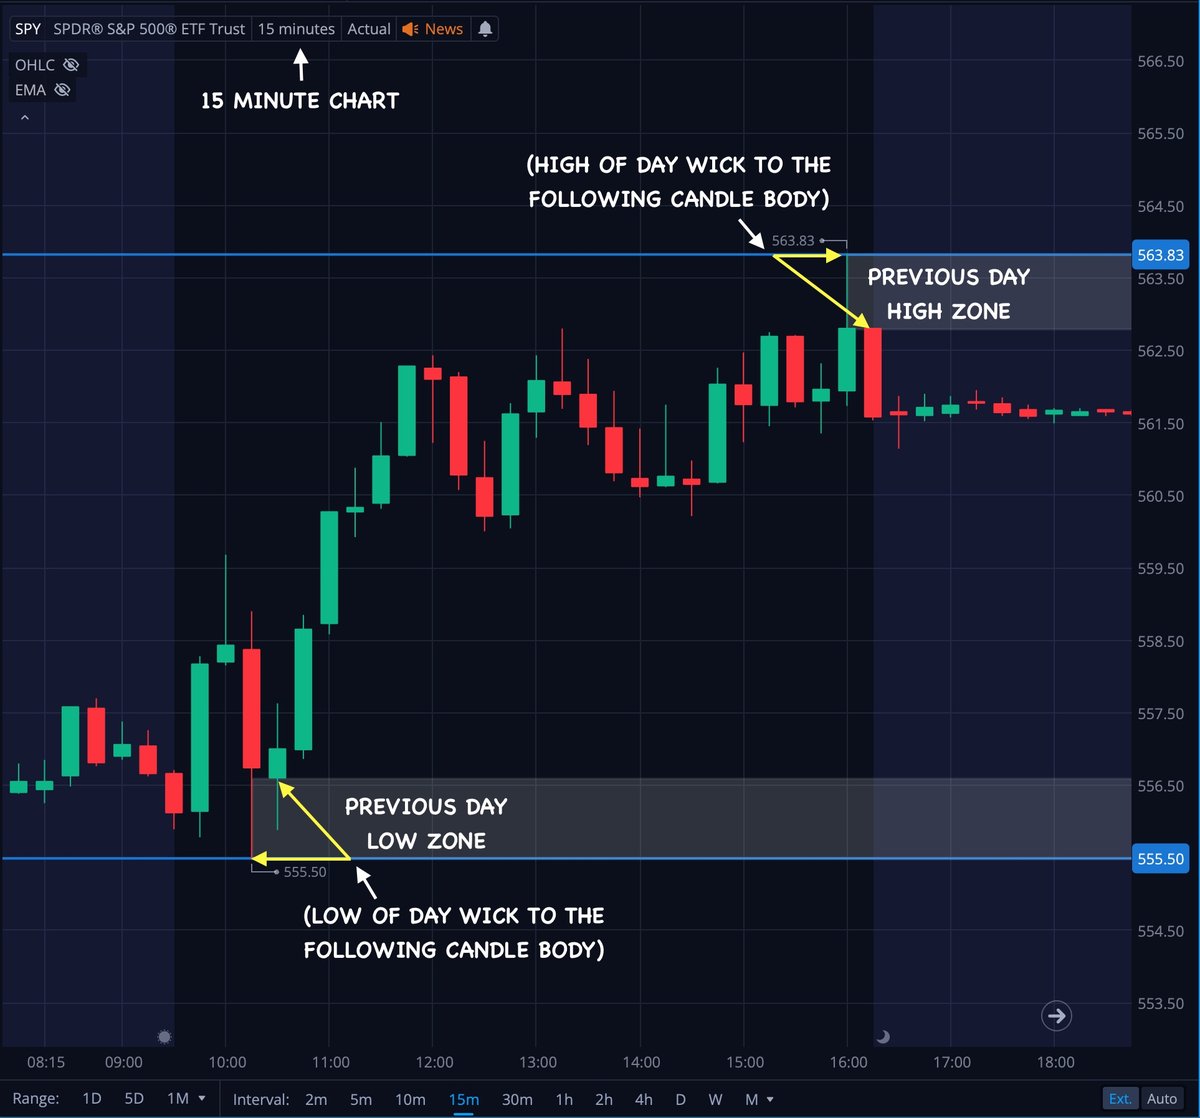
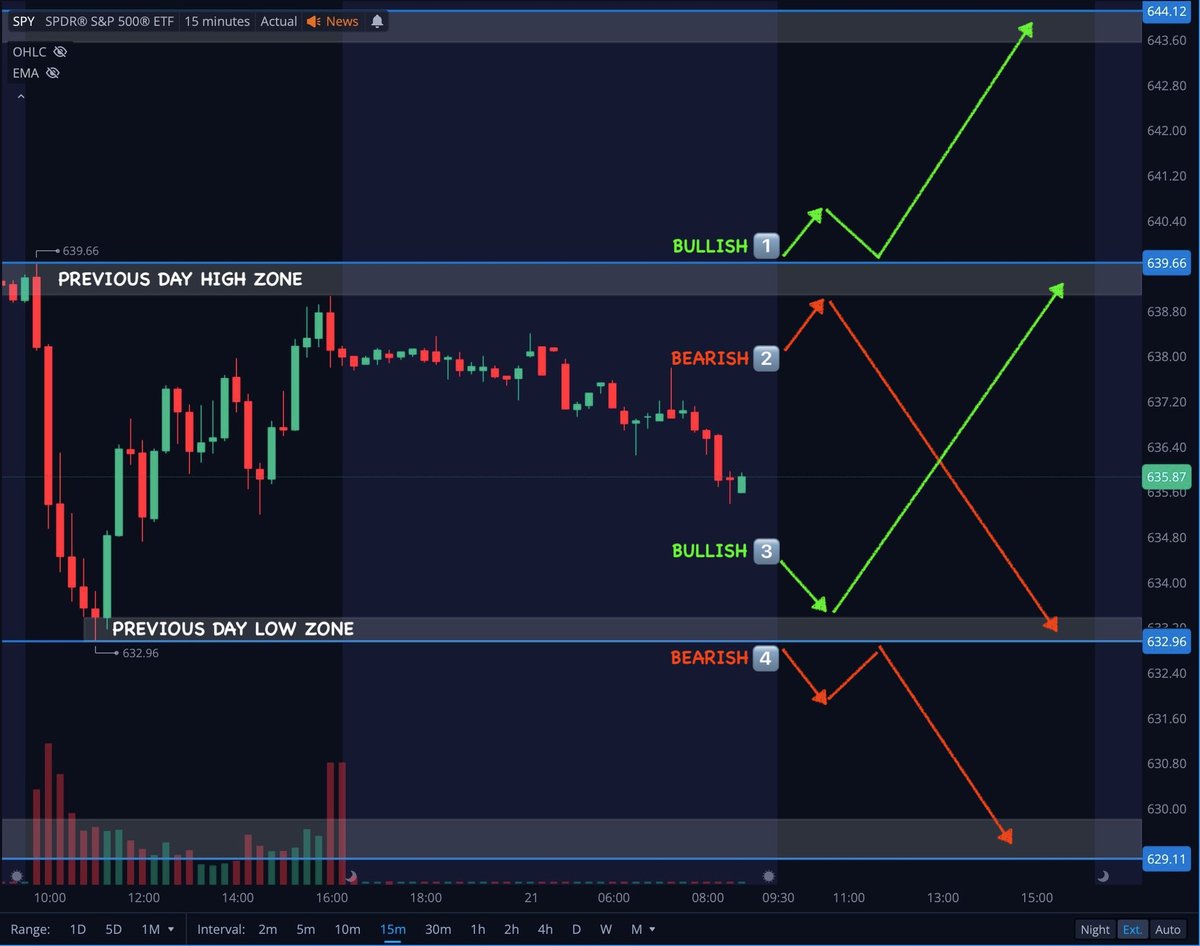
One of my favorite ways to determine direction is to use the Previous days high/low Supply & Demand zones. These are a great tool to use for finding the start of a trend day.
Below we have 3 perfect examples on $SPY from just last week. Lets take a closer look at each of them 👇
Below we have 3 perfect examples on $SPY from just last week. Lets take a closer look at each of them 👇
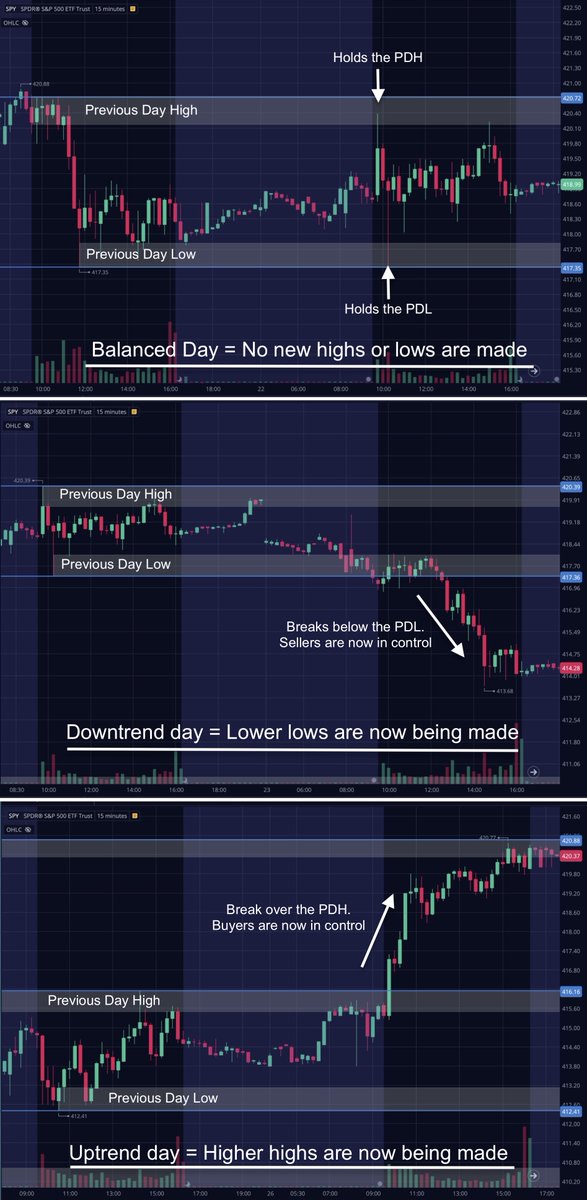
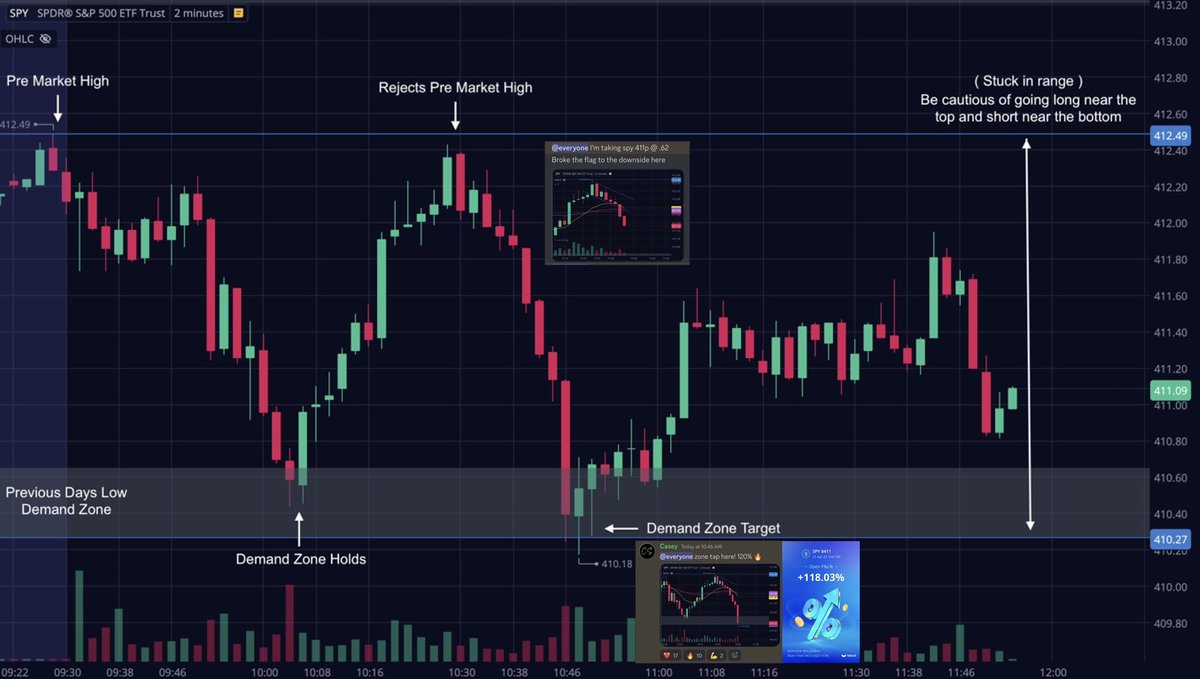
We started off the week with a balanced/range day.
Neither the high or low of the previous day was broken. This tells us that neither buyers or sellers are in control.
There are still great opportunities to be had on these days if you are aware of the range we are in 👇
Neither the high or low of the previous day was broken. This tells us that neither buyers or sellers are in control.
There are still great opportunities to be had on these days if you are aware of the range we are in 👇
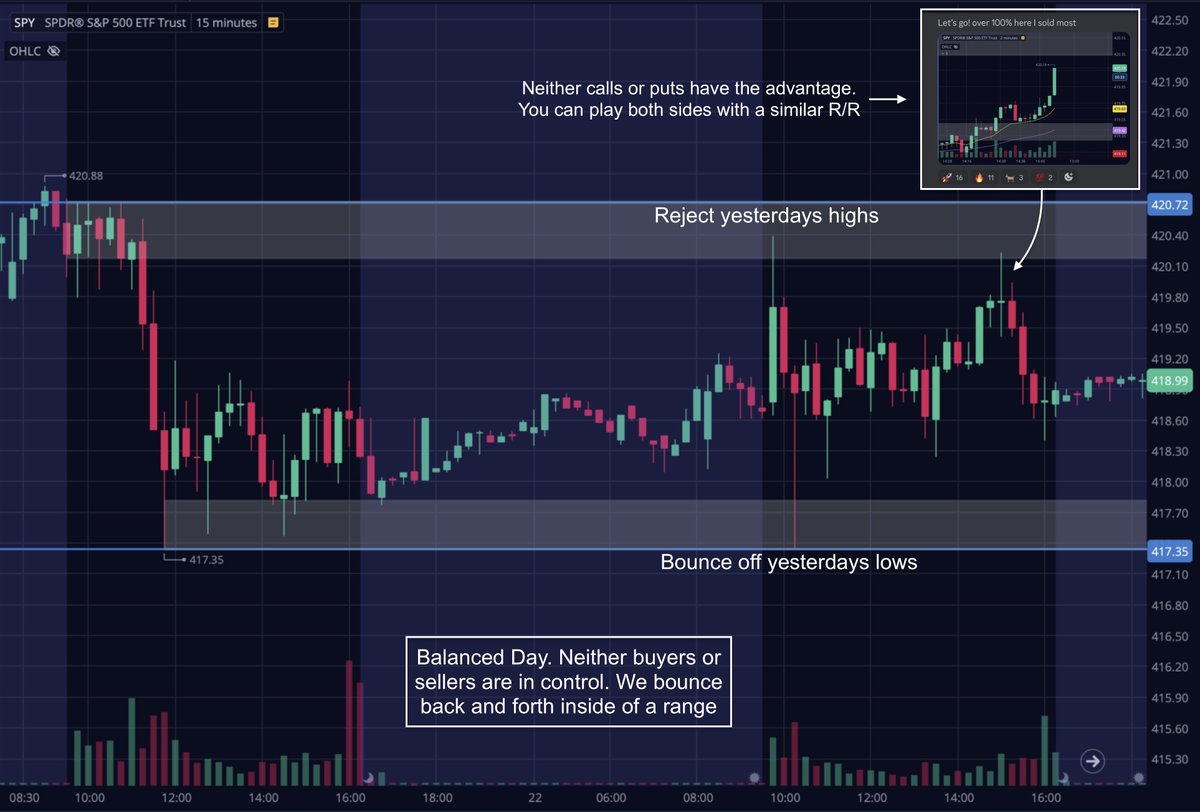
Some tips for trading balanced days. Because neither buyers or sellers have control price action tends to be choppy.
Avoid taking calls near the top of the range and puts near the bottom.
Use can pre market and intraday levels, emas and chart patterns to find plays 👇
Avoid taking calls near the top of the range and puts near the bottom.
Use can pre market and intraday levels, emas and chart patterns to find plays 👇


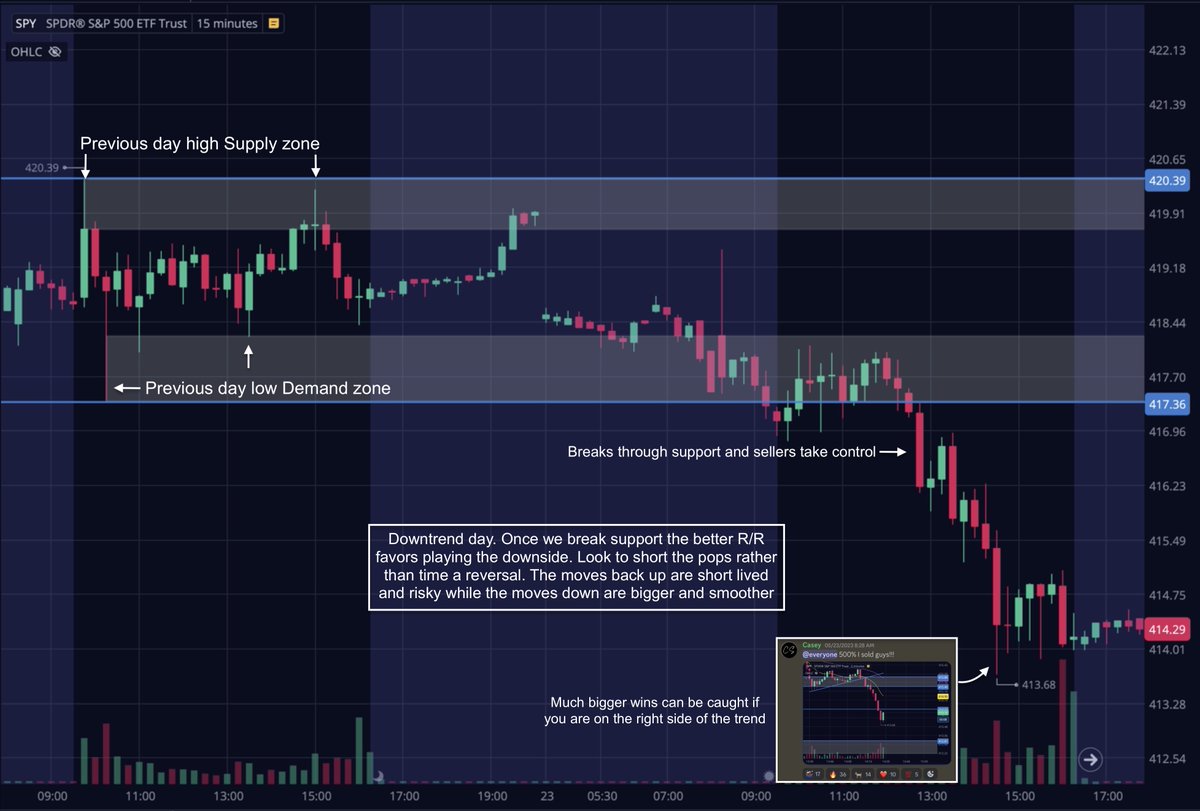
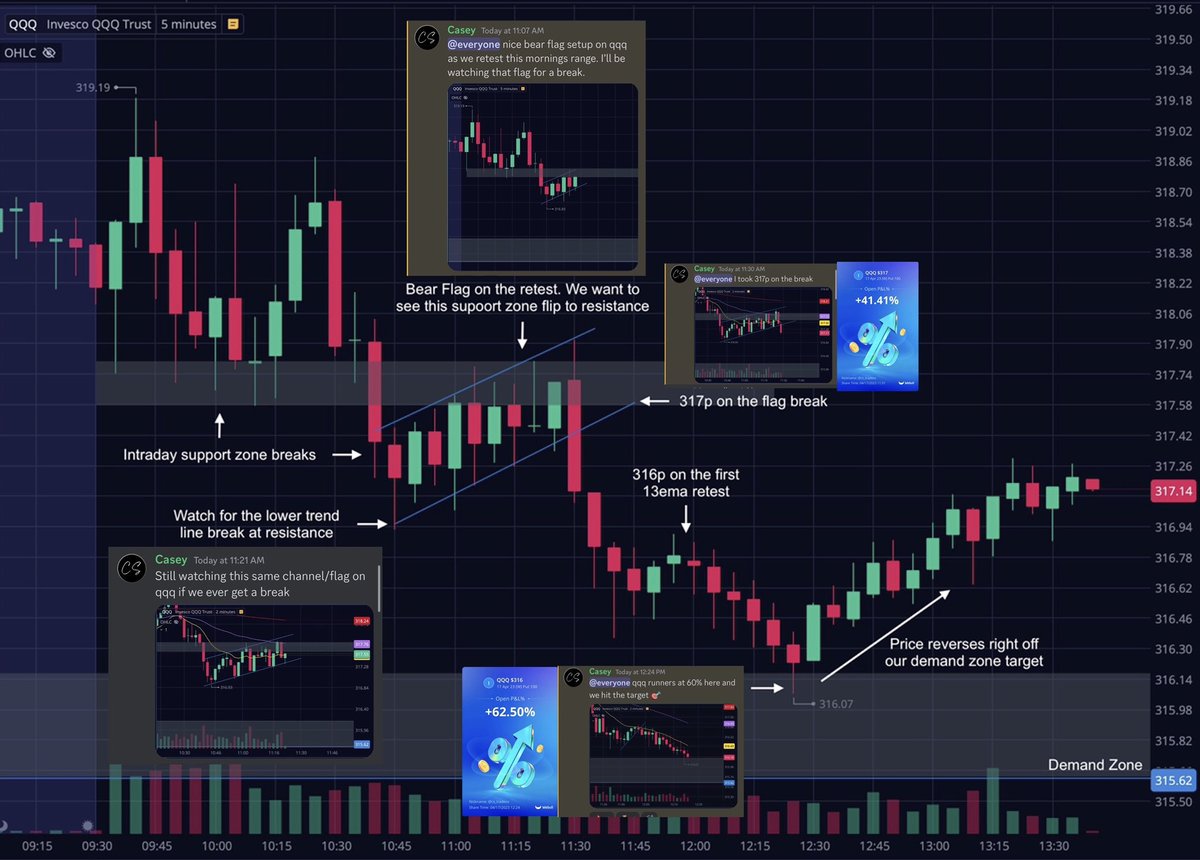
Next we got a downtrend day! The break of the PDL demand zone was the first sign that sellers have taken control of the day
When this happens the R/R tips drastically in the favor of going short. The bounces get sold off quick and the moves down are a a lot smoother are quicker
When this happens the R/R tips drastically in the favor of going short. The bounces get sold off quick and the moves down are a a lot smoother are quicker
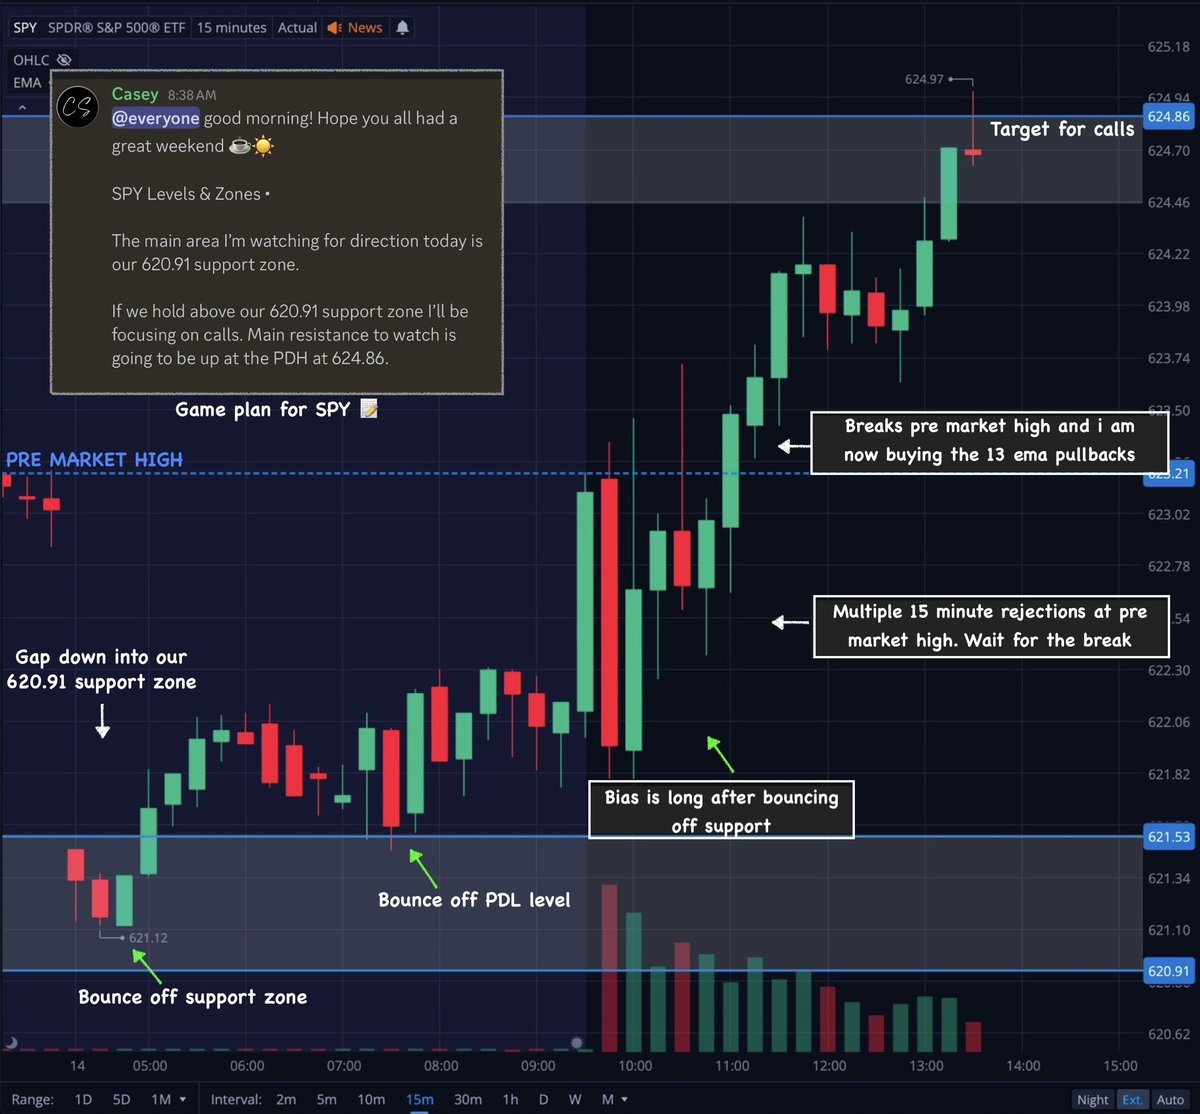
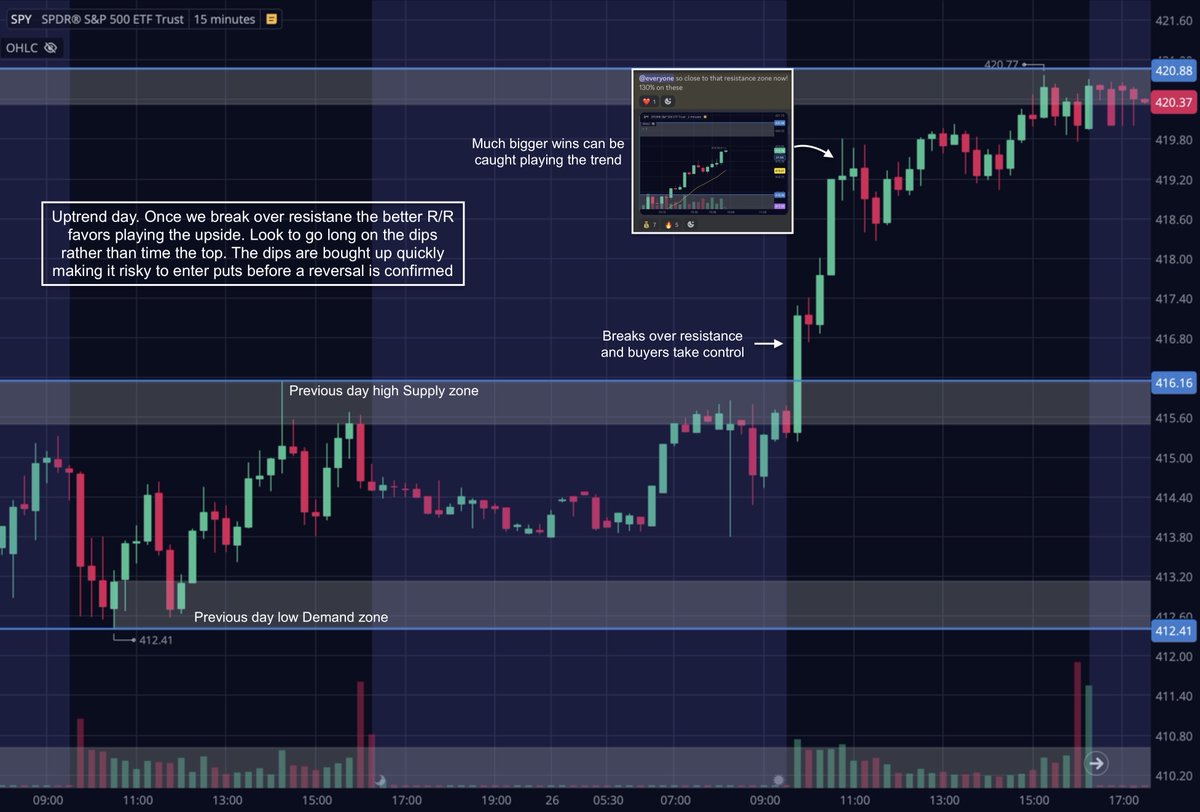
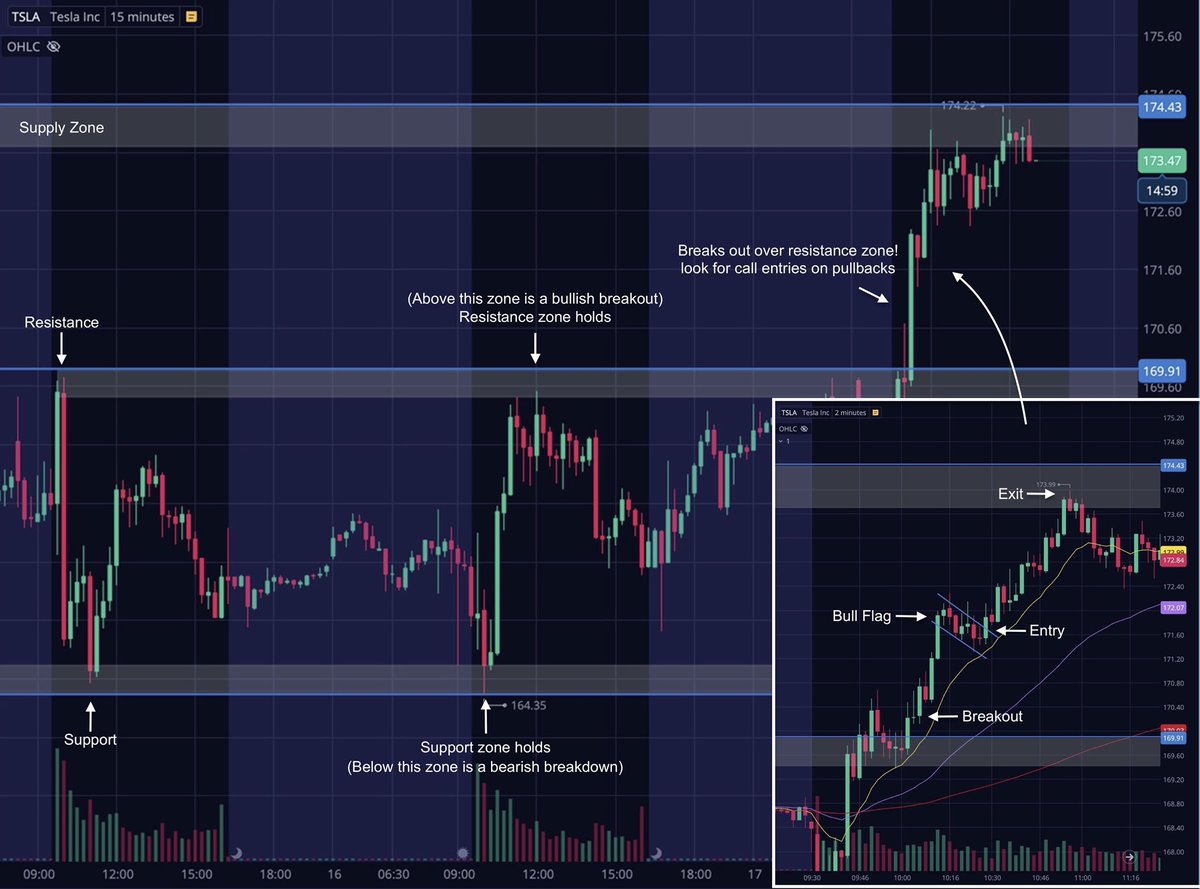
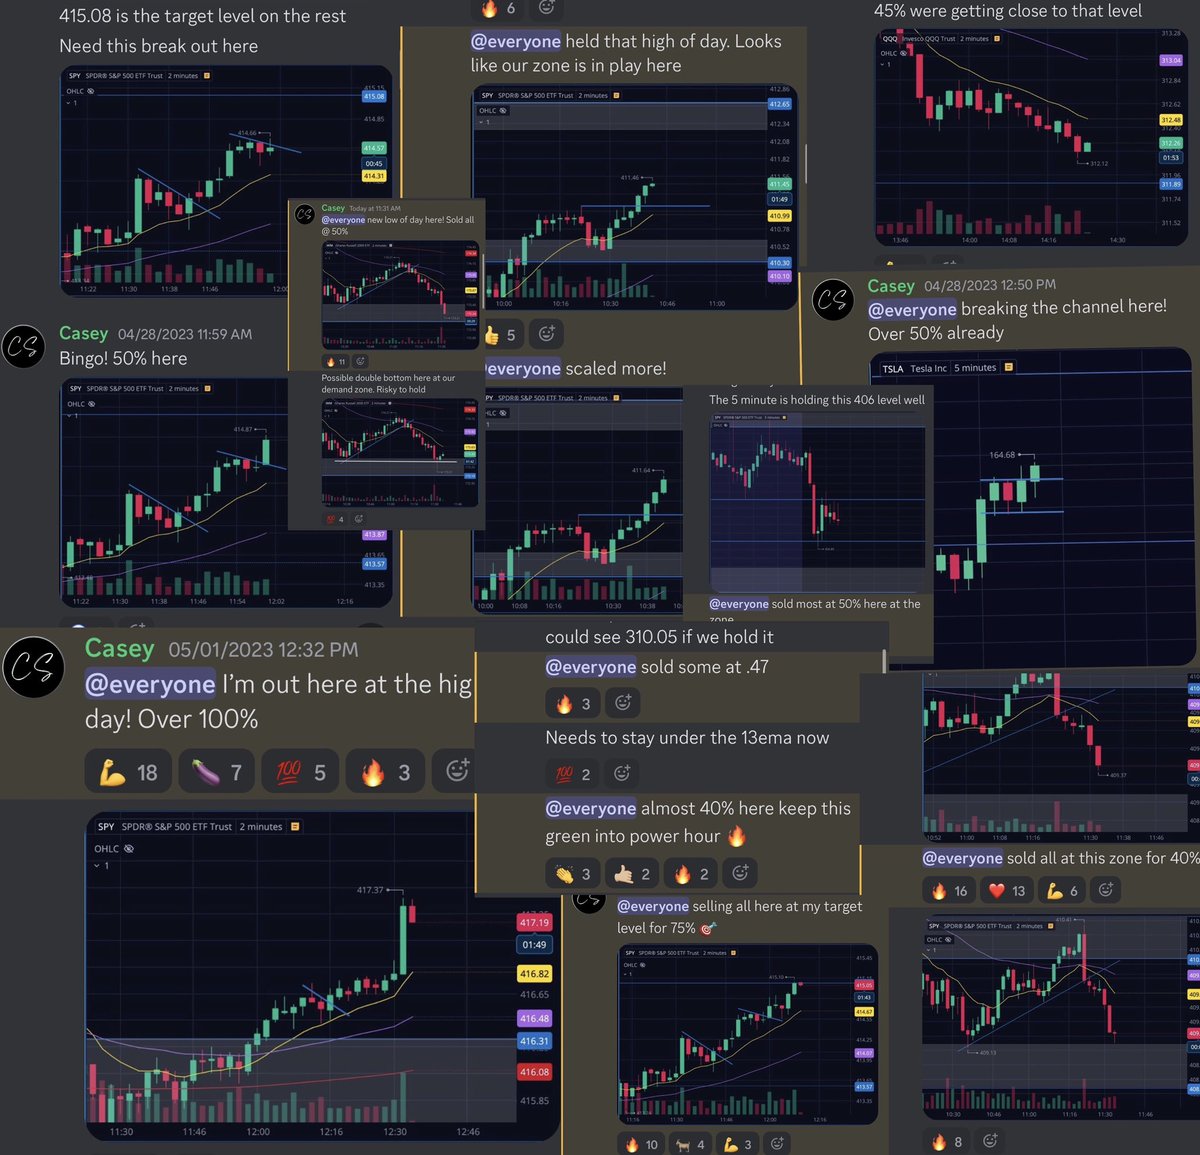
Now lets take a look at this uptrend day. Using the same previous day H/L zones we can tell early on that buyers are in control of the day.
We want to go long on the dips because that is now where the best R/R is until we hit our next resistance zone above 👇
We want to go long on the dips because that is now where the best R/R is until we hit our next resistance zone above 👇
You can see from this weeks price action alone how important it is to not come into the day with a bias.
Chop, Uptrend, Downtrend are all possible on any given day. Coming into the day with a bull or bear mindset greatly reduces your chances of making money consistently!
Chop, Uptrend, Downtrend are all possible on any given day. Coming into the day with a bull or bear mindset greatly reduces your chances of making money consistently!
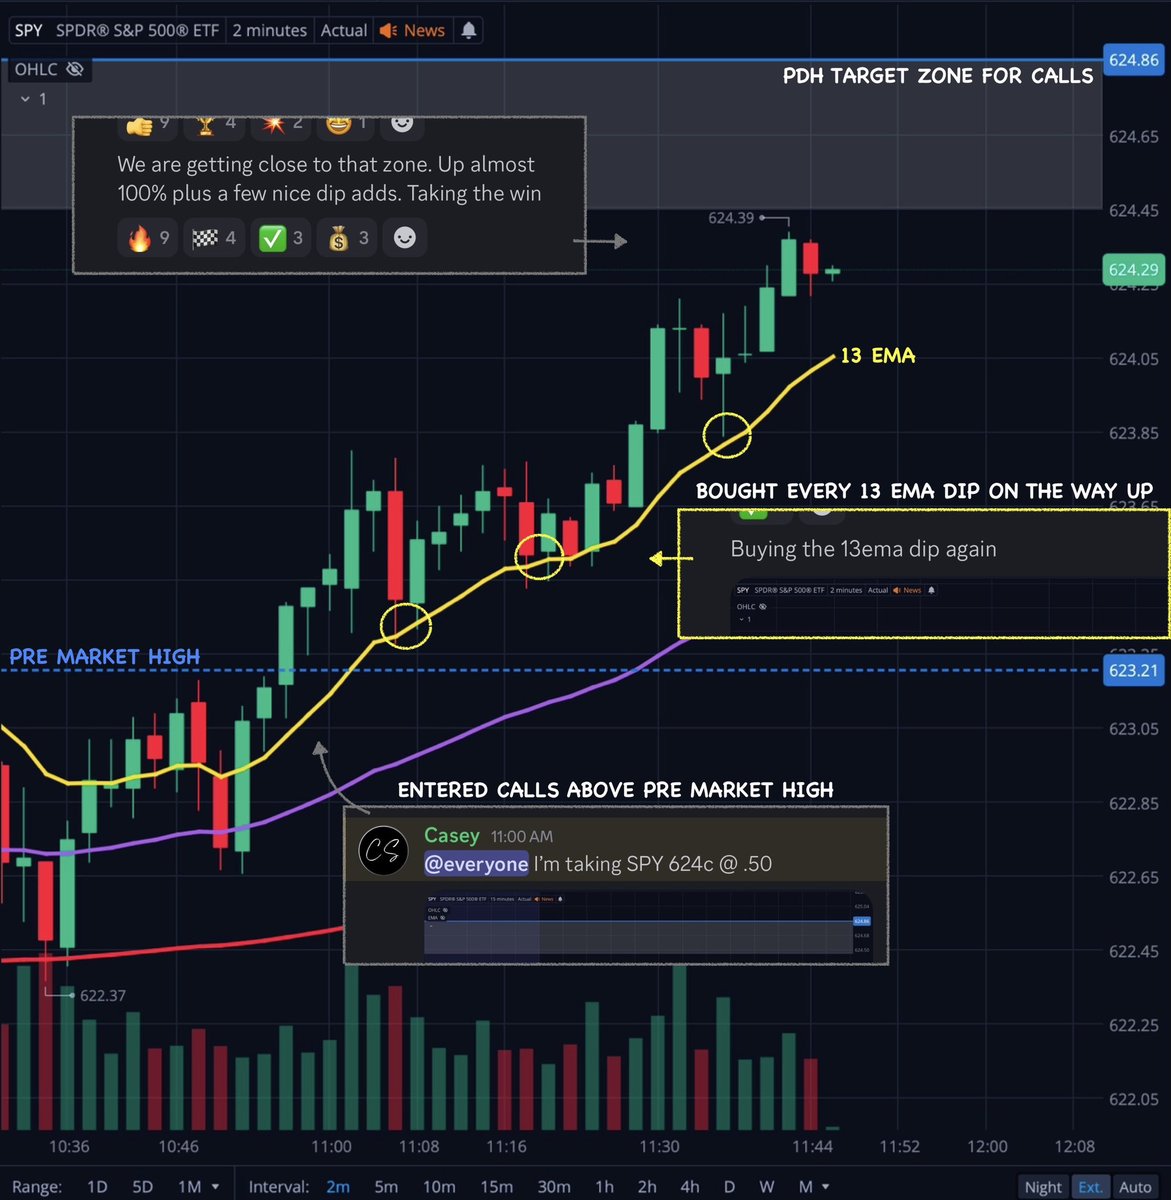
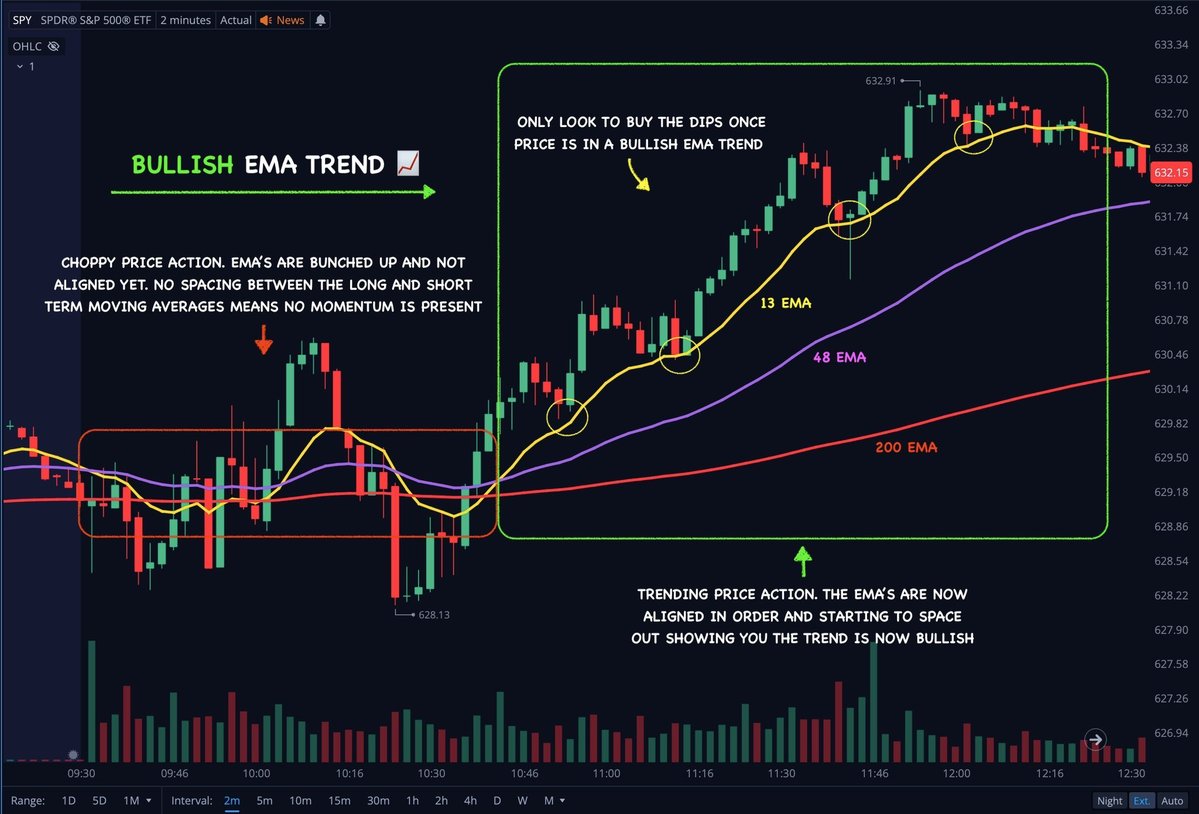
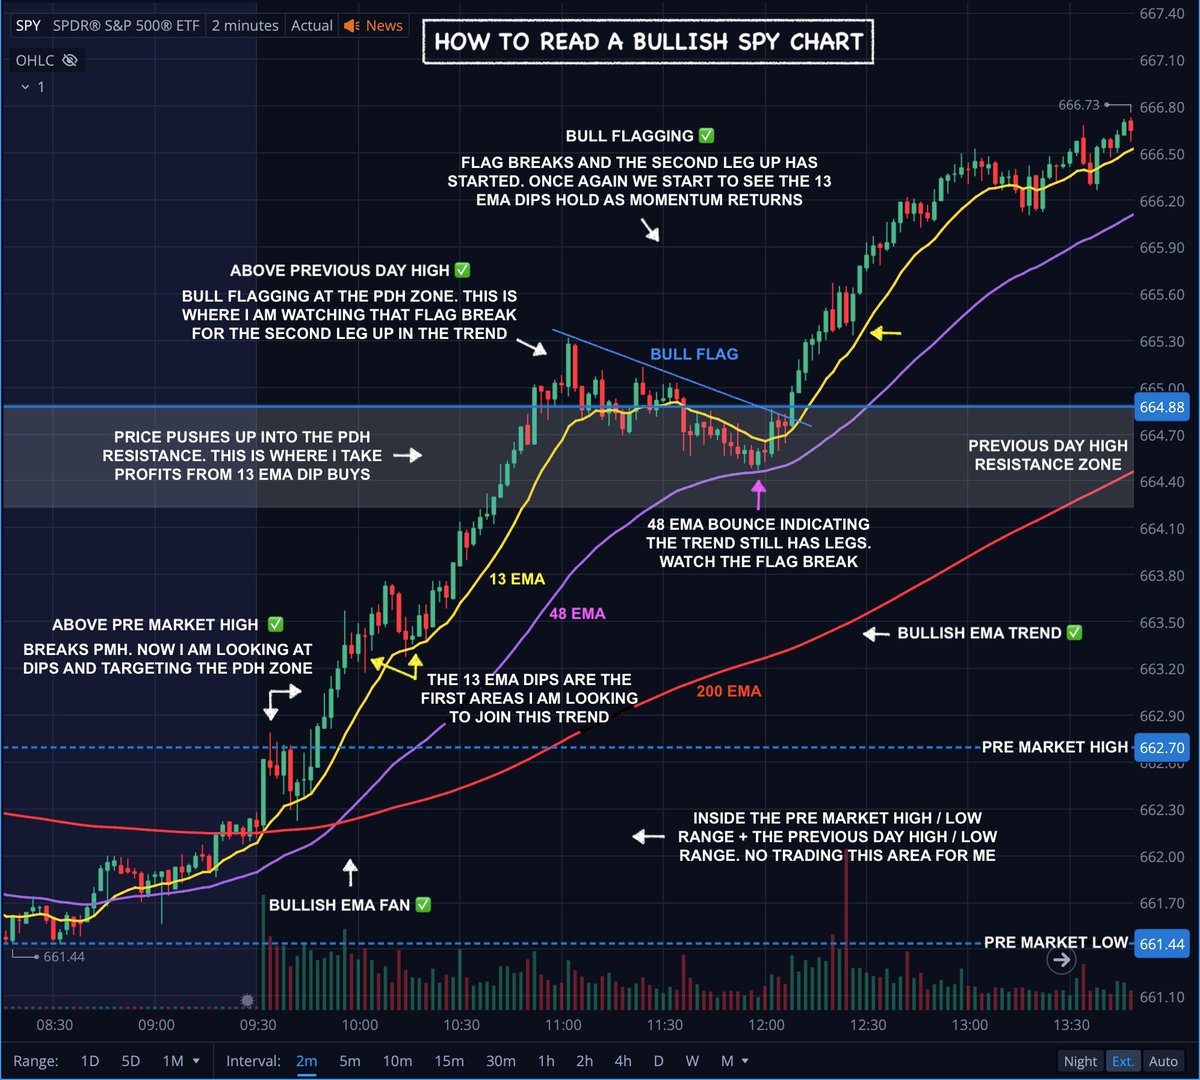
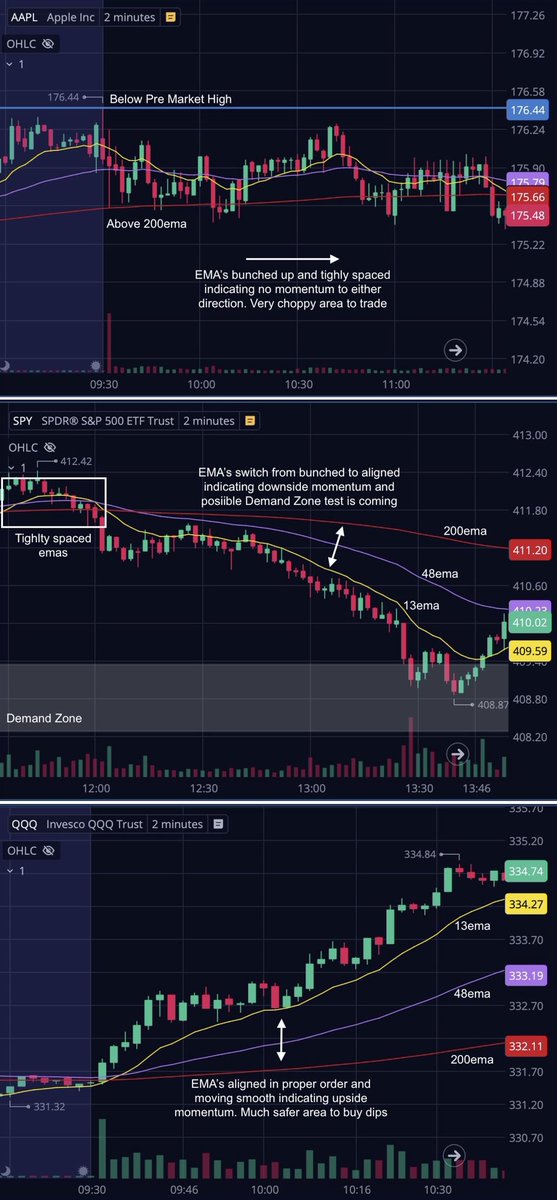
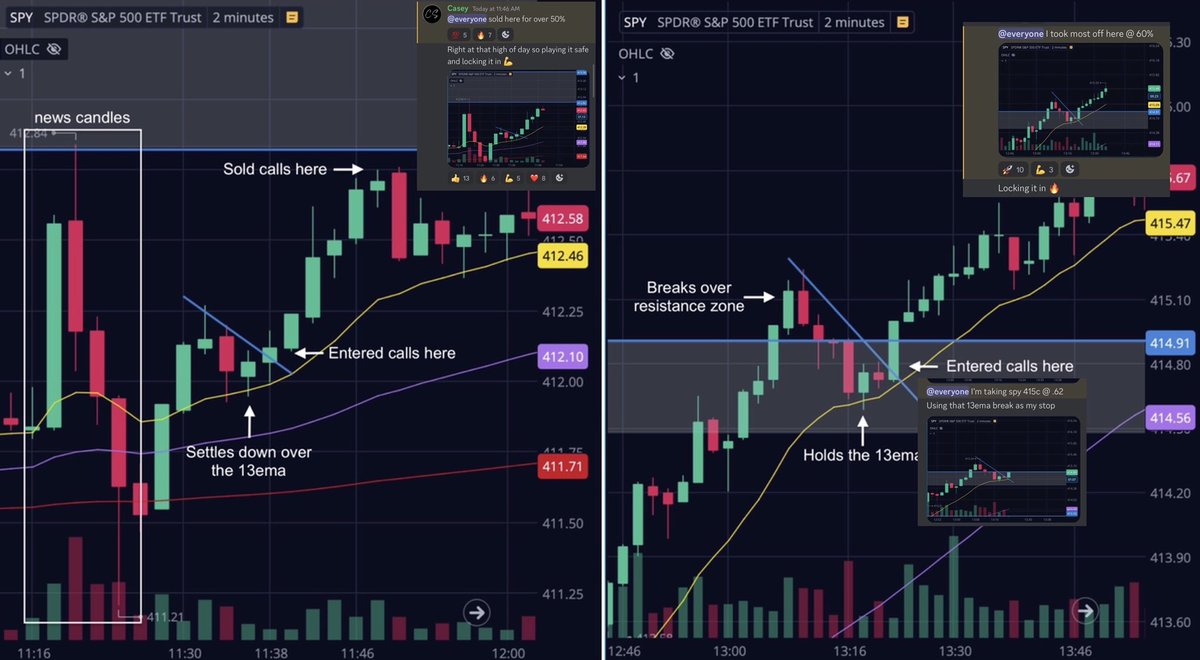
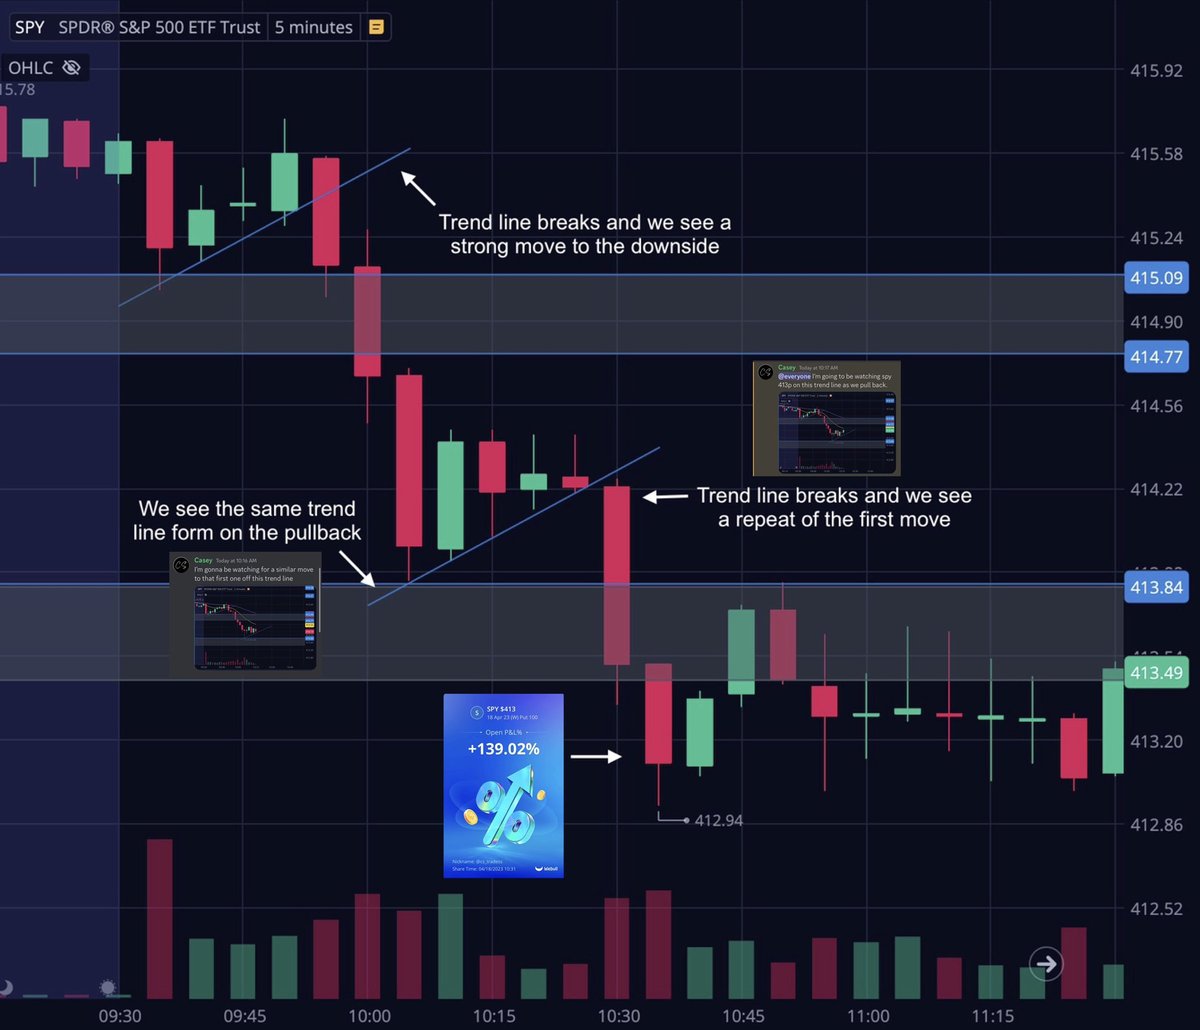
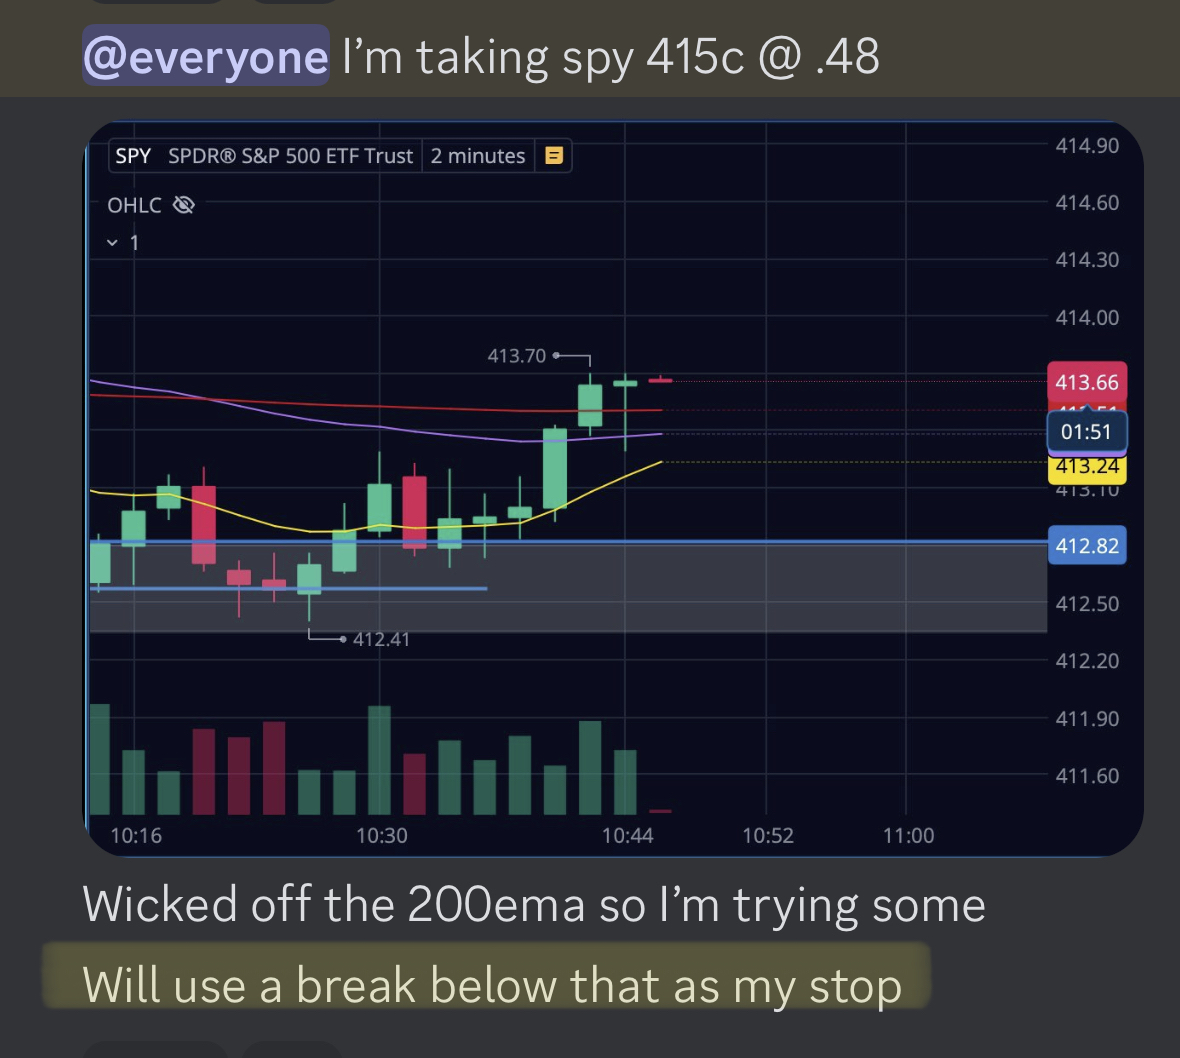
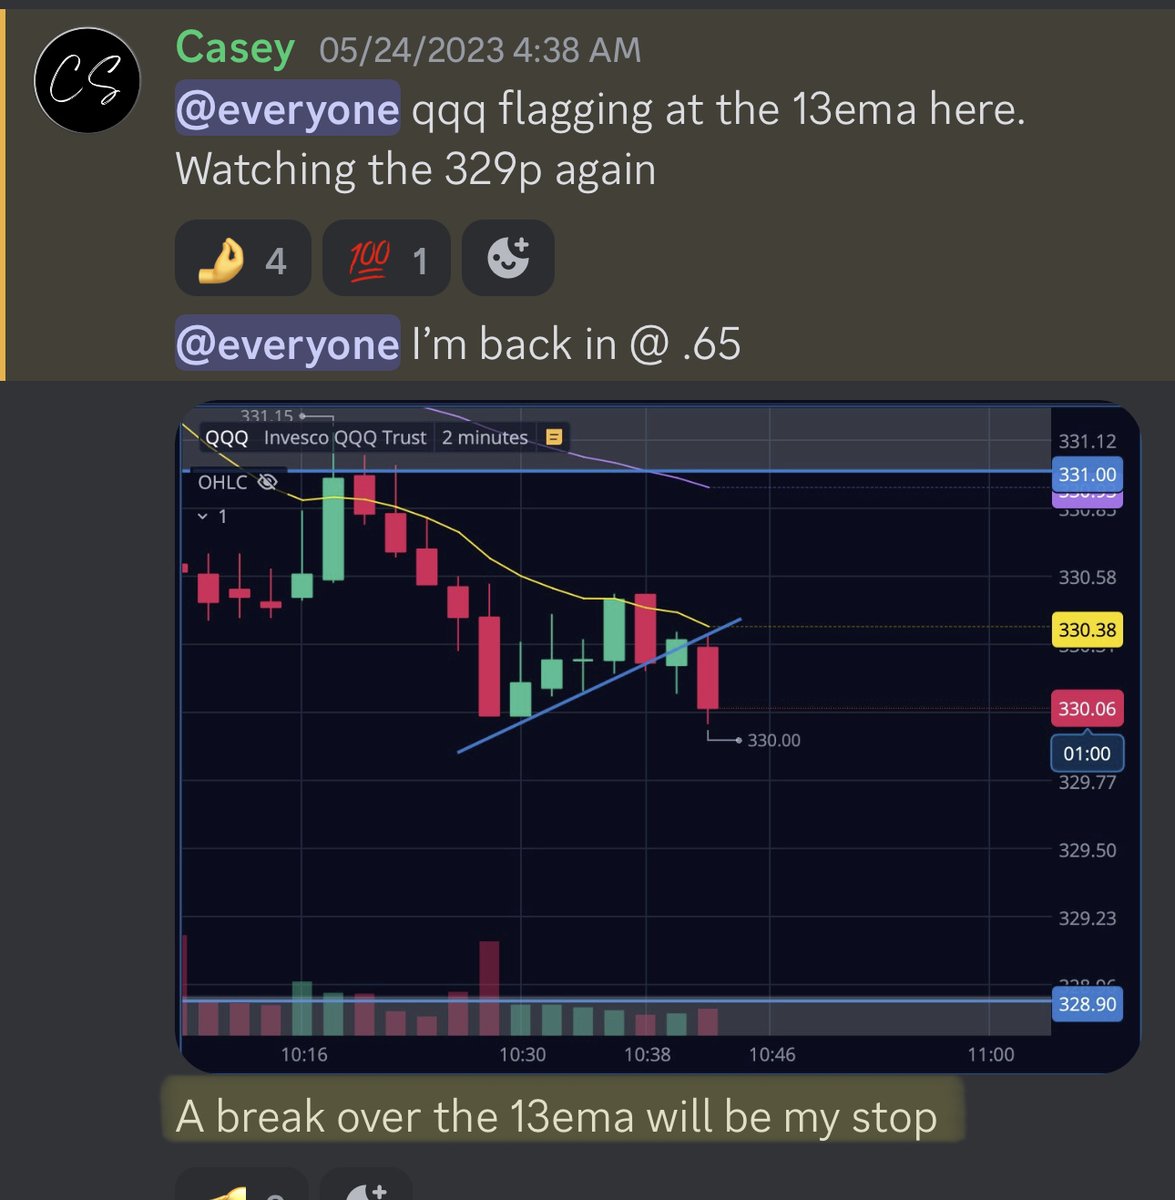
I keep 3 EMA's on my chart. 13ema - 48ema - 200ema.
I treat them as my 3 areas of support and resistance on pullbacks. As price moves from one zone to the next I look for pullbacks to these EMA's.
The 13ema on the 2 minute chart in my go to entry point most of the time 👇
I treat them as my 3 areas of support and resistance on pullbacks. As price moves from one zone to the next I look for pullbacks to these EMA's.
The 13ema on the 2 minute chart in my go to entry point most of the time 👇
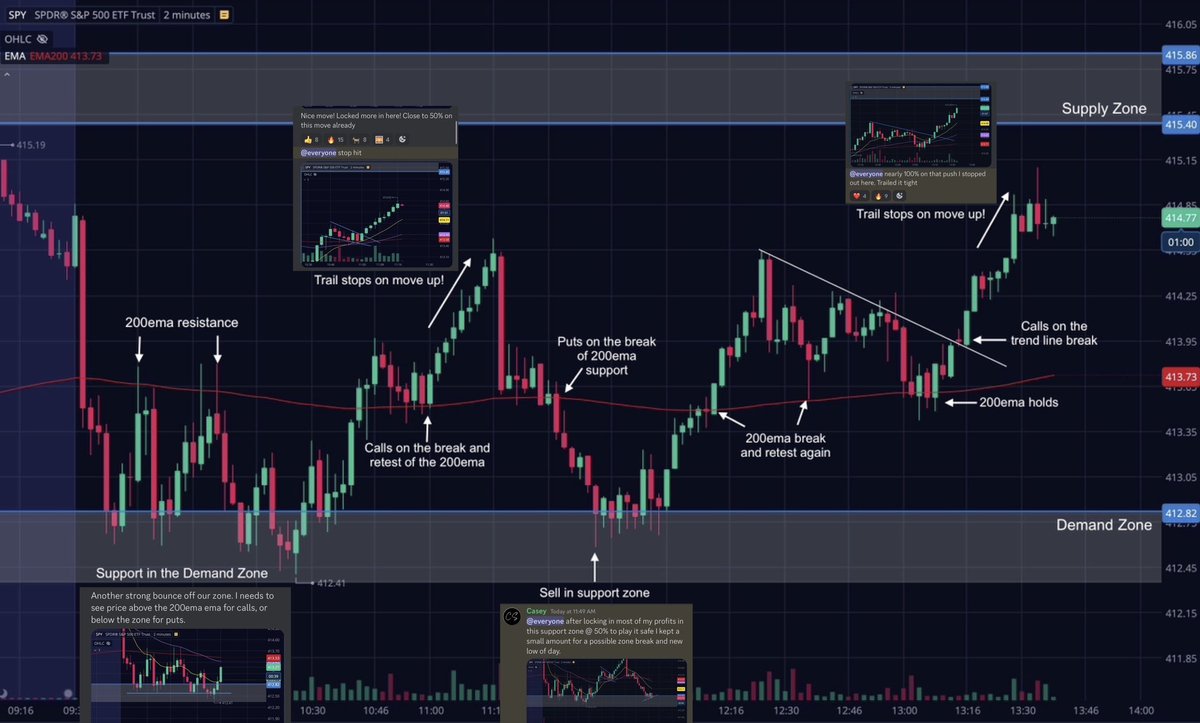
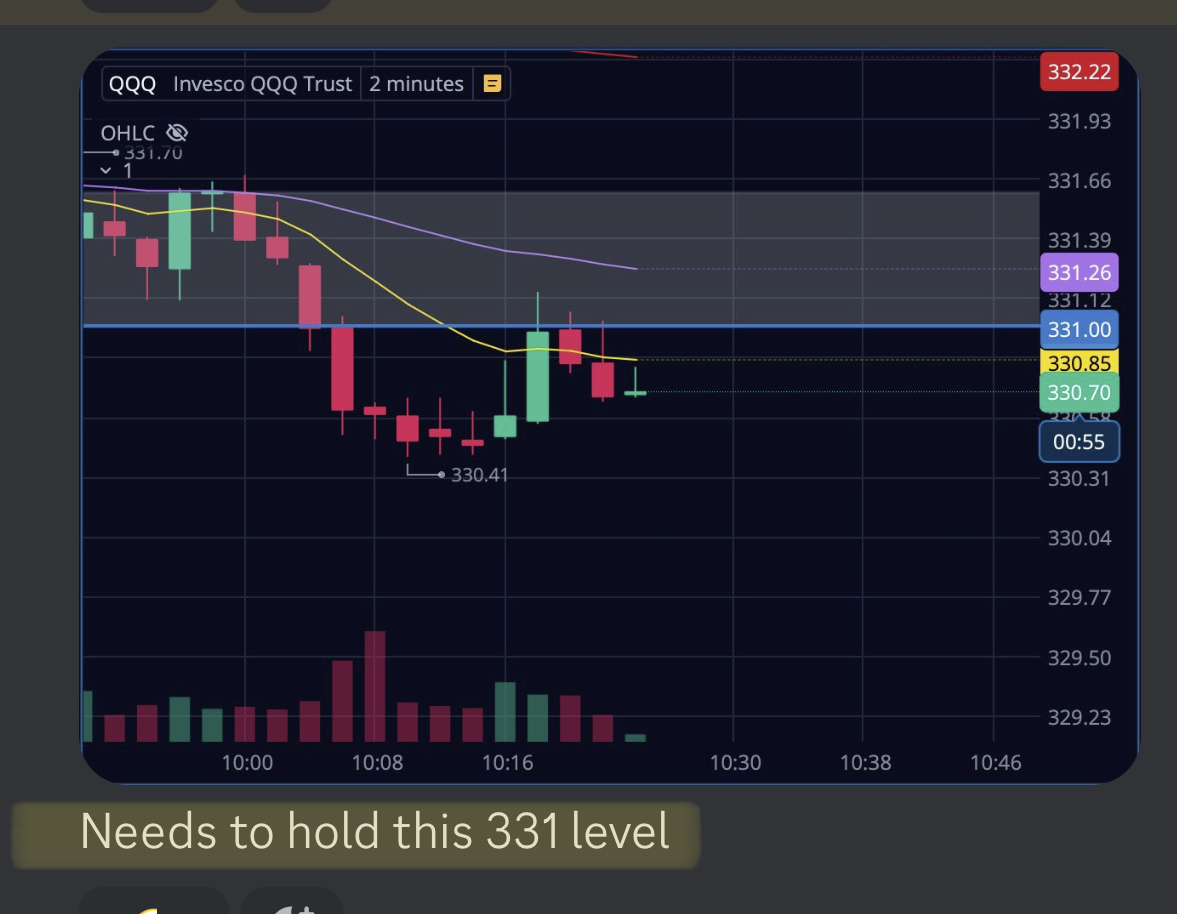
The 200ema is my line in the sand for direction. I also use it as a basic support and resistance level.
A good rule of thumb is price over the 200ema = Bullish, price under the 200ema = Bearish 👇
A good rule of thumb is price over the 200ema = Bullish, price under the 200ema = Bearish 👇
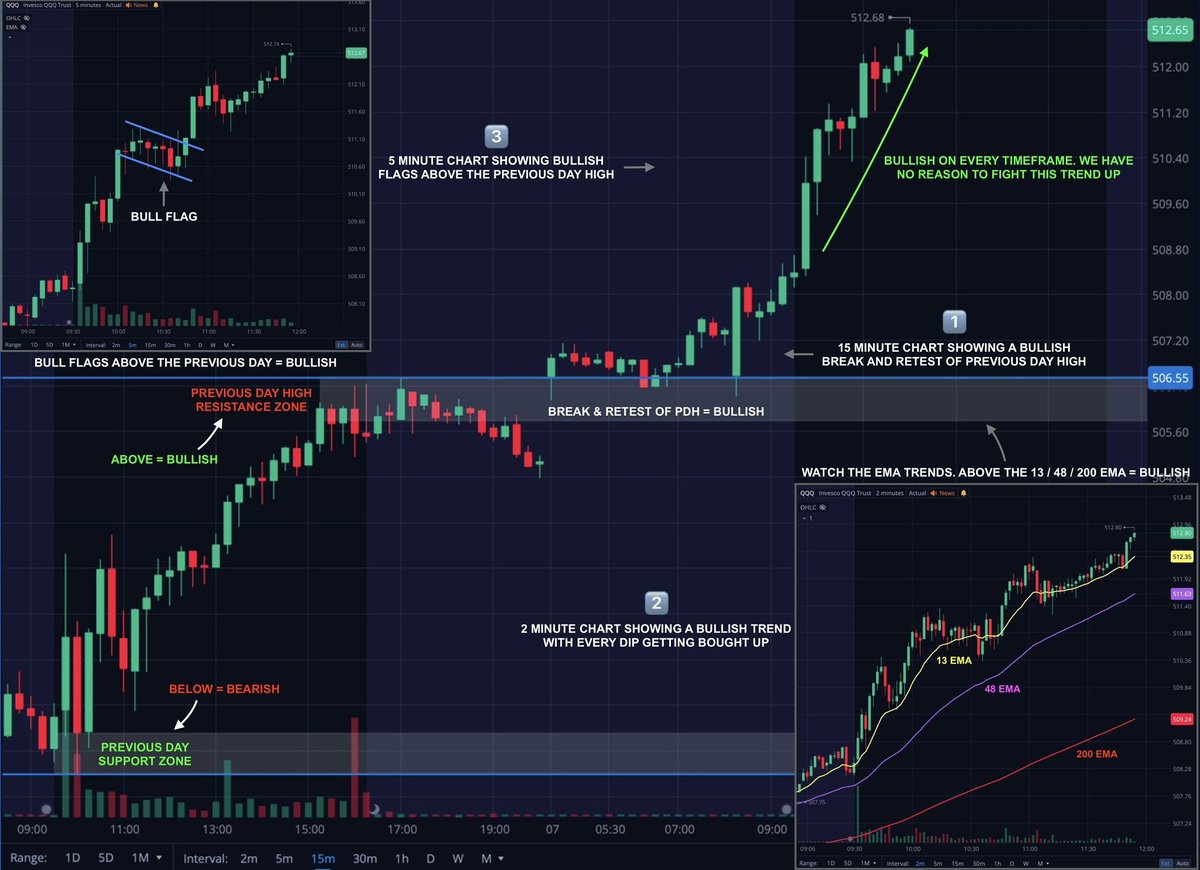
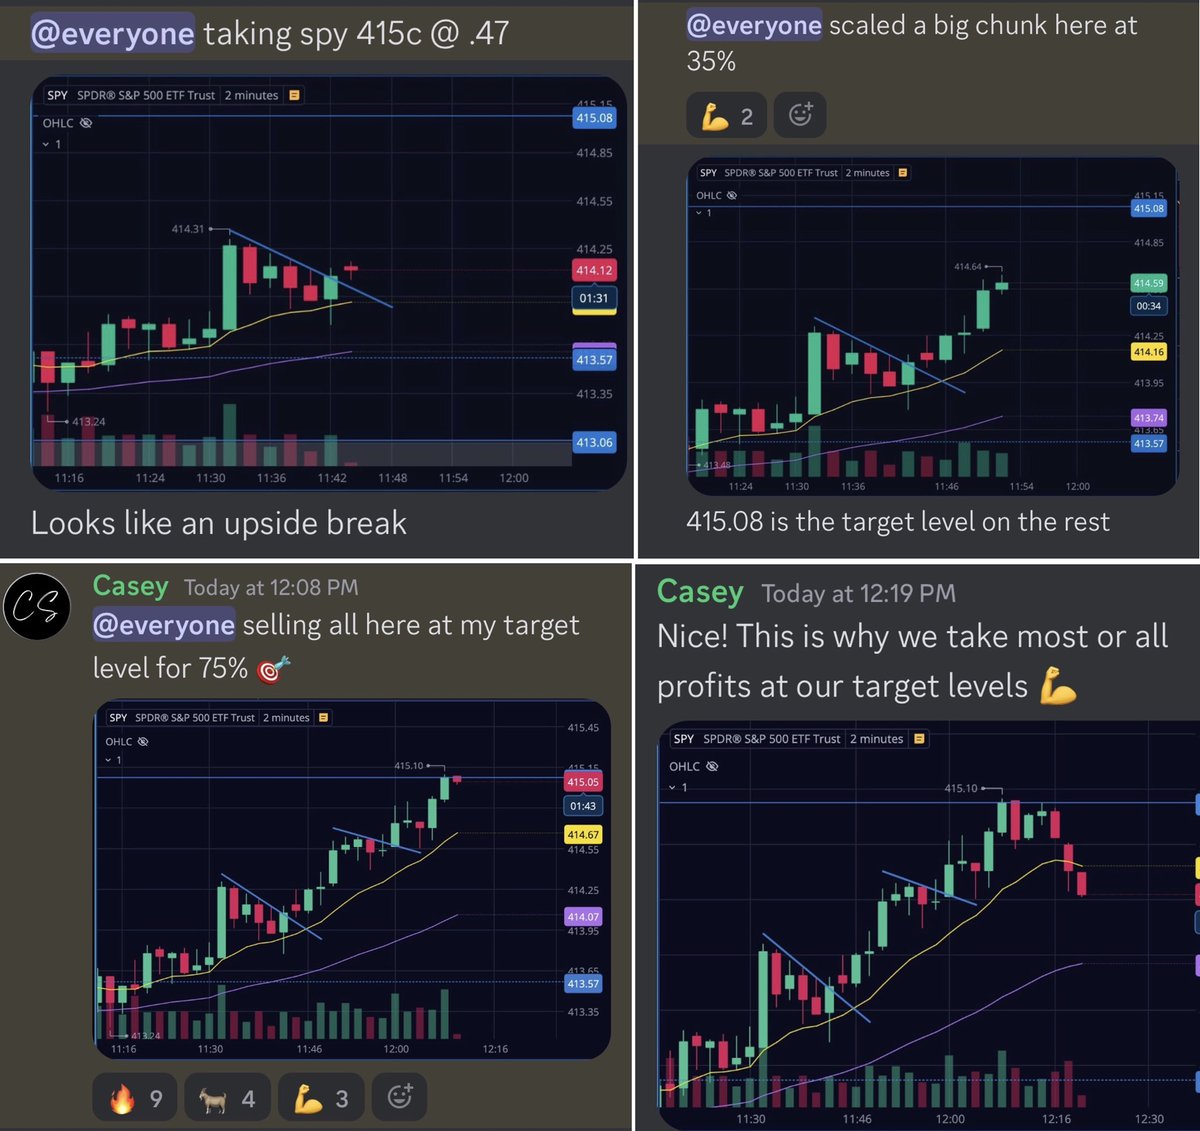
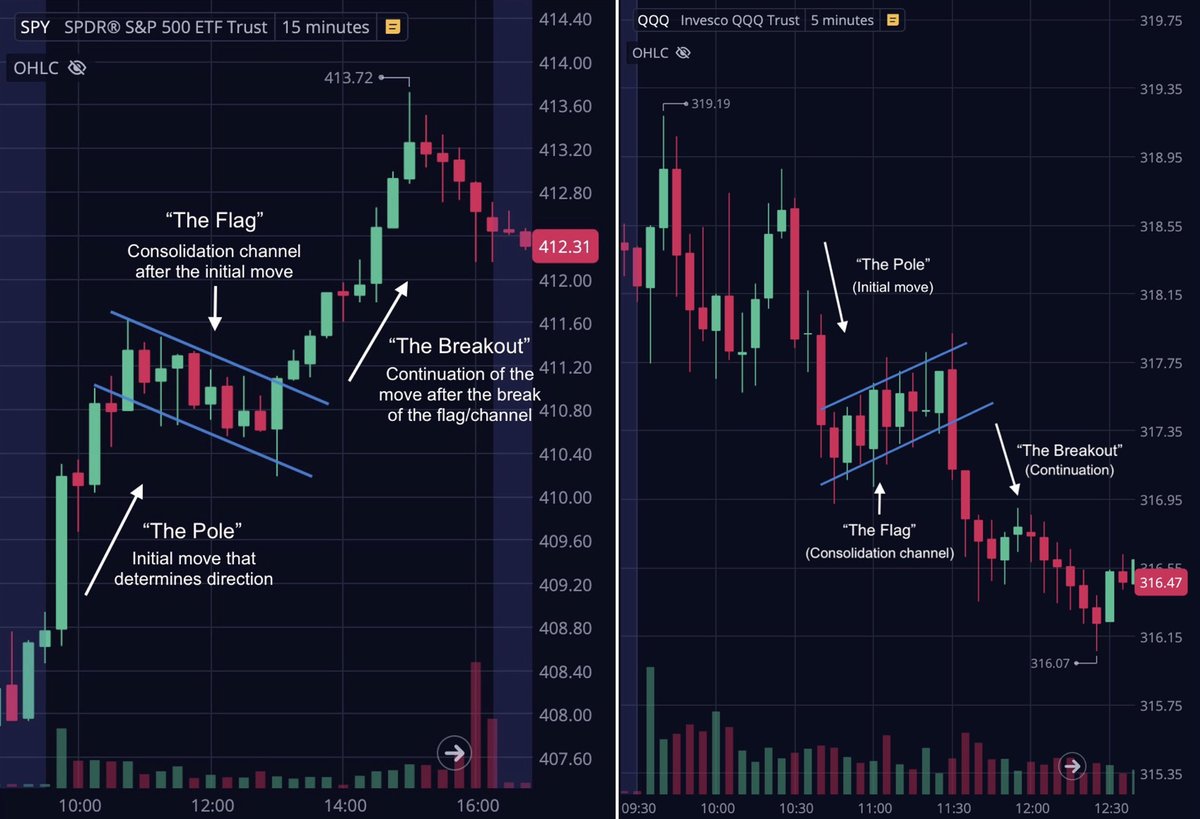
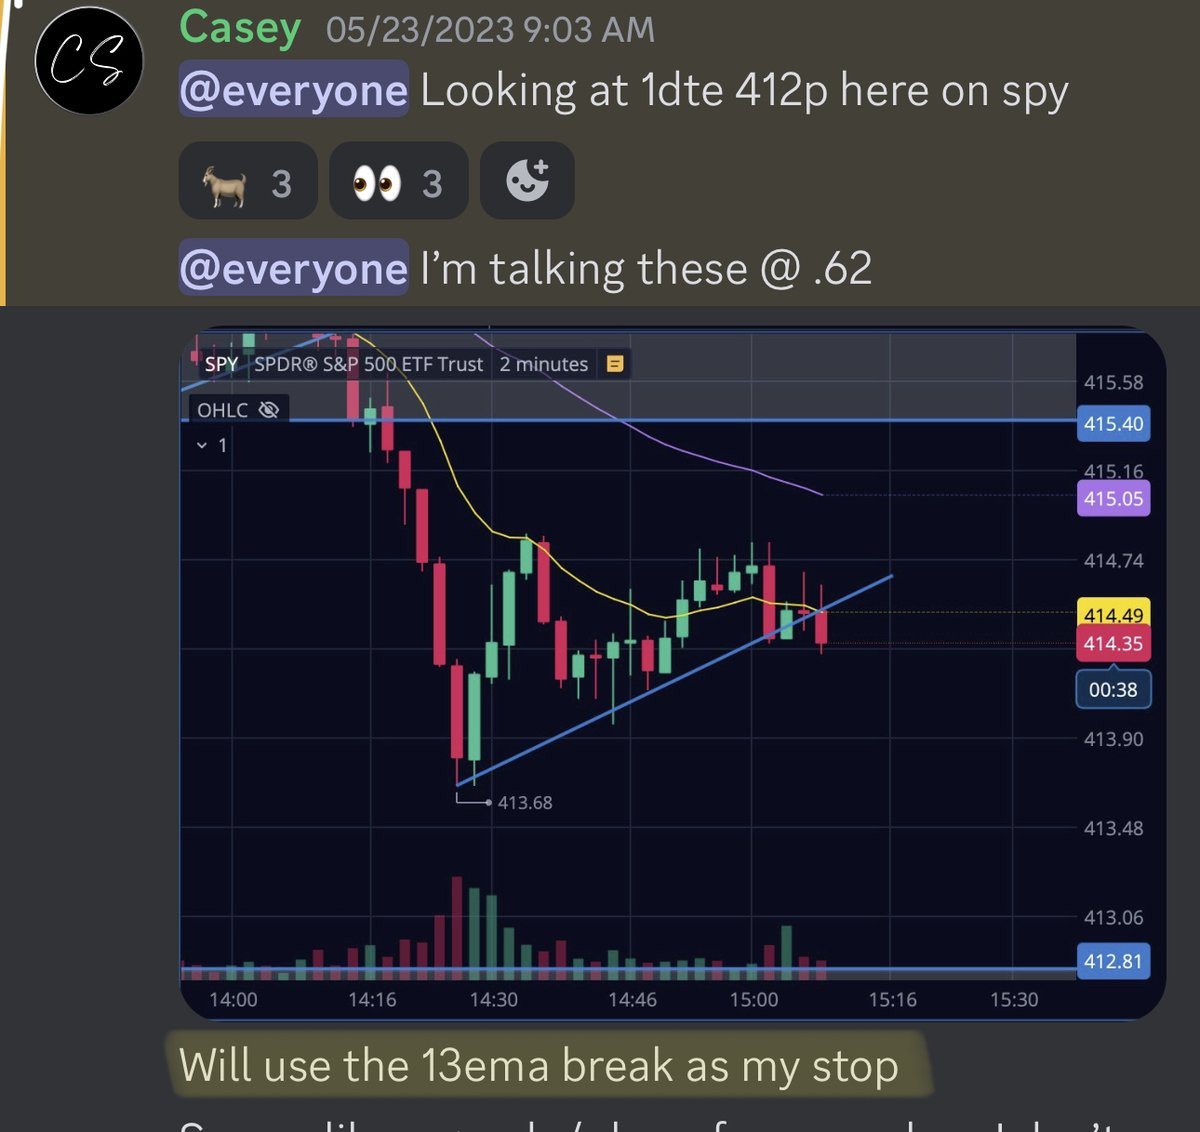
I have my zones for direction and my EMA's for entries. I add in basic chart patterns to help with gauging when momentum will pick up or slow down.
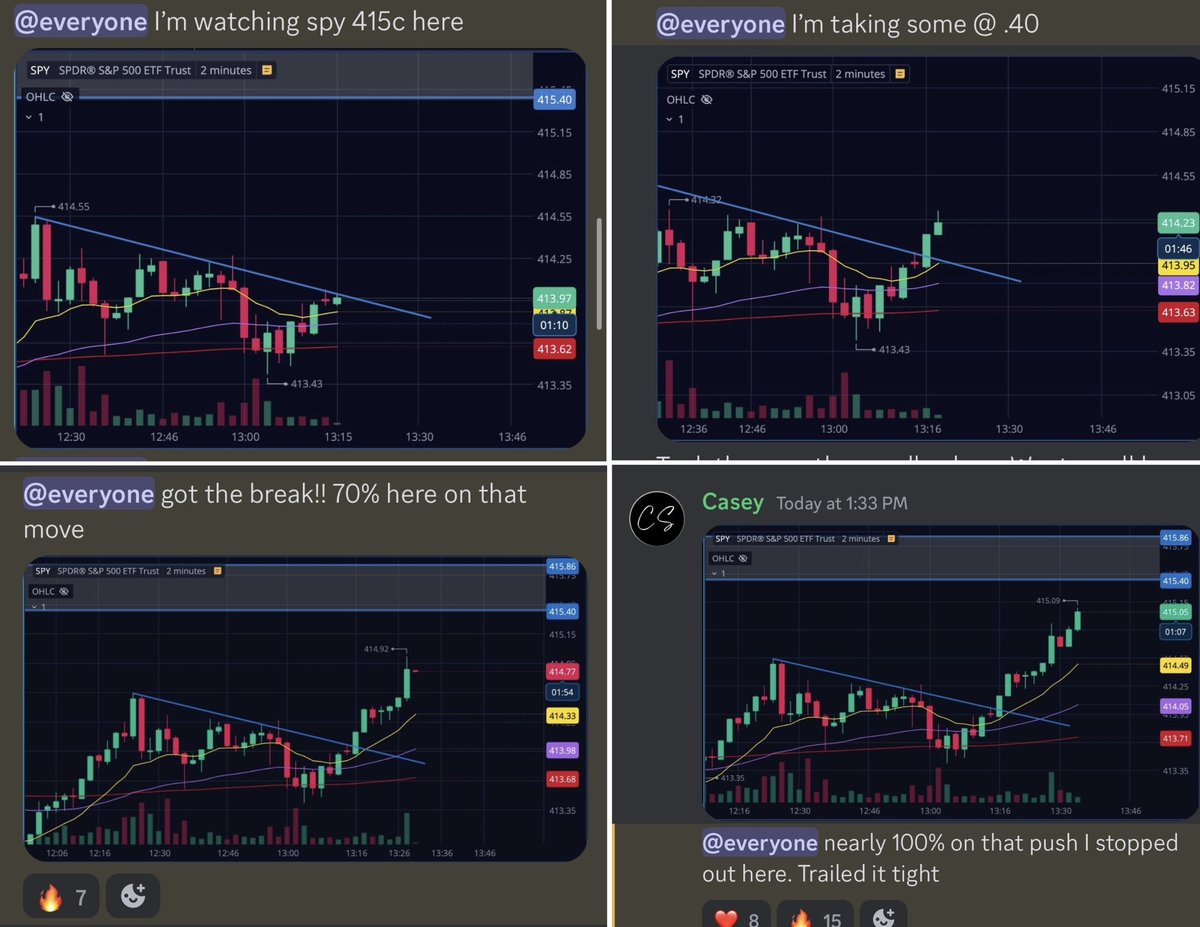
Some of my favorites are simple Bull/Bear flags and trend lines. They are some of the easiest to spot and really effective 👇
Some of my favorites are simple Bull/Bear flags and trend lines. They are some of the easiest to spot and really effective 👇
I have a set stop level for every trade. This guarantees that I will never take a huge loss on any 1 particular trade.
Everyone takes losses. Keeping them small in critical to remain consistent. Have a plan when entering and respect it. Small losses are easy to recover!
Everyone takes losses. Keeping them small in critical to remain consistent. Have a plan when entering and respect it. Small losses are easy to recover!
General overview of my trading strategy 👇
I use Supply & Demand zones to identify short term market trends then look for low risk pullback entries to the emas. I use basic chart and candlestick patterns to assist me with this.
I rinse & repeat the same process daily 👇
I use Supply & Demand zones to identify short term market trends then look for low risk pullback entries to the emas. I use basic chart and candlestick patterns to assist me with this.
I rinse & repeat the same process daily 👇
Thank you so much for reading my thread. Of course i'm only able to scratch the surface here but i hope it helps 🙏 If you liked it please give it ❤️ & ♻️ to share it with others!
Here is the link to the room where I trade with the team everyday! 👇
patreon.com/Team2Trading
Here is the link to the room where I trade with the team everyday! 👇
patreon.com/Team2Trading
• • •
Missing some Tweet in this thread? You can try to
force a refresh