$QQQ $TSLA
Let’s get started in this thread 🧵…
Let’s get started in this thread 🧵…
https://twitter.com/banana3stocks/status/1665881583574999042
$TSLA $QQQ
Ok so let’s get started, first to know where Tesla “Might” be going we need to figure out a simple concept at first…
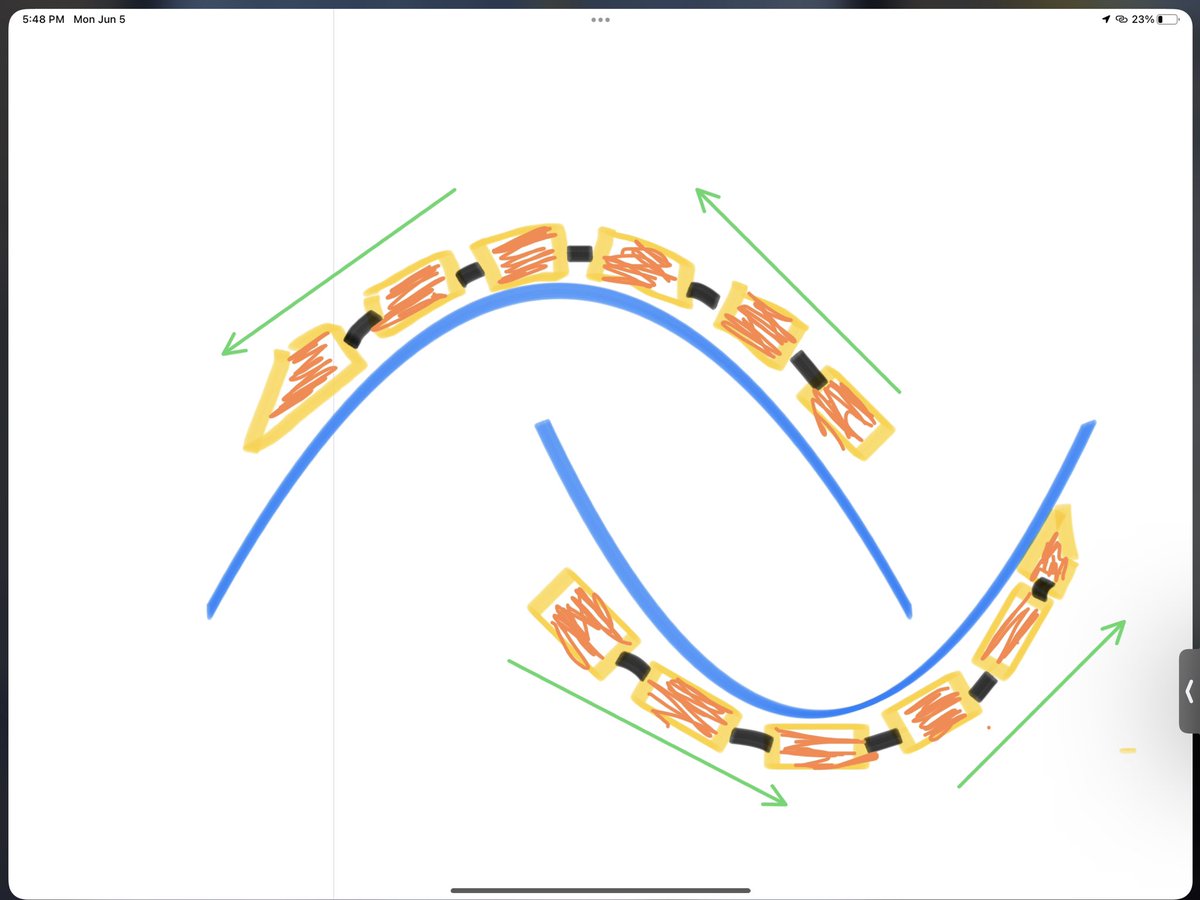
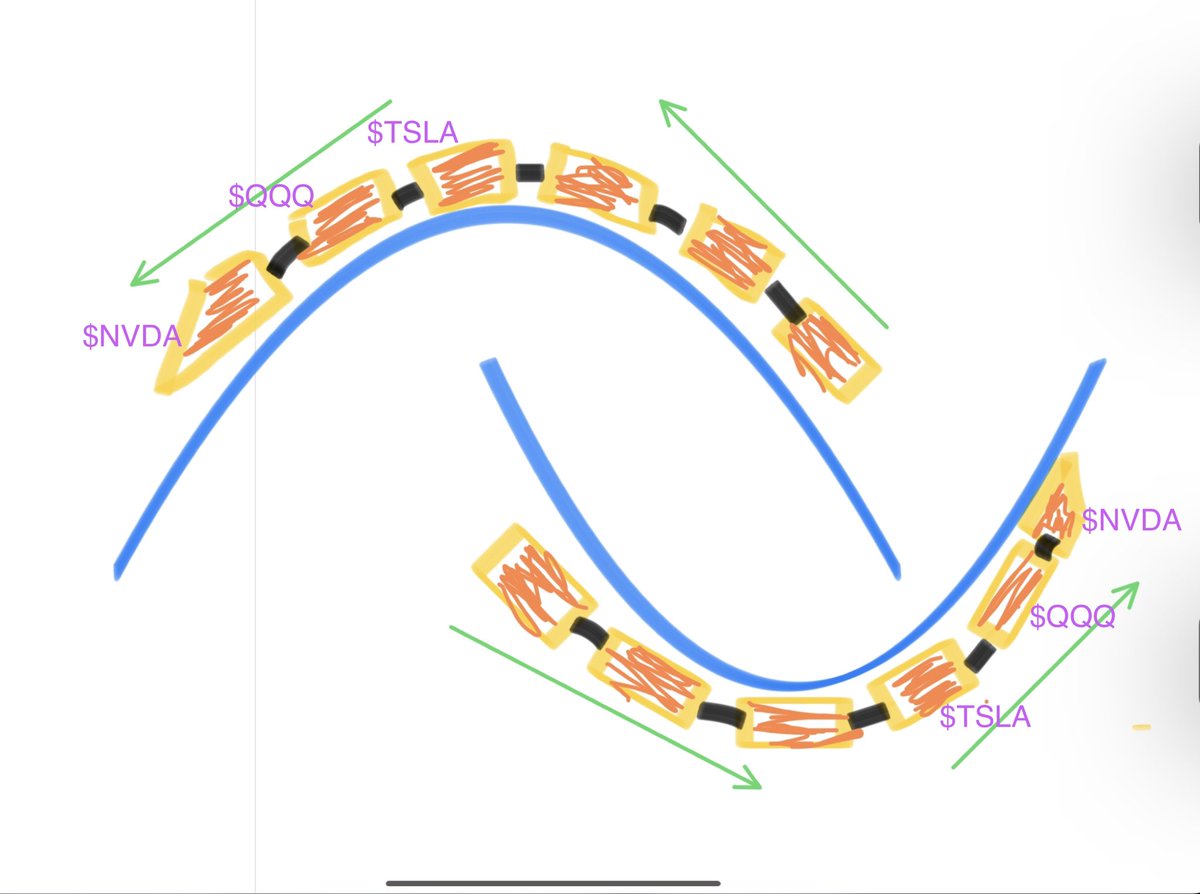
Where’s the rollercoaster 🎢 going?…
Whose in front 🎢?…
And whose about to catch up?…
So let’s quickly look at my bar napkin sketch ✍️ >>
Ok so let’s get started, first to know where Tesla “Might” be going we need to figure out a simple concept at first…
Where’s the rollercoaster 🎢 going?…
Whose in front 🎢?…
And whose about to catch up?…
So let’s quickly look at my bar napkin sketch ✍️ >>

…Let’s take a trip down memory lane, and let’s keep it simple as usual
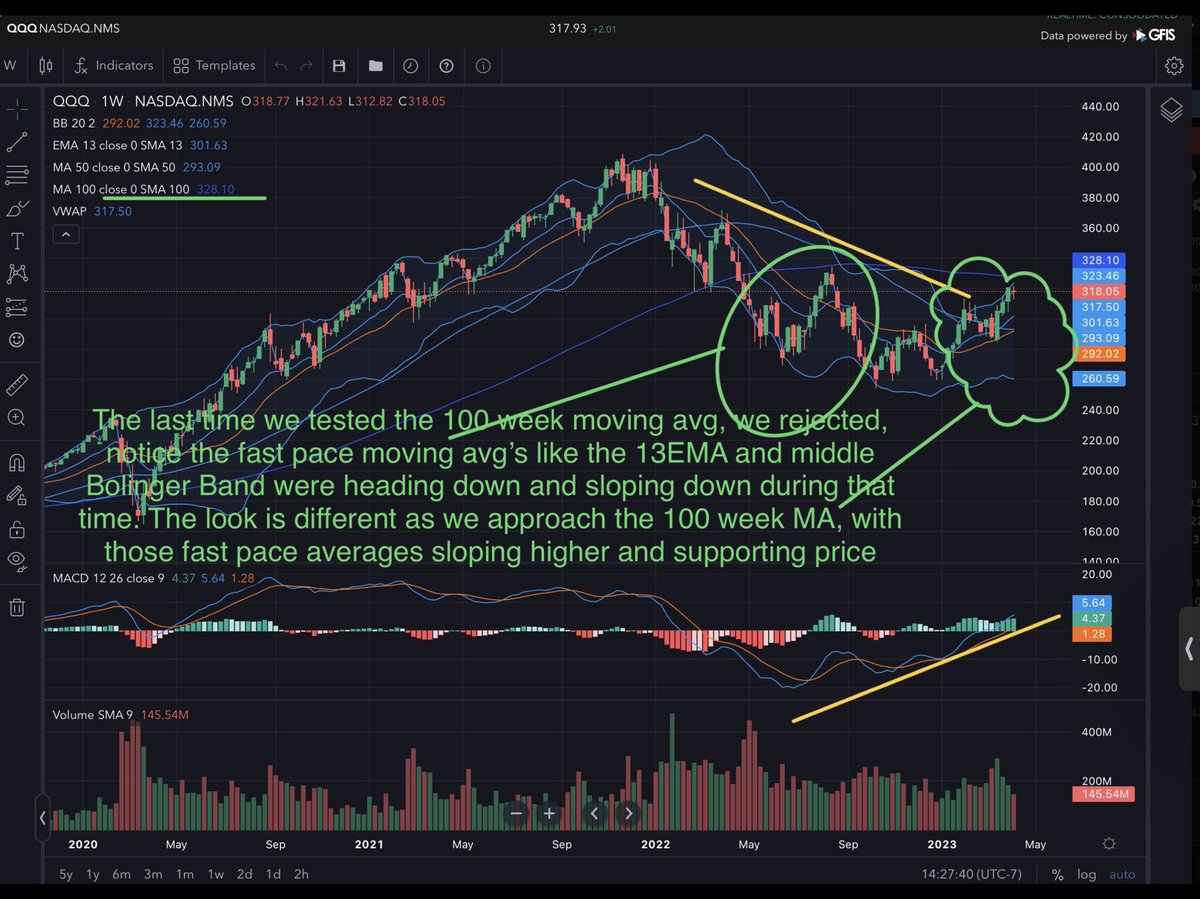
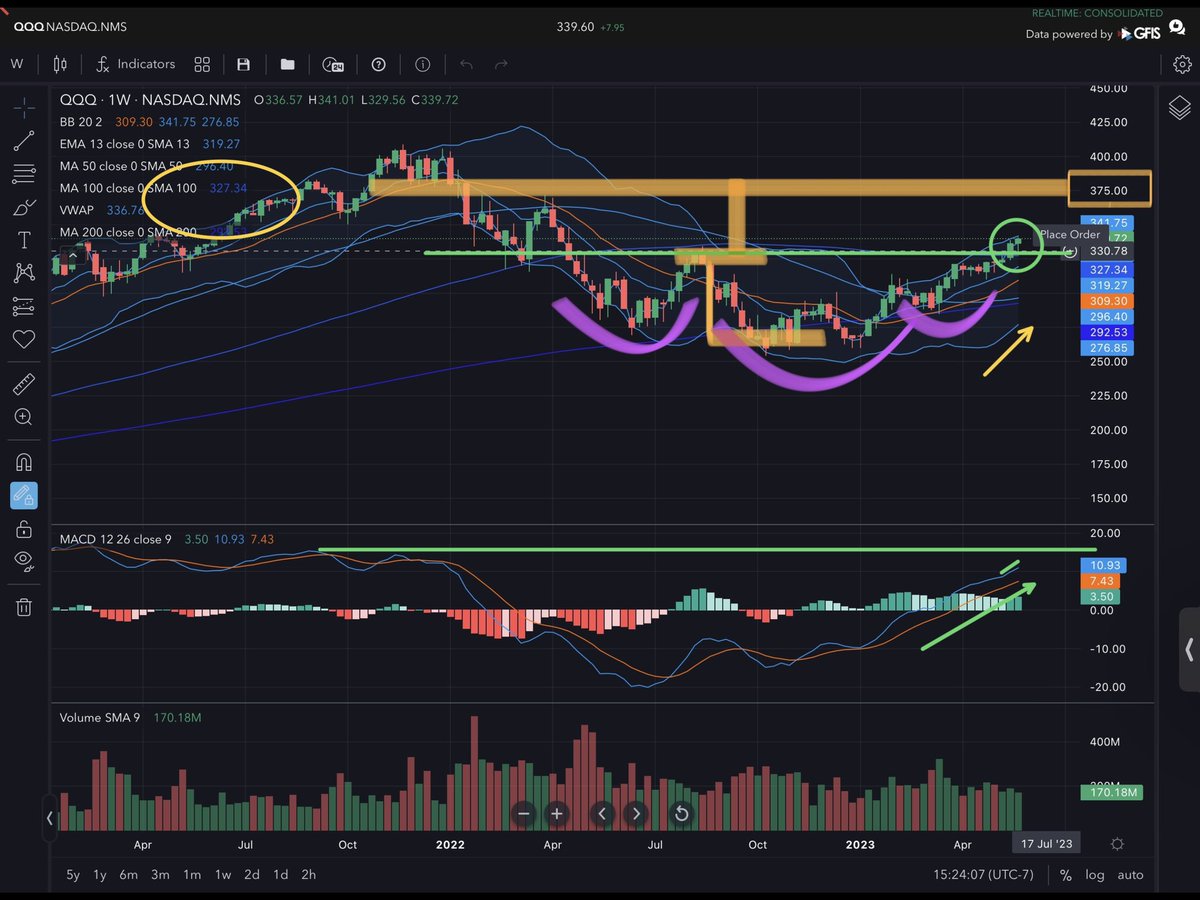
So many of you have heard me say for weeks and weeks, that “generally” speaking, when a stock wants to truly flip from 🐻 to 🐮 it will take a key longterm moving average like the Weekly 100MA, and start…
So many of you have heard me say for weeks and weeks, that “generally” speaking, when a stock wants to truly flip from 🐻 to 🐮 it will take a key longterm moving average like the Weekly 100MA, and start…

…to flatten out that MA (moving average). I’ve explained that from experience more often than not, instead of running up right to the 100 week moving average (which is simply the 100SMA-simple moving avg- on the WEEKLY Time Frame) and then fail…
Like QQQ did in august ….
Like QQQ did in august ….

…instead of tapping it and failing like in August as just mentioned in previous post…
It will begin to consolidate just under it or hug it, slowly grinding and bending it, beginning to flatten it out…
And that is generally the sign that it plans to flatten it out and turn..
It will begin to consolidate just under it or hug it, slowly grinding and bending it, beginning to flatten it out…
And that is generally the sign that it plans to flatten it out and turn..

…it up. Known as an S/R flip. S/R = Support / Resistance
Think of it as a ceiling and u keep jumping and slowly softening up the ceiling to jump thru it and turn it into a new floor of support
So the reason this study is important is because at the time $QQQ was $316…
Think of it as a ceiling and u keep jumping and slowly softening up the ceiling to jump thru it and turn it into a new floor of support
So the reason this study is important is because at the time $QQQ was $316…
… and everything I said back then and posted many more studies about the simplified topic tonight had played out to our road map 🗺️
We flattened out the 100 weekly moving avg in $QQQ. We tested it at $328 for a great trade, and then we did as we laid out! We S/R flipped…
We flattened out the 100 weekly moving avg in $QQQ. We tested it at $328 for a great trade, and then we did as we laid out! We S/R flipped…

….the $328 level in $QQQ. Then we turned it to support! Once it becomes support u start jumping up like before until u find a new ceiling…
We are went to $357 in the $QQQ today!!!
It all played out to our plan!
Look>>
We are went to $357 in the $QQQ today!!!
It all played out to our plan!
Look>>

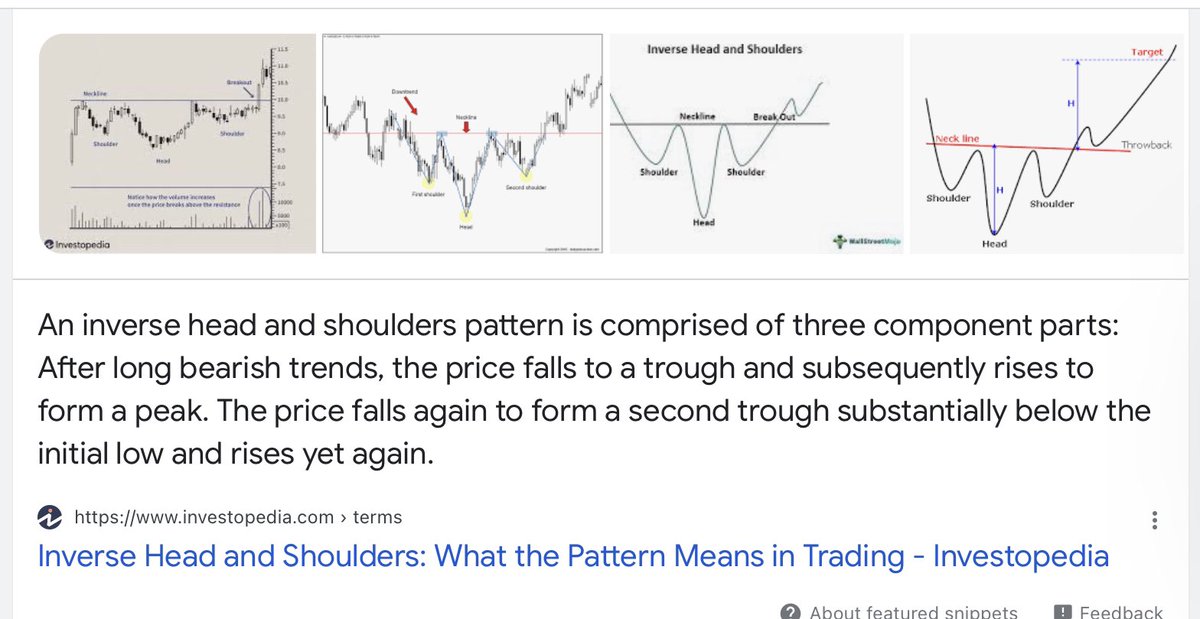
…The bonus is that many may remember this chart, it has true clear show of breaking the 100 week moving avg, it also shows something else that will be second “point of confluence” in $TSLA shortly which is the “Inverse Head and Shoulders Pattern”.
I want to add the 🎢pic again
I want to add the 🎢pic again
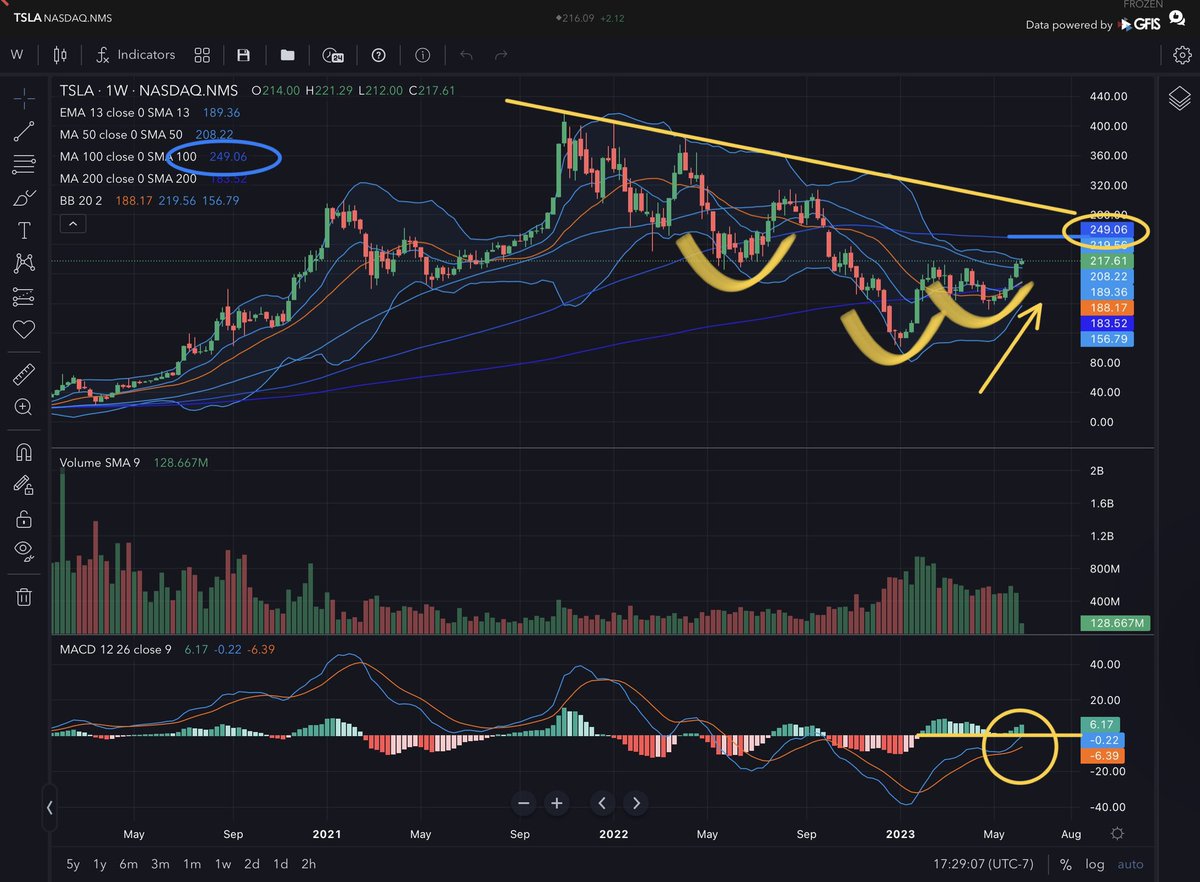
…so with all that $QQQ stuff, let’s take a look at $TSLA
And here’s the exact same Weekly Chart in TSLA like we did and looked at the $QQQ all the way back when it was $305-$316
This same weekly chart outlines “Simply” the same 100 Week Moving Avg study we did in QQQ>>
And here’s the exact same Weekly Chart in TSLA like we did and looked at the $QQQ all the way back when it was $305-$316
This same weekly chart outlines “Simply” the same 100 Week Moving Avg study we did in QQQ>>

…and right about now it’s starting to prob make sense
So do urself a favor at home right now!!!!!!
Pull up $TSLA and $QQQ chart and go to weekly candle stick chart!!!!
Take off EVERY INDICATOR
Only have a 100SMA (simple moving avg)
And u will see how $QQQ already did >>
So do urself a favor at home right now!!!!!!
Pull up $TSLA and $QQQ chart and go to weekly candle stick chart!!!!
Take off EVERY INDICATOR
Only have a 100SMA (simple moving avg)
And u will see how $QQQ already did >>

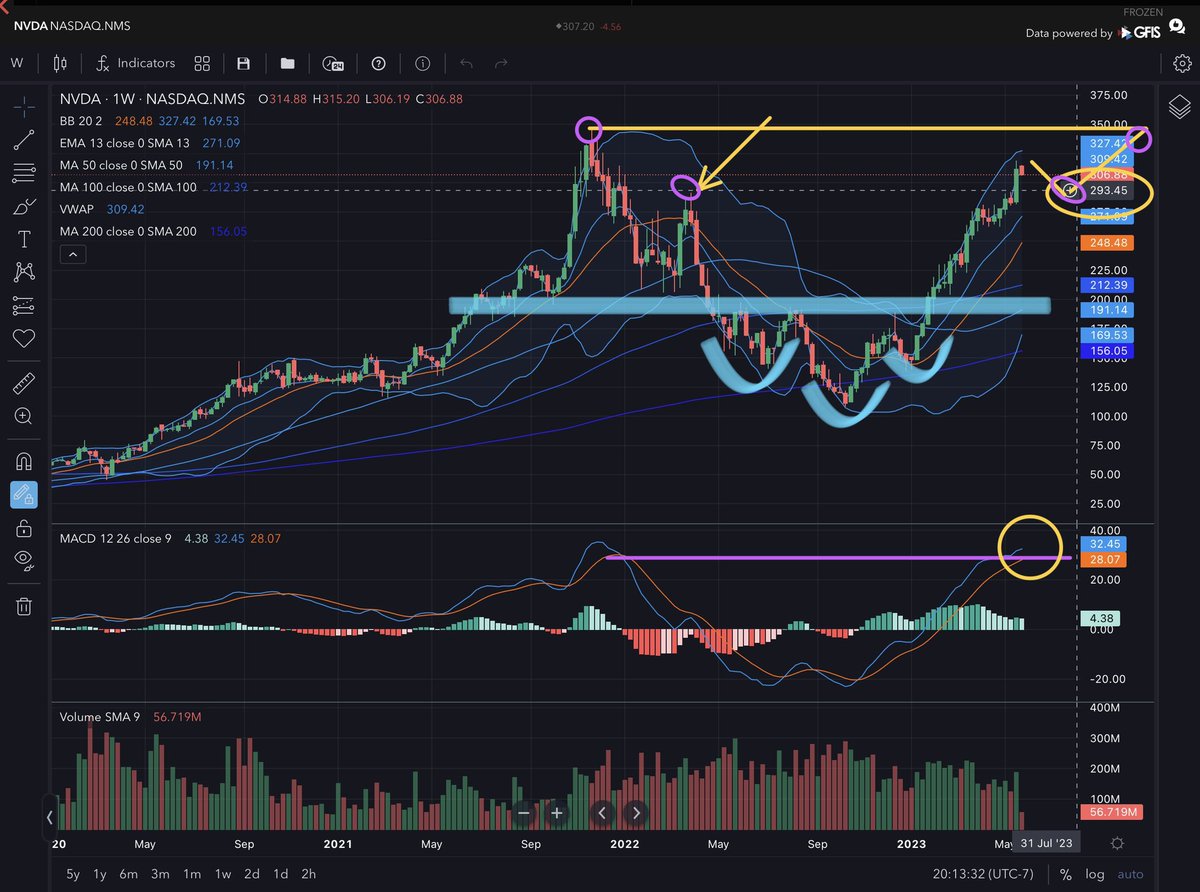
…So let’s back track one last second again…and look at $QQQ weekly chart again and discuss the bonus - “the second point of confluence”
We said it was the Inverse Head and Shoulders Pattern!
I DONT CARE ABOUT Head and Shoulders or IHS pattern on any small time frame!!!….
We said it was the Inverse Head and Shoulders Pattern!
I DONT CARE ABOUT Head and Shoulders or IHS pattern on any small time frame!!!….

….Like I just said I don’t care for either of those patterns on 1min, 5min, 15min, 30min charts. I start to maybe care in a daily time frame, but those patterns on a WEEKLY or MONTHLY time frame tend to mean a lot!!!
So we had a weekly Inverse Head & Shoulders on $QQQ so far>>
So we had a weekly Inverse Head & Shoulders on $QQQ so far>>

…so far it’s put almost $25 POINTS above the “Neckline” of the inverse head and shoulders pattern in $QQQ
Right??
Yes, so far so good…
Let’s see how another one played out in another leading stock sitting in front seat of the Roller Coaster 🎢 $NVDA right!!!???
Right??
Yes, so far so good…
Let’s see how another one played out in another leading stock sitting in front seat of the Roller Coaster 🎢 $NVDA right!!!???

…Sooooooo… $TSLA $QQQ
So not only does $TSLA have the trailing seat to the 100 Weekly Simple Moving Avg party 🎉….
But it also has a day to the WEEKLY Inverse Head and Shoulders party 🎉
Weekly 100SMA $TSLA 🎯 $249
Ur welcome 😘
🎢🎢🎢
🍌 🍌 🍌
💻 💻 💻
🤓🤓🤓
So not only does $TSLA have the trailing seat to the 100 Weekly Simple Moving Avg party 🎉….
But it also has a day to the WEEKLY Inverse Head and Shoulders party 🎉
Weekly 100SMA $TSLA 🎯 $249
Ur welcome 😘
🎢🎢🎢
🍌 🍌 🍌
💻 💻 💻
🤓🤓🤓

$TSLA $QQQ $NVDA
Summarization study 📖
Semiconductors are the “tip of the spear”, they tend to lead cycles up and down
We had $NVDA (semiconductor) go down first, then $QQQ followed, then $TSLA did…
Inversely (physics-equal and opposite reaction) we have the same now…
Summarization study 📖
Semiconductors are the “tip of the spear”, they tend to lead cycles up and down
We had $NVDA (semiconductor) go down first, then $QQQ followed, then $TSLA did…
Inversely (physics-equal and opposite reaction) we have the same now…


The End
• • •
Missing some Tweet in this thread? You can try to
force a refresh