The greatest trader of our generation:
Mark Minervini.
2 Time USIC champion (1997 & 2021).
A return of 33,554% from 1994 to 1999 (~220% a year).
Mark's secret sauce?
VCP: Volatility contraction pattern.
Here is explain:
What is a VCP? &
How to count the Ts correctly?
1/n twitter.com/i/web/status/1…
Mark Minervini.
2 Time USIC champion (1997 & 2021).
A return of 33,554% from 1994 to 1999 (~220% a year).
Mark's secret sauce?
VCP: Volatility contraction pattern.
Here is explain:
What is a VCP? &
How to count the Ts correctly?
1/n twitter.com/i/web/status/1…
What is a VCP?
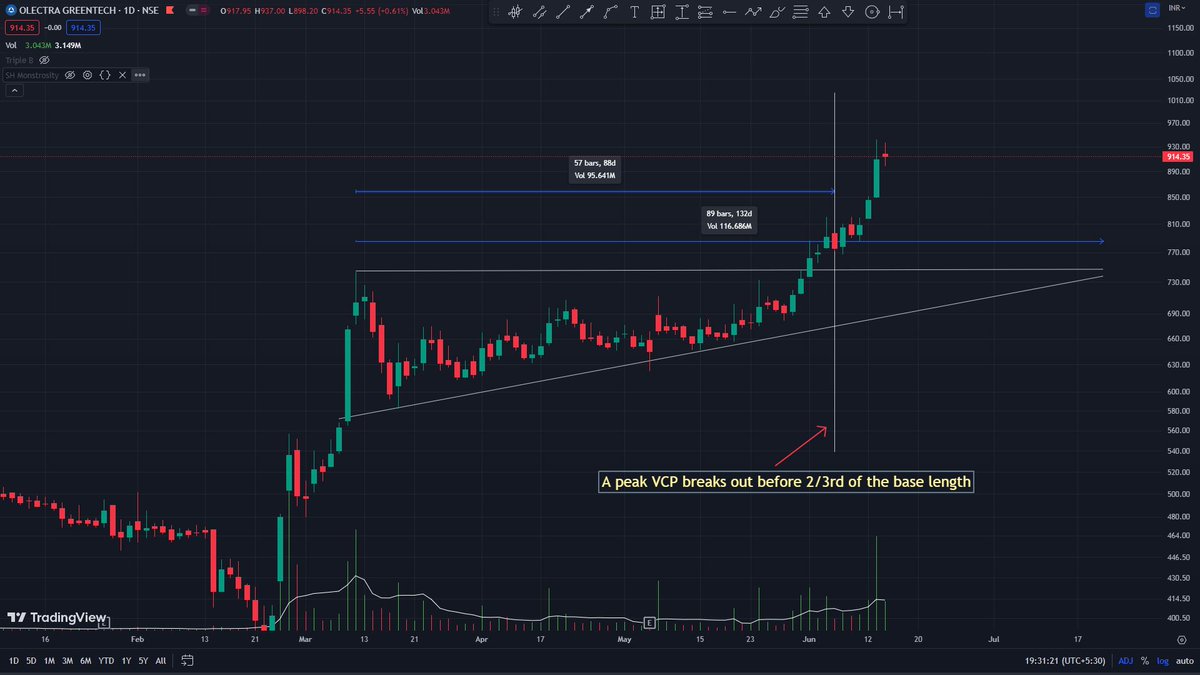
VCP is a characteristic of a constructive base, in which there is a decrease in the price swing from a pivot high to a pivot low (measured in terms of %) inside a base from left to right; before eventually breaking out
Beautiful VCP in Olectra Greentech.
2/n
VCP is a characteristic of a constructive base, in which there is a decrease in the price swing from a pivot high to a pivot low (measured in terms of %) inside a base from left to right; before eventually breaking out
Beautiful VCP in Olectra Greentech.
2/n

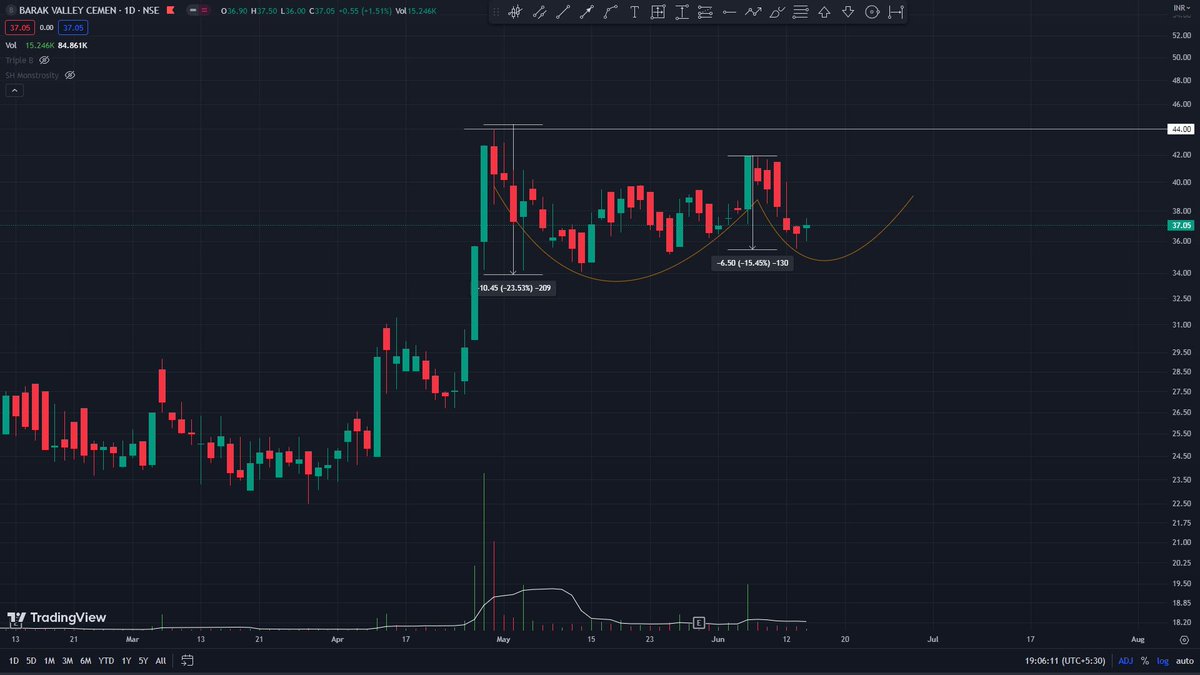
VCP appears in many chart patterns viz. symmetrical triangle, an ascending triangle, a descending triangle, the mast of a flag, and many other places.
Each contraction is called Ts (due to its shape)
See an ongoing VCP in BVCL: 2nd T
3/n
Each contraction is called Ts (due to its shape)
See an ongoing VCP in BVCL: 2nd T
3/n
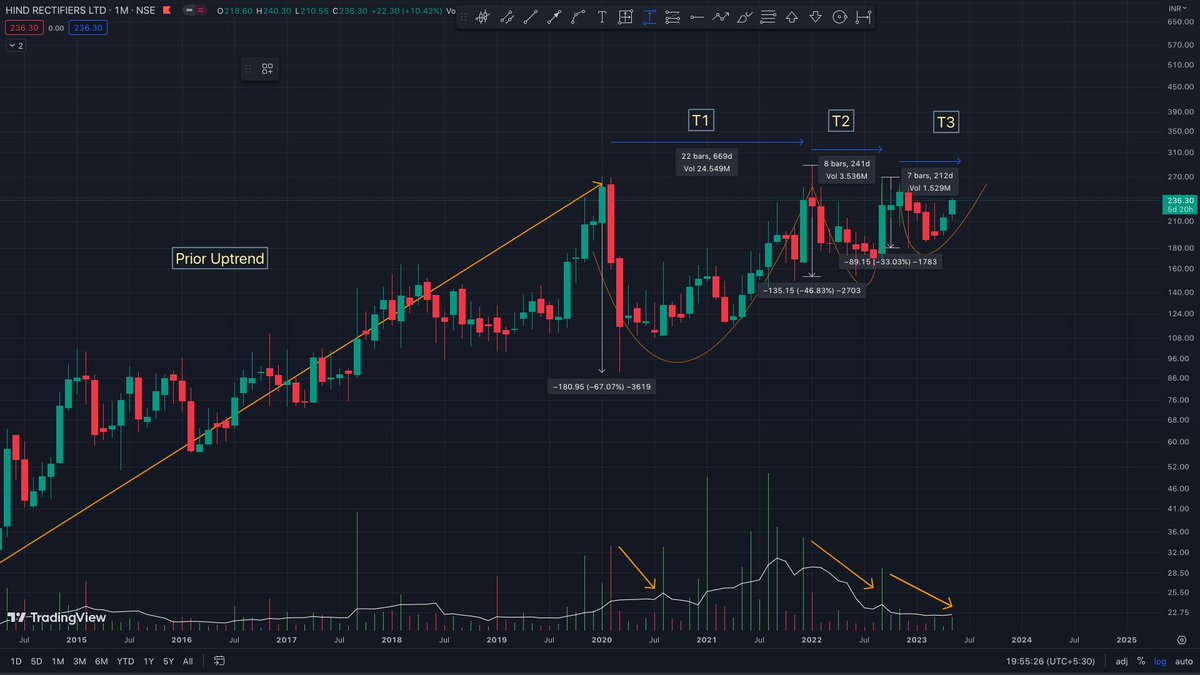
A perfect VCP has these 5 salient characteristics:
1. A prior uptrend
Without a prior uptrend, even if the base displays all the VCP characteristics, it might not result in a breakout.
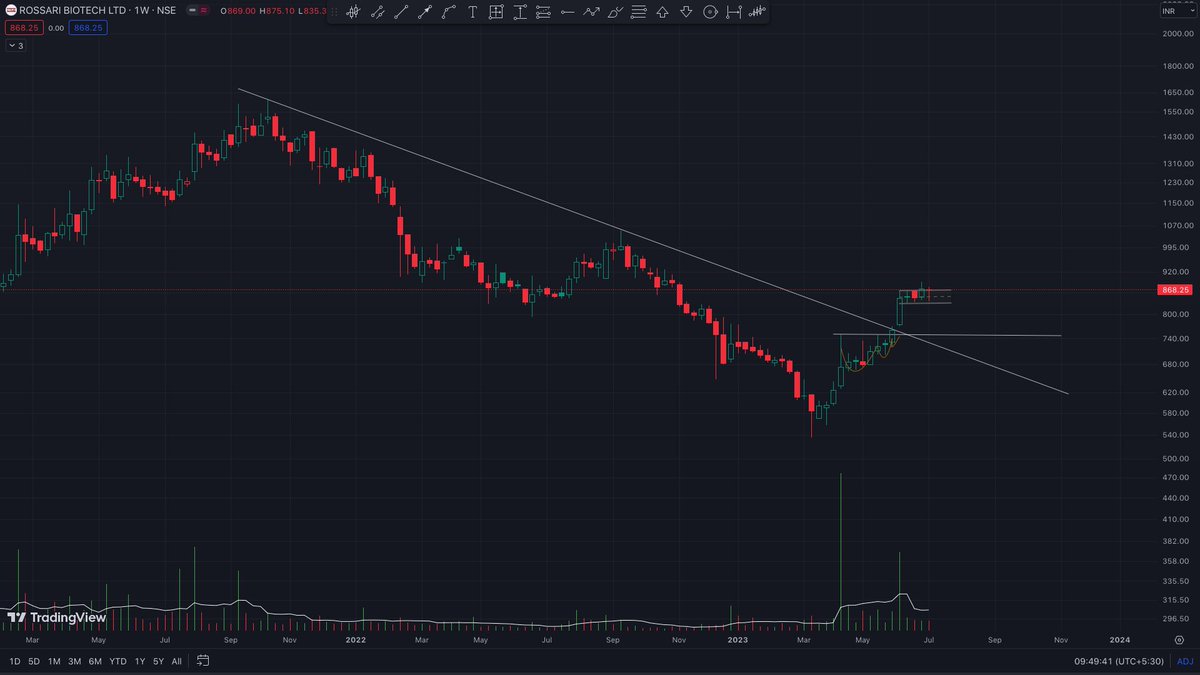
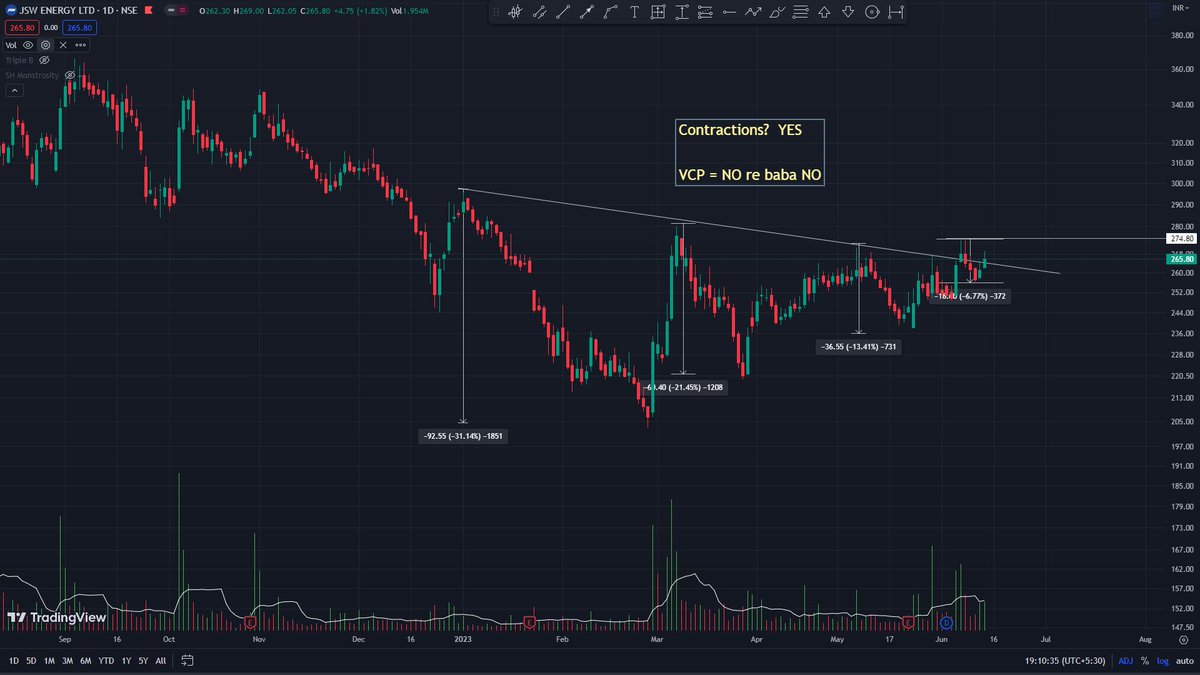
JSW Energy: An reversal Base, ready for a trend reversal. But NOT a VCP.
4/n
1. A prior uptrend
Without a prior uptrend, even if the base displays all the VCP characteristics, it might not result in a breakout.
JSW Energy: An reversal Base, ready for a trend reversal. But NOT a VCP.
4/n
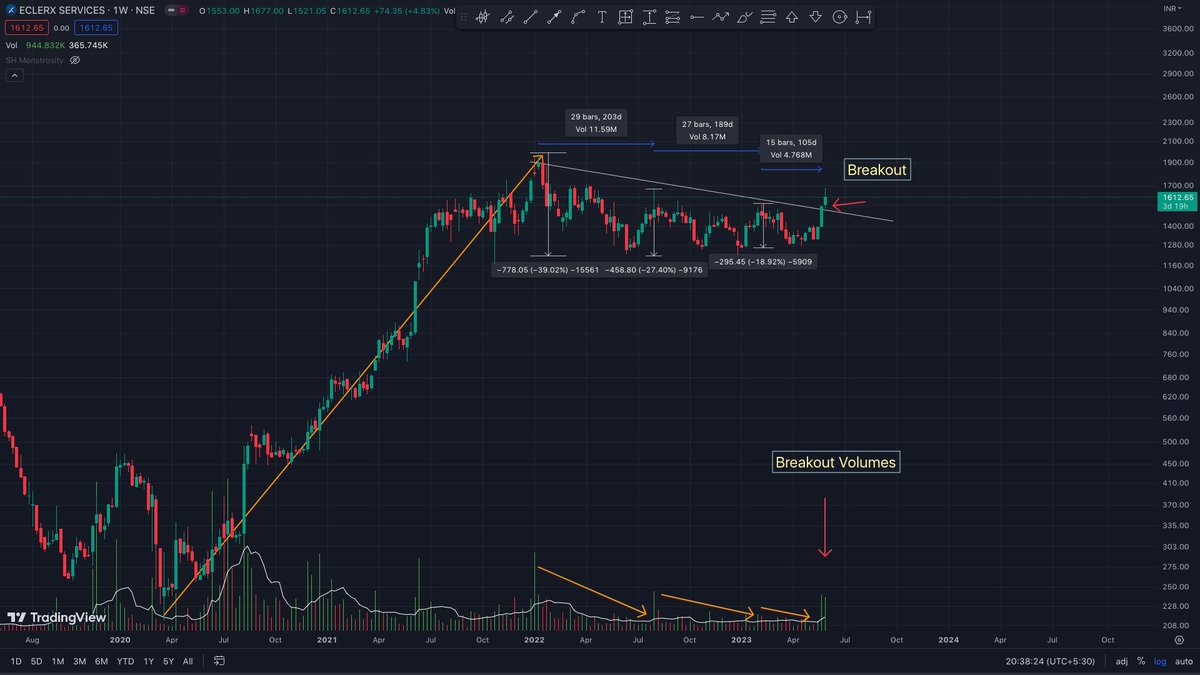
2. Contraction in Price volatility in each Ts:
3. Contraction in Time taken for each Ts:
4. Volumes dry up from the pivot high to the pivot low.
5. Volumes dry up from the left to the right side on each subsequent correction:
Eg: ECLERX
5/n twitter.com/i/web/status/1…
3. Contraction in Time taken for each Ts:
4. Volumes dry up from the pivot high to the pivot low.
5. Volumes dry up from the left to the right side on each subsequent correction:
Eg: ECLERX
5/n twitter.com/i/web/status/1…
How many contractions can occur?
In theory, any number of Ts.
A rectangle has just 1 T.
a Cup & Handle has 2 Ts
Triangles have 3 or more
The Flag Mast can have anywhere from 2 to 5-6
But, what comes after the T?
6/n twitter.com/i/web/status/1…
In theory, any number of Ts.
A rectangle has just 1 T.
a Cup & Handle has 2 Ts
Triangles have 3 or more
The Flag Mast can have anywhere from 2 to 5-6
But, what comes after the T?
6/n twitter.com/i/web/status/1…
what comes after the contraction?
Price EXPANSION. YES
Mark positions himself to catch this explosion right at the beginning of the expansion.
A rule of thumb is that a good break out should come around 2/3rd of the length of the base (see example in Olectra below).
7/n twitter.com/i/web/status/1…
Price EXPANSION. YES
Mark positions himself to catch this explosion right at the beginning of the expansion.
A rule of thumb is that a good break out should come around 2/3rd of the length of the base (see example in Olectra below).
7/n twitter.com/i/web/status/1…
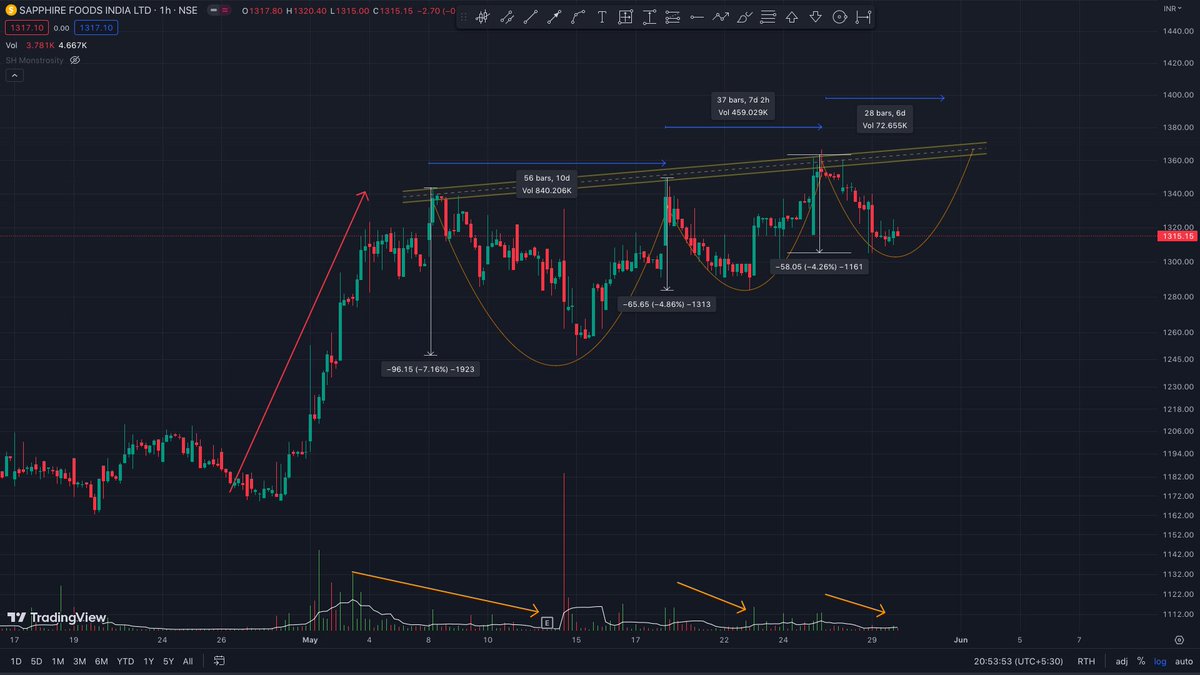
In which timeframe does VCP occur?
They are fractals.
Like everything in the markets (& life), VCPs also occur in all timeframes.
see examples of VCP in monthly & Intraday
8/n twitter.com/i/web/status/1…
They are fractals.
Like everything in the markets (& life), VCPs also occur in all timeframes.
see examples of VCP in monthly & Intraday
8/n twitter.com/i/web/status/1…
Can we scan for VCPs?
Yes.
Here is my best attempt.
This scanner scans for VCP in a larger timeframe. If you want to find VCPs in a smaller timeframe, you can do that by adjusting the timeframes.
9/n
chartink.com/screener/shvcp… twitter.com/i/web/status/1…
Yes.
Here is my best attempt.
This scanner scans for VCP in a larger timeframe. If you want to find VCPs in a smaller timeframe, you can do that by adjusting the timeframes.
9/n
chartink.com/screener/shvcp… twitter.com/i/web/status/1…
If you understood VCP:
1. Follow me @SakatasHomma for more of these
2. RT the tweet below to share this thread with your audience
I simplify Trading every week on THE TECHNICAL TAKE.
Please subscribe to it for free, Link in BIO.
10/10
End 🧵🧵🧵
1. Follow me @SakatasHomma for more of these
2. RT the tweet below to share this thread with your audience
https://twitter.com/SakatasHomma/status/1668977136361697280?s=20
I simplify Trading every week on THE TECHNICAL TAKE.
Please subscribe to it for free, Link in BIO.
10/10
End 🧵🧵🧵

Here is my thread of threads, if you want to read more
Less Go
https://twitter.com/SakatasHomma/status/1636039442850013184?s=20
Less Go
• • •
Missing some Tweet in this thread? You can try to
force a refresh