
ICT Silver Bullet ;
A time-based algorithmic trading model for all assets.
A Thread 🧵 https://t.co/0Ip4Yx39iwtwitter.com/i/web/status/1…

A time-based algorithmic trading model for all assets.
A Thread 🧵 https://t.co/0Ip4Yx39iwtwitter.com/i/web/status/1…

There 3 Silver Bullet Time window⏱️:
- The London Open : 3:00 AM → 4:00 AM✅
- The AM session : 10:00 AM → 11:00 AM ✅
- The PM Session : 2:00 PM → 3:00PM ✅
New York local time (EST) 📝
- The London Open : 3:00 AM → 4:00 AM✅
- The AM session : 10:00 AM → 11:00 AM ✅
- The PM Session : 2:00 PM → 3:00PM ✅
New York local time (EST) 📝

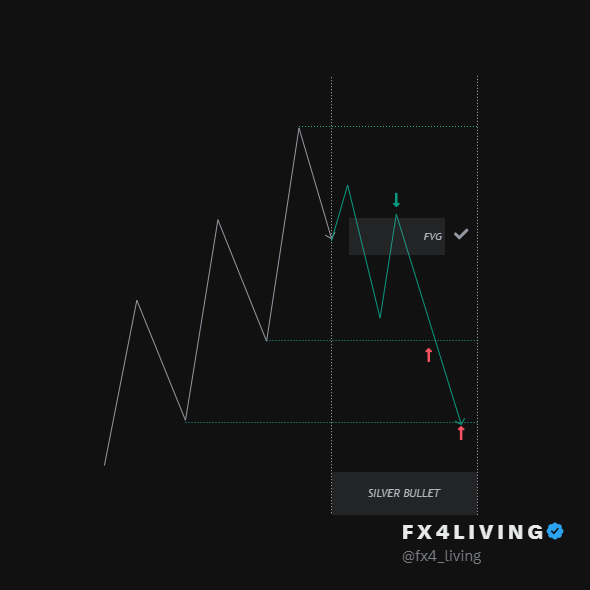
The ICT Silver Bullet time window refers to a specific 60-minute interval during which a particular trading pattern forms. This pattern is linked to a specific time frame and can be found every single trading day. 📝

During this time, traders should look for a fair value gap to form and anticipate the market's direction. Once the displacement occurs, traders can expect the fair value gap to be traded into and then repriced to a pool of liquidity opposing their entry. 📝
The Silver Bullet can be found on various timeframes, starting from a 5-minute chart down to a 15-second chart. 📝

It's not clear enough?
See the @I_Am_The_ICT Silver Bullet latest video on his Youtube channel :
https://t.co/OKSrihAUqw
See the @I_Am_The_ICT Silver Bullet latest video on his Youtube channel :
https://t.co/OKSrihAUqw

Are you using the Silver Bullet concept in your trading?
Follow @fx4_living, Like, Retweet, Bookmark 💾
• • •
Missing some Tweet in this thread? You can try to
force a refresh


