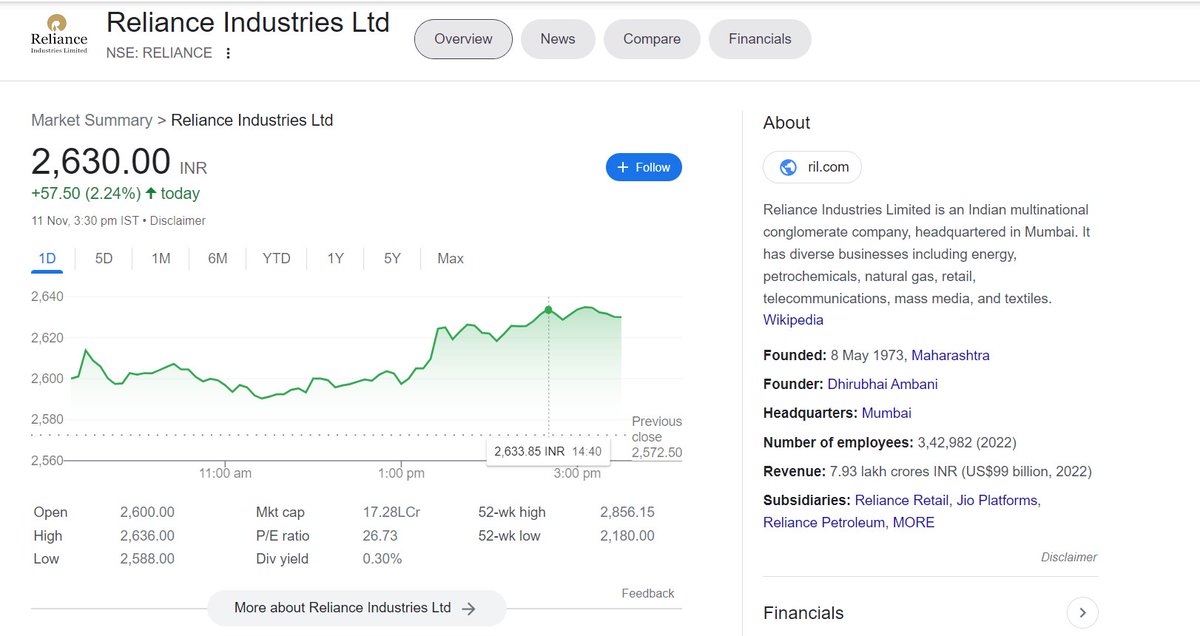
Screeners are best to identify right stocks for trading and investing in just fraction of seconds.
Top 7 Free Screeners can help you save a lot of time and efforts in analyzing stocks in fraction of seconds.
The last screener is my favorite to pick early momentum stocks.
Top 7 Free Screeners can help you save a lot of time and efforts in analyzing stocks in fraction of seconds.
The last screener is my favorite to pick early momentum stocks.
1/ Golden Crossover:
Golden Crossover of 20 EMA above 200 EMA is a good strategy used by the trader. This screener will help you in identifying stocks that has given golden crossover.
chartink.com/screener/golde…
Golden Crossover of 20 EMA above 200 EMA is a good strategy used by the trader. This screener will help you in identifying stocks that has given golden crossover.
chartink.com/screener/golde…
2/ All Time High Breakout Screener:
This screener will identify stocks that are breaking All time high (10 year high). It needs to be run daily to identify such stocks.
chartink.com/screener/all-t…
This screener will identify stocks that are breaking All time high (10 year high). It needs to be run daily to identify such stocks.
chartink.com/screener/all-t…
3/ CCI Momentum:
CCI is a good indicator to find out stocks that are bullish and are in momentum. I had already shared a thread on the same.
This screener will help in identifying stocks for which CCI has crossed above 100.
chartink.com/screener/cci-b…
CCI is a good indicator to find out stocks that are bullish and are in momentum. I had already shared a thread on the same.
This screener will help in identifying stocks for which CCI has crossed above 100.
chartink.com/screener/cci-b…
4/ NR4 Candle:
NR4 is the compression candle, where the range of the candles shrinks for four days. After breakout/breakdown, the stocks give good one-sided move. So such stocks can be added in the watchlist.
chartink.com/screener/nr4-e…
NR4 is the compression candle, where the range of the candles shrinks for four days. After breakout/breakdown, the stocks give good one-sided move. So such stocks can be added in the watchlist.
chartink.com/screener/nr4-e…
5/ NR7 Candle:
NR7 is the compression candle, where the range of the candles shrinks for seven days. After breakout/breakdown, the stocks give good one-sided move. So such stocks can be added in the watchlist.
chartink.com/screener/nr7-c…
NR7 is the compression candle, where the range of the candles shrinks for seven days. After breakout/breakdown, the stocks give good one-sided move. So such stocks can be added in the watchlist.
chartink.com/screener/nr7-c…
6/ Volume Buzzer:
This screener will filter out stocks in which volumes has spiked up on daily time frame.
Also, a detailed thread is shared by us on how to trade using Volume Buzzer.
chartink.com/screener/volum…
This screener will filter out stocks in which volumes has spiked up on daily time frame.
Also, a detailed thread is shared by us on how to trade using Volume Buzzer.
chartink.com/screener/volum…
7/ Volatility Contraction:
This is one of my favorite. Volatility Contraction pattern helps in picking up stocks just before the big move starts.
This screener will help in picking up stocks that are going to give big move.
chartink.com/screener/daily…
This is one of my favorite. Volatility Contraction pattern helps in picking up stocks just before the big move starts.
This screener will help in picking up stocks that are going to give big move.
chartink.com/screener/daily…
That's all about basic trading strategies and the screeners that one can use while doing analysis.
If you found this useful, please RT the first tweet.
Also, for live trading and stock market related updates, you can join our Telegram Channel ⤵️
telegram.me/finquity
If you found this useful, please RT the first tweet.
Also, for live trading and stock market related updates, you can join our Telegram Channel ⤵️
telegram.me/finquity
• • •
Missing some Tweet in this thread? You can try to
force a refresh

 Read on Twitter


