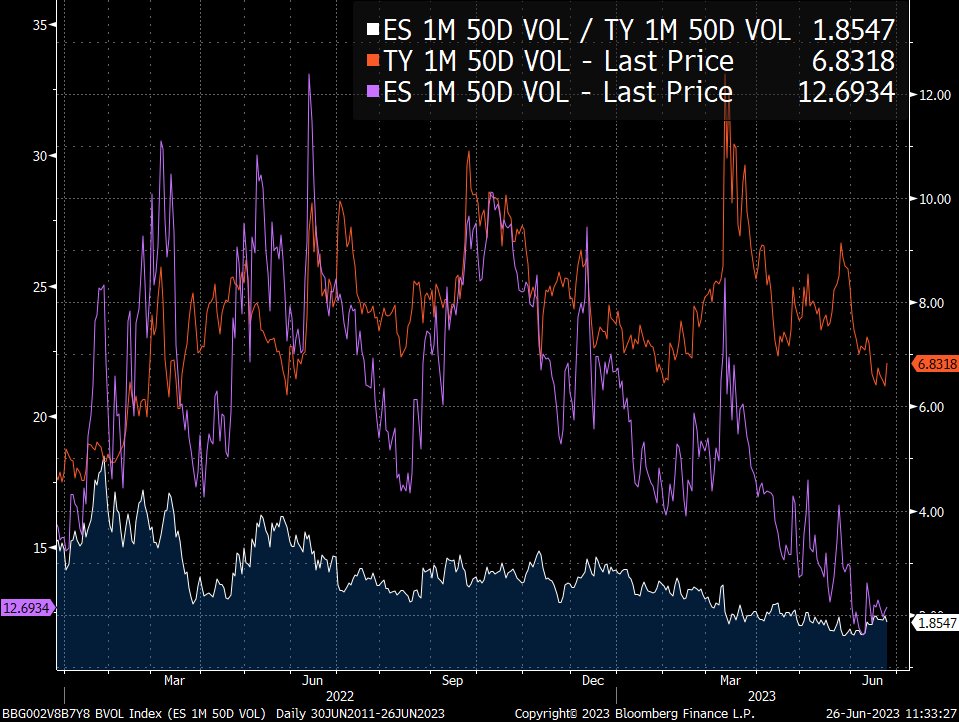
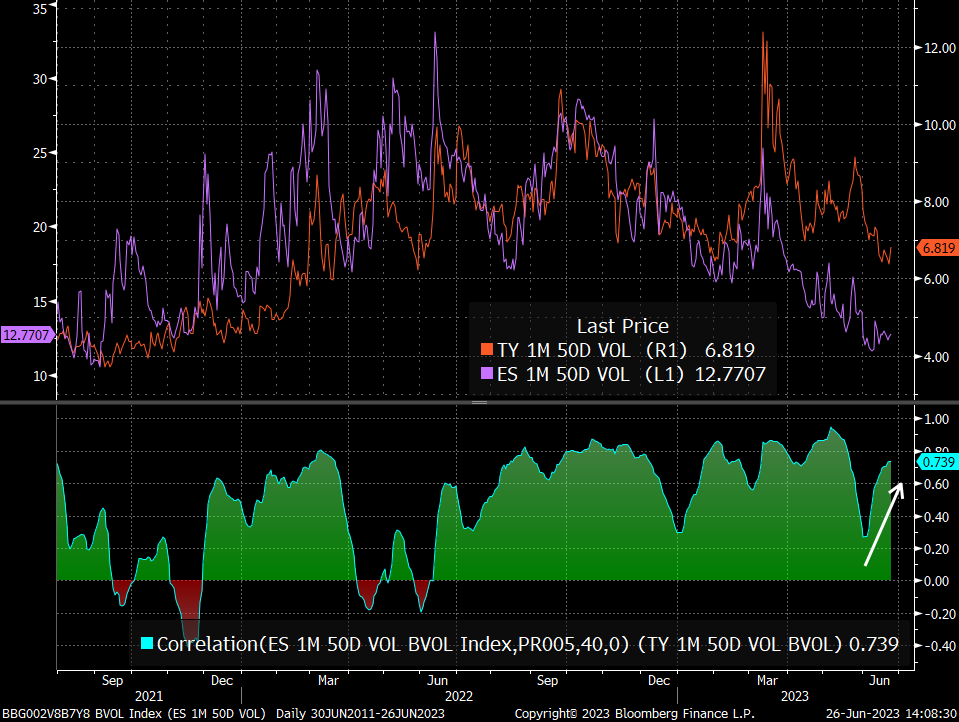
This is the ratio of 1 month ATM implied vol on ES vs TY. It recently went as low as 1.61, only seen for a blip in 2014. Other notable observed lows close to this level was 2013 and 2016 (the first clue).
Now if you're expecting bearporn - let me finish first before you do
/
The point of a ratio is that is involves TWO moving parts. Now with that in mind, let's try to deconstruct this ratio and find some sense in it. The obvious questions are

"why is it so low, what does it mean and what does it imply?"

So let's start with the first qn.
The ratio is low because equity IV has continued to decline while rate vol has not. Simple answer. Nothing more complicated needed.
What does it mean? Phrased another way, "WHY is it so low and WHY has equity IV declined while rate vol hasn't?"
Now this isn't quite as simple but we can draw some conclusions by just looking at a bit more of the chart. As mentioned, 2013 and 2016 both saw similar lows and...
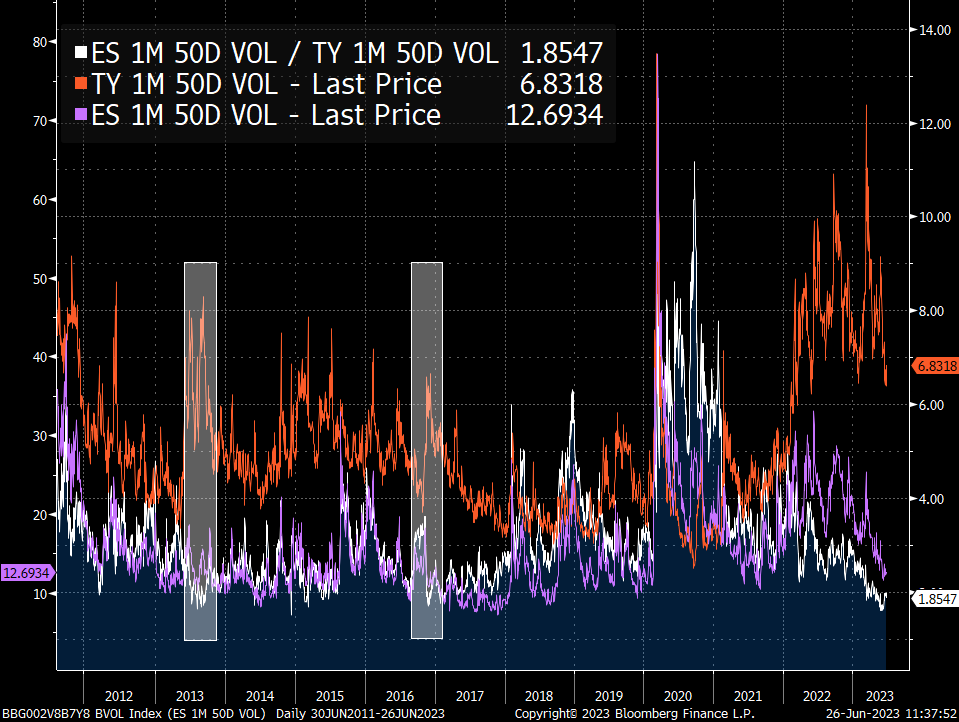
...well the decline in the ratio was driven primarily by rate vol increasing significantly. in 2013 it was the taper tantrum and in 2016 it was fiscal impulse implied from Trump winning the presidential election that drove yields higher and as a result, rate vol.
So, what has driven the ratio to its current low? First let's look at the ratio again. We can understand that it shot up during the pandemic because of the global shutdown that rocked markets. Through 2020 the ratio implied a hefty vol premium in stocks over bonds until Feb 2021.
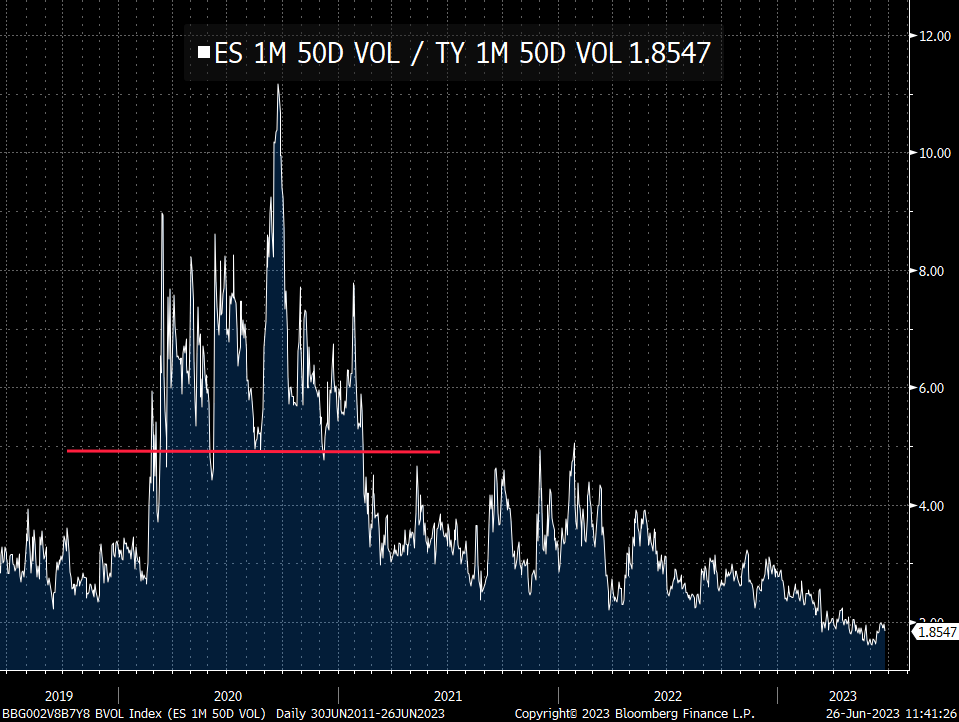
So what I'm concerned about is "what happened in Feb 2021 that caused the ratio to drop? Is this WHY the ratio embarked on a trip to current lows?
After all, that is the point at which the prior regime (the pandemic premium) ended.
Amid the stupidity of meme-stock mania in Jan/Feb 2021 (p.s. the new trailer for Dumb Money with Seth Rogen as Gabe Plotkin just dropped), a shot across the bow of the rates market flew loudly but just not as loud as gamma-induced shitcos ripping to the moon:
Rates became unloved
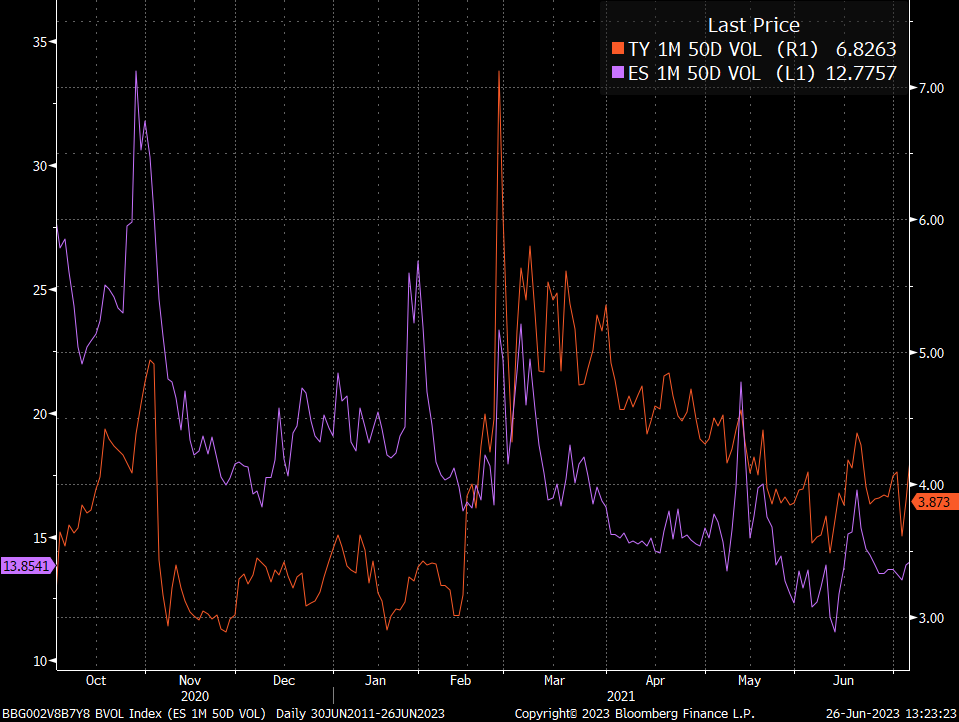
The put wing on TY (ZN) went from a 3vol handle on the 5 delta to 10% in 2 weeks. Inflation was becoming a concern and the market had *gasp* priced in as much as 1 rate hike by end 2022.
Funny how the clarity of the present elucidates the stupidity of the past.
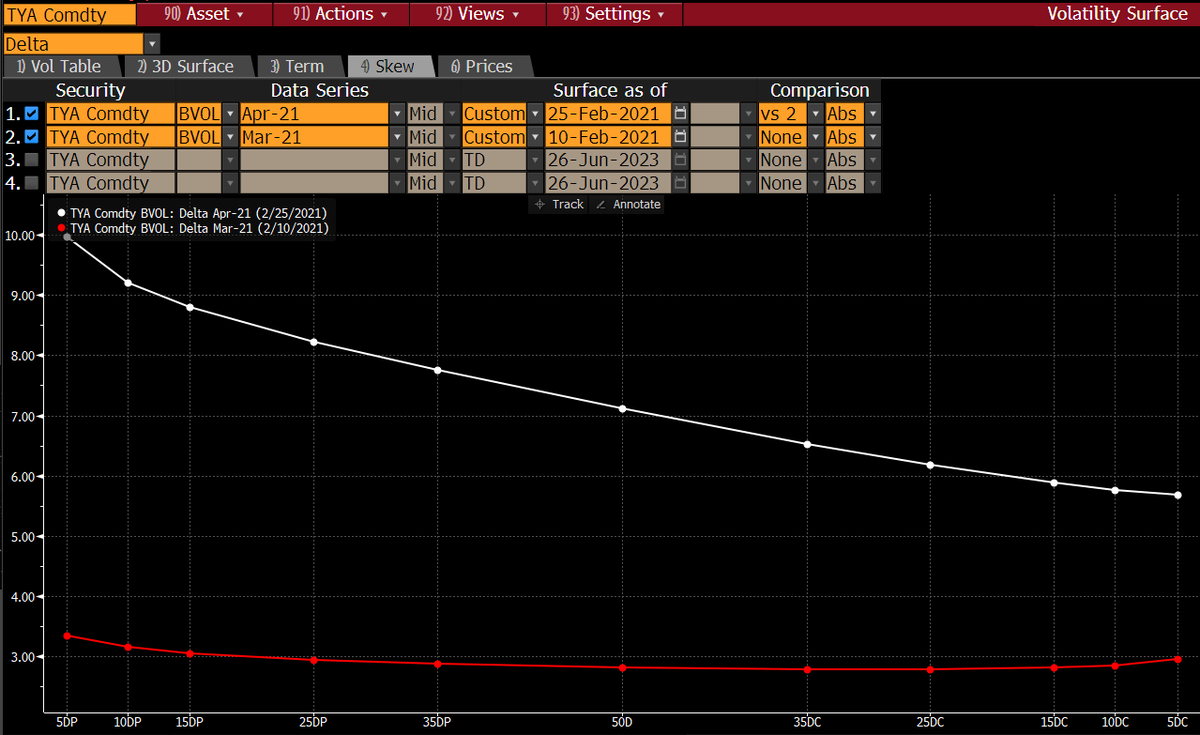
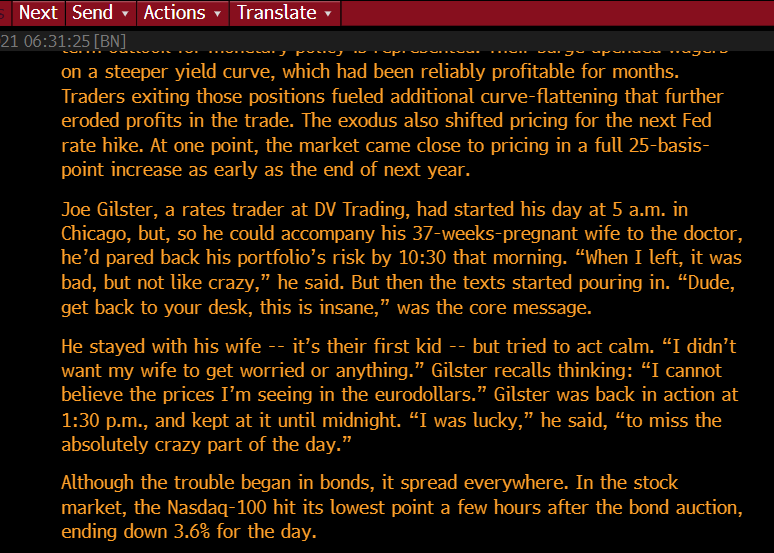
On the 25th of February, 2021 an otherwise normal Thursday the 10y Treasury lurched 14bps higher (23bps wider at one point); the highest single day amount since 2016's presidential election, outside of 3 days during the height of the pandemic.
That day they auctioned 7y as well.
It was a fucking disaster. The bid-to-cover (BC) fell to 2.04, the lowest in the 7-year's auction history. It was, essentially the harbinger of things to come.
I myself, up to that point had generally thought that pandemic recoveries ensured a long long runway of low rates. Yikes
It was so bad, one of the best rates traders around, @joegilster wasn't spared any peace of mind to care for his wife and expectant child. Here, he's chronicled in one of my favourite articles to date titled "'Dude, Get Back to Your Desk': The Week That Roiled Bond Markets"
While rate vol eventually calmed, the seed was planted in the market's mind - we could go higher and we will. It was just undetermined and underappreciated how much.
Narrator: it was a lot.
So the why of the ratio being so low currently is explained by rate volatility being very elevated due to a bearish paradigm that began in Feb 2021 juxtaposed with an equity market that was playing the SAME recovery outlook mind you.
To bring you back to this chart - look and appreciate that equity vol was HIGH in 2022 relative to the last decade and even while it is low, it is not abnormally so. It is rate vol that is the "anomaly" here.
Equity vol's anomaly is its reticence to follow rate vol, not its level
The last qn of 'what does it imply?' is as usual, the hardest one to answer. But if we know 1) the ratio is at lows and 2) 'cos rate vol is abnormally high, and 3) it's driven by a bearish regime then the "mean reversion" bias leans more to bearish rate vol than bullish eq vol
this seems congruent with either of 2 scenarios:
1) normalisation of inflation sees pressure across the curve subside (vol lowers as Fed bets pared back, etc) while eq remains stable
2) a significant growth decline sees bonds get bid, lowering bearish skewed vol and eq vol rises
the bearporn scenario is an extreme version of no.2 or a reflation scare that sends yields higher, rate vol higher and breaks the resolve of equity bulls now that PoV gains have been priced in and an en masse rush to dump stocks. Plausible but you need to see rate vol rip first.
Some risks I see are that we do see some signs of inflation coming back. I do not like that consumption remains robust while producer sentiment remains low and its implications on cost-push inflation from a supply constraint. Some central banks are still hawkish.
The onus is on data to confirm that rate vol should lower because enough has been done. Hard data is certainty. Vol is simply uncertainty.
That is why cross asset vol can come down with very little change in underlying levels - THAT'S HALF THE POINT!!!
So when looking at ratios such as these, yes they are very low. Yes it looks like equity vol is relatively cheap. But I believe the base case for normalisation happens under very economically constructive conditions rather than calamitous ones.

Unless....

β€’ β€’ β€’

Missing some Tweet in this thread? You can try to force a refresh
γ€€

Keep Current with π„πŸπŸπ’πœπ’πžπ§π­ 𝐌𝐚𝐫𝐀𝐞𝐭 π‡π²π©πž

π„πŸπŸπ’πœπ’πžπ§π­ 𝐌𝐚𝐫𝐀𝐞𝐭 π‡π²π©πž Profile picture

Stay in touch and get notified when new unrolls are available from this author!

Read all threads

This Thread may be Removed Anytime!

PDF

Twitter may remove this content at anytime! Save it as PDF for later use!

Try unrolling a thread yourself!

how to unroll video
  1. Follow @ThreadReaderApp to mention us!

  2. From a Twitter thread mention us with a keyword "unroll"
@threadreaderapp unroll

Practice here first or read more on our help page!

More from @EffMktHype

Aug 24, 2025
After listening to Powell's speech at JH, here are the key points that stood out to me and my takeaways:

1. He first made clear to categorize monpol as effective against cyclical changes but not structural. This is the probably the most important sentence of his speech. Image
2. The labour market is in a "curious balance" of showing signs of weakening while supply is lowering due to immigration dynamics and falling LFPR.
It's an indication the worry is centred around weakness in hiring being currently masked but could potentially accelerate suddenly Image
3. He defended FAIT but admitted it didn't matter when inflation soared post-COVID and revealed the Fed has shifted back to FIT first introduced in 2012.

The distinction between the two is that the FAIT calculus involves the past when setting policy while FIT does not Image
Read 11 tweets
May 23, 2025
Stepping outside of US rates this morning, to look at Japan quickly as at the end of the day, DM rates complexes are intertwined - they're all drunk friends on the same banana boat in one big ocean.

The big move in JGBs has also been on the long end, with 30s reaching their highest in over two decades. Similar to the US, a poor 20 year auction lit the match under clenched butts that made fears of a methane bomb redundant due to a massive duration shart instead.
Consider the following:Image
Cost to hedge USTs back to JPY are not prohibitive but they are still lower than investing domestically (note XCCY is quite shallow but negative) Image
Japanese investors have been active BUYERS of foreign debt (and stocks). Foreign flows into Japan have been muted on bonds, positive on stocks. Image
Read 16 tweets
May 22, 2025
Just taking stock of things given the heightened worries about treasuries right now. 🚨🚨🚨

Starting with my scatter, I hold the view that we're shifting back to the right side (yellow dots), meaning overheating eco should see the curve bear flatten and recessionary path sees curve bull steepen but with little joy from the long end.Image
It's also worth noting in the above scatter that current levels are similar to 2007 and sorta-2001. Both pre-recession/bear market timeframes, with the path travelled similar as well (up and to the right followed by u-turn down). Meaning to say, the current bond market has continued to trade in a recessionary mindset.
It's jarring then, that the narrative around 30s trading at 5% has been distinctively bearish rates when the former position I laid out sounds distinctively bullish rates due to growth slowdown.
Read 11 tweets
Jan 16, 2025
2025 Macro Outlook – So Good it Hurts

As much as this is an outlook of the year ahead it’s a review of past views. In November, fresh off the election I wrote the following thread and not much has changed but here’s the lowdown:
1. Equity price has moved faster than earnings but remains correlated
2. Mid-year risk unwind was mechanical but underpinned by growth scare
3. June CPI ignited consensus for cuts – but Fed went big and now looks like a mistake
4. TY skew is back to negative, forward cuts are getting priced out
5. Risk of curve bear flattening less durable. I favoured bear steepening, which was right
6. HY issuance has been shortened, relying on rate cuts to materialize
7. Dollar is rate dependent for now
8. Clearing of rate vol sets it up for an expansion that could upset fincon
9. Gold like rate vol, was a hedge whose use was over post-election but I thought could still come back
x.com/EffMktHype/sta…
Since then, I can happily report that much of it was on point
1. Equity valuations and spreads have marginally weakened
2. This was driven by tighter fincon as yields rose, the curve bear steepened and vol sustained/increased
3. Dollar has continued its march higher (which tends to be an SPX headwind)
4. Gold demand has sustained as inflation concerns gained tractionImage
So let’s look at the basic framework of
1.Why or why not do I want to own bonds
2.And depending on that, where do I want to put my money otherwise

To begin, let’s look economically. The U.S. 3Q24 GDP was 2.7% YoY and is expected to come in at 2.4% for the full year. On a quarterly basis, growth in the US has been accelerating through 2024 with 3.1% annualized in the 3rd quarter. Globally, it’s well above everyone else. In terms of inflation however, everyone is pretty in line.
What does this mean? Assuming the trend persists, with higher growth and similar inflation I would expect the U.S. sees an overall higher level of nominal interest rates relative to its peers.Image
Read 31 tweets
Nov 13, 2024
Haven't done a markets thread in a bit but it's good for me to journal this out so I can spot mental mistakes and gaps when I review this. Main question for me is, where are we now and can we keep going?

The main question is actually where did we come from to get here, as things don't feel as simple as I once thought.
/Image
There have been three major economic events in the last 6 months (I'm ignoring market events like August selloff) marked out on the chart:
1. The June CPI released in late July βšͺ️
2. The first Fed rate cut of the cycle (by 50bps) πŸ”΅
3. The U.S. presidential and general electionπŸ”΄Image
Using that main chart as our framework let's break it down into detail one by one.
SPX Forward P/E (12mths blended forward) have moved largely in line with price, generally implying that earnings expectations have lagged while price was the driving factor.
Contrast this to periods like 2009 where P/Es were rangebound while price trended higher, indicating that earnings expectations were growing in line with price appreciation. I.e. companies grew into their valuations as opposed to valuations growing with the market like now.
/Image
Image
Read 17 tweets
Sep 10, 2024
Hello and welcome to Backtest Tuesday!
Welcome to Backtest Tuesday! This will be an ongoing discourse for everyone to participate in random backtesting, realize market falsehoods and try out things that may or may not work, myself included! We will use the terminal backtesting function (augmented with custom studies) and through the week the thread is open to ANY idea within the parameters of the model.

To recap, last week we added some basic trend and breakout rules to the range-bound strategy and tweaked the exits. The equity curve looks nice, our objective function (profit factor) has been maximized while drawdowns have been lowered. Today we take the next step and move into testing with out of sample data to see how awesome this strat is!Image
drumroll please
Here is the "OOS" return from 2023 to present!
.
..
...
......fuck. Image
Read 18 tweets

Did Thread Reader help you today?

Support us! We are indie developers!


This site is made by just two indie developers on a laptop doing marketing, support and development! Read more about the story.

Become a Premium Member ($3/month or $30/year) and get exclusive features!

Become Premium

Don't want to be a Premium member but still want to support us?

Make a small donation by buying us coffee ($5) or help with server cost ($10)

Donate via Paypal

Or Donate anonymously using crypto!

Ethereum

0xfe58350B80634f60Fa6Dc149a72b4DFbc17D341E copy

Bitcoin

3ATGMxNzCUFzxpMCHL5sWSt4DVtS8UqXpi copy

Thank you for your support!

Follow Us!

:(