

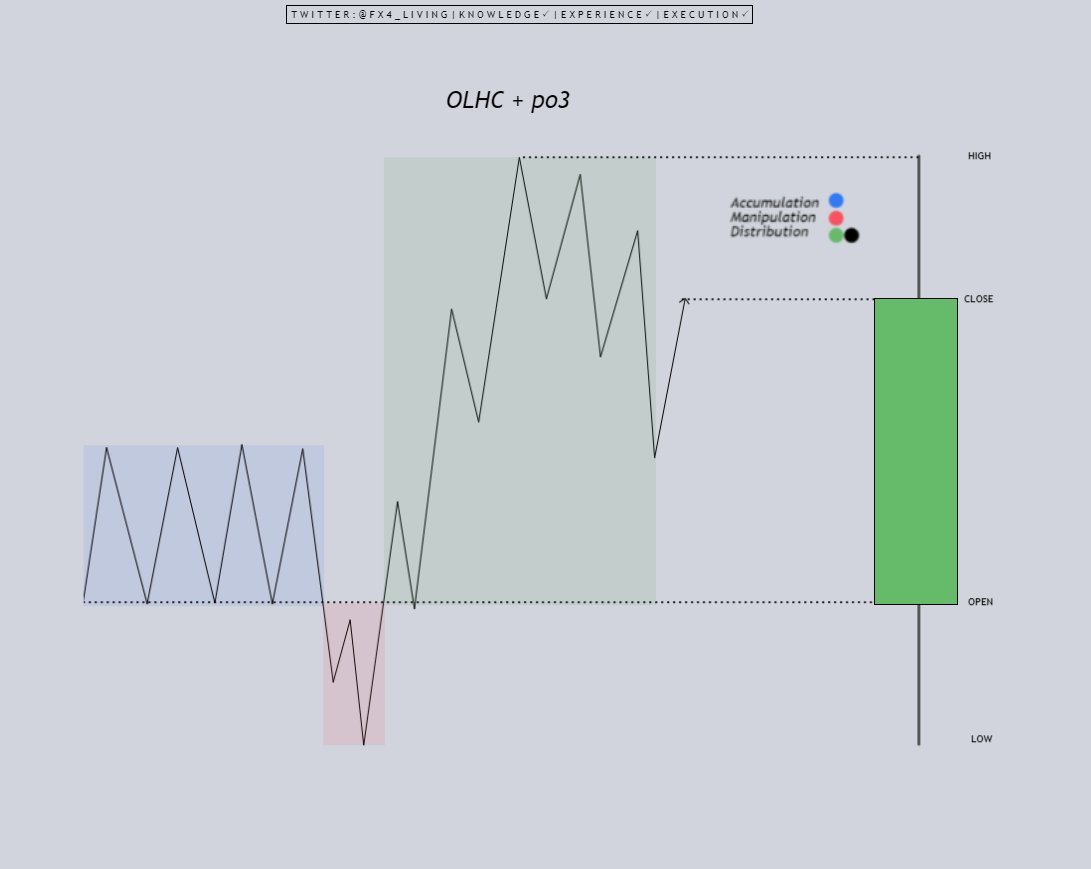
1) PO3 = AMD
→ Accumulation
→ Manipulation
→ Distribution
→ Accumulation
→ Manipulation
→ Distribution

2) OHLC = Open, High, Low, Close

3) OLHC = Open, Low, High, Close
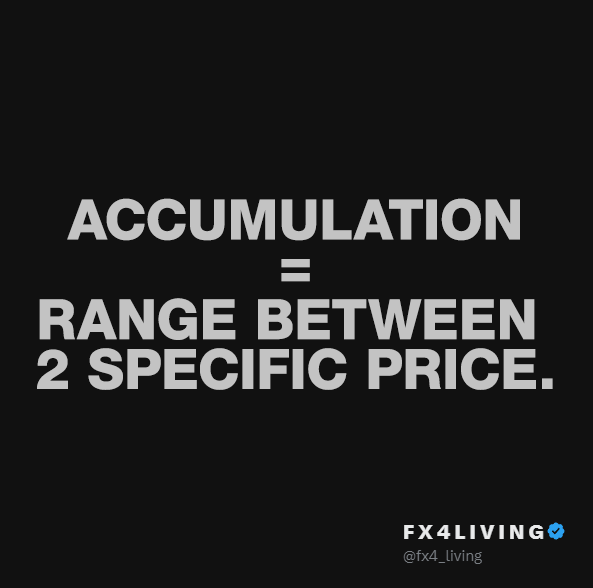
4) Accumulation :
5) Manipulation :

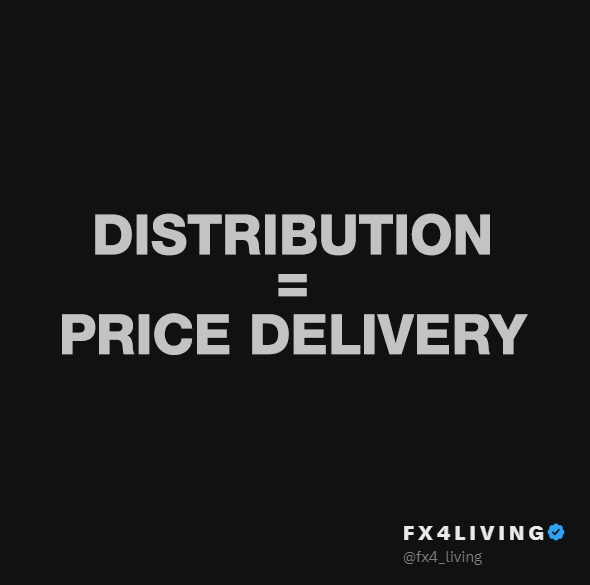
6) Distribution :
7) Manipulation Above the Opening Price.

8) Manipulation Below the Opening Price.
9) Follow @fx4_living, Like, Retweet, Bookmark 💾
10) ICT Episode about AMD
https://t.co/n9tFQm4ciw
https://t.co/n9tFQm4ciw

• • •
Missing some Tweet in this thread? You can try to
force a refresh


