boundsandbowesvoice Profile picture
Jul 6 17 tweets 7 min read Twitter logo Read on Twitter
The Interim report for Haringey Bounds Green LTN has been published – and whilst we’re used to the spin, this could be the most shocking example yet.
The overwhelming evidence shows the LTN is failing badly, and yet the report brazenly tries to pretend otherwise. 🧵(1)
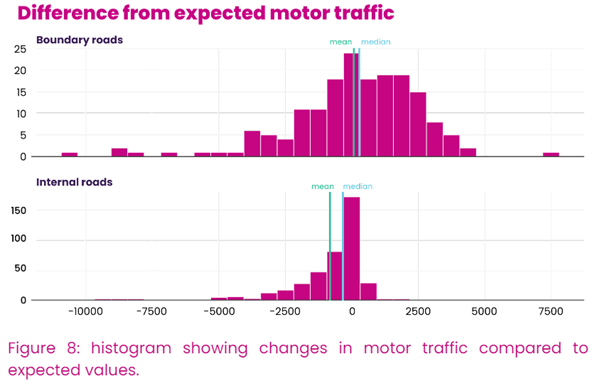
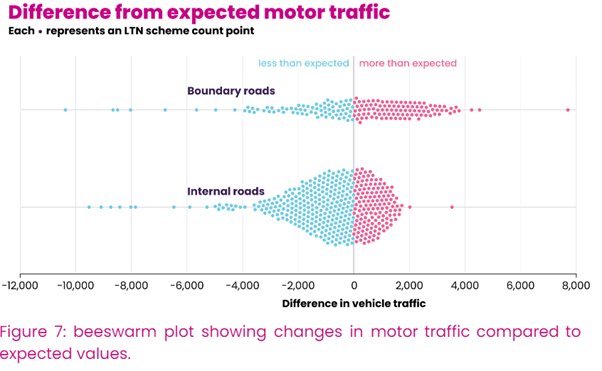
First of all boundary roads - the key point here, as always, is that these are already the most congested, polluted roads, with most schools, high occupancy dwellings, public transport access, most collisions and they're being made worse. (2)

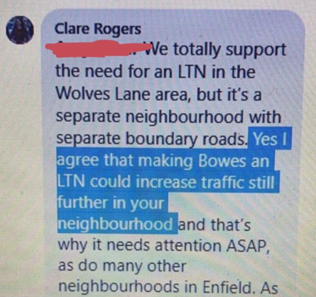
And it's vital to add that the baseline for these (Nov 21) was itself based on increased traffic on boundary roads caused by the Enfield Bowes LTN, so these increases on boundary roads are actually cumulative and the full impact of the LTNs should be added to those shown here:(3)
(Whilst we're focussing on Bowes + Bounds Green, as an aside it's worth mentioning the same applies on Boundary Rds in H/gey's other two LTNs which show some huge increases - further strengthening the case that this is a massive issue in many LTNs.) (4)


Moving on to one of the key justifications for introducing LTNs - to encourage active travel.
The data shows cylcing in and around the LTN is DOWN ... by 22% overall. (5)

What does the report say about this? It rules out wider baseline factors (e.g. weather) but fails to consider that the LTN is causing the decline, even though, as we'll show later, 3x more residents say the LTN discourages cycling v encourages it - see 11 (6)
What about road safety? As we've already pointed out, any plan to tackle road safety should start on main roads as that's where nearly all accidents are.
Nevertheless, LTNs are supposed to reduce speeding - yet in Bounds Green it's INCREASED on boundary AND internal roads: (7)

Further damning evidence that Bounds Green LTN is not working comes from the levels of support - look at the before and after - from 56% to 75% opposed, with lower support and almost all neutrals now negative. (8)

It's also worth noting solid opposition amongst the young (16-24) and those most likely to work and shop in Haringey, and the most likely to support = over 70s and those not working or shopping Haringey. (9)
Negatives outweigh positives in every possible area - but look at just how bad things seem to be on the boundary roads: (10)

Look at negatives compared to positives in every aspect. (11)

And 100% of Business reported negative impact. (12)
Overall, the main areas of objection are all supported by the evidence in the report and the appendices
(NB 1600 pages worth - presumably the hope being that this will deter scrutiny). (13)
Perhaps most shocking of all: there is not a single meaningful consideration of possible disproportionate or discriminatory impact. Nothing at all in the EqIAs, no attempt to use census data to analyse actual LTN impact, yet the issue is well proven. (14)
enfielddispatch.co.uk/ethnic-dispari…
So here we are again - further clearcut evidence of counter productive, negative impact. All ignored with the clear intention of blundering on regardless. Either the aims are not really what they claim them to be, or it's blinkered incompetence on a steggering scale. (15)

• • •

Missing some Tweet in this thread? You can try to force a refresh
 

Keep Current with boundsandbowesvoice

boundsandbowesvoice Profile picture

Stay in touch and get notified when new unrolls are available from this author!

Read all threads

This Thread may be Removed Anytime!

PDF

Twitter may remove this content at anytime! Save it as PDF for later use!

Try unrolling a thread yourself!

how to unroll video
  1. Follow @ThreadReaderApp to mention us!

  2. From a Twitter thread mention us with a keyword "unroll"
@threadreaderapp unroll

Practice here first or read more on our help page!

More from @BBvoice4all

Apr 18
A further issue re: @BBCPanorama - the use of WF survey data to claim LTNs work and gain support of time is a favourite of advocates, but it's doesn't stand up to basic fact checking.
The claim is as in the video and it's based on the report here: (1)
enjoywalthamforest.co.uk/wp-content/upl…
As Cllr Loake knows the mini-Holland scheme involved far more measures than LTNs do, so it's a false comparison, as residents were being asked about a range of measures.
Worse, it's a false representation of responses - note the wording of the q below (boxed in red). (2) Image
So the majority claimed as supporting no change, actually represent those who didn't have anything to add to their previous answers.
Those revealed 17% saw no benefits from any elements of the scheme, and 49% saw the modal filters (i.e. the LTN element) as least effective. (3) Image
Read 6 tweets
Apr 17
The description below is a fairly accurate portrayal of @BBCPanorma tonight & highlights its inexcusable lack of balance.
@BBCJustinR - Why no mention of the social justice concerns?
There are many associated with @SocEnvJustice who would have been eager to make the case. (1) Image
The programme starts with the familiar mischaracterisation of opposition as prioritising driving freedom over tackling congestion & pollution and then gives a disproportionate amount of air time to voices from the right that do not represent the true nature of much opposition.(2)
This, along with @zoesqwilliams piece today in @guardian, is stronglt suggestive of the depressing effectiveness of LTN supporters' efforts to mischaracterise opposition and opponents, and narrow the debate in order to brush the social justice issues under the carpet. (3)
Read 8 tweets
Jan 19
A thread on the latest research into LTNs – widely promoted but narrowly interpreted by LTN advocates – here’s an alternative take on what it shows.
Let’s start the data itself rather than the averages.
The following all appear in the research – what can they tell us? ImageImageImageImage
A lot of roads see increased traffic post LTNs, especially boundaries, but a fair number of internals too. By relying on overall averages across all of the LTNs covered, this is easily missed. At the very least it suggests that lots of LTNs may not be working: Image
This shows how many roads in each category have seen different levels of increases.
Many boundary roads have seen large increases in traffic since the LTNs were introduced – which is exactly what those raising concerns have been arguing since they were introduced. Image
Read 17 tweets
Aug 3, 2022
We too have respect for @GeorgeMonbiot & share Rosamund's disappointment with his piece today. The presentation of questionable evidence as indisputable fact is highly concerning and we'd urge further consideration of the following specific examples: (1/7)
Firstly, @LittleNinjaUK 's point relating to 'Equity' (see linked thread) is especially important. As the graph suggests, the "2.7 more likely" figure used in today's article should not be allowed to mask or deny the genuine basis for serious concern.(2/7)
The suggestion that Govt figures show the majority of schemes reduce traffic everywhere references this report - assets.publishing.service.gov.uk/government/upl…
The only information provided is pictured so just 12 schemes, it doesn't say which ones, or provide any of the data (or dates). (3/7)
Read 7 tweets
Mar 6, 2022
Grenoble Gardens and Bowes LTN – A thread
Discussion of the negative impact of Bowes LTN focuses significantly on the plight of Grenoble Gardens – there’s a huge amount of conjecture, alongside plenty of deliberate misinformation – it’s time to put the record straight.
2. No-one denies problems on Grenoble Gdns predate the LTN. Evidence of their history is frequently posted, typically with the intention of evading the key question: has Bowes LTN has made them worse? It's a question that many campaigners and politicians remain keen to avoid.
3. The truth is that those promoting Bowes LTN were fully aware that this was a likely outcome before the LTN was introduced – there's plenty of evidence for this on social media. This post was written by a key BSfE and leading LCC activist, well before the LTN was introduced.
Read 18 tweets
Nov 12, 2020

It took less than 5 minutes for the erroneous “35% of car journeys in London are under 2km” stat to surface. It’s a mistake (or a deliberate distortion) of data in this document – the true figure is just over one-fifth. (1/13)
content.tfl.gov.uk/technical-note…
That data should be used alongside this, which confirms that a significant proportion of short journeys cannot be realistically travelled by other means. So really we’re talking about something in the region of one in ten that could “mode shift.”. (2/13)
content.tfl.gov.uk/technical-note…
This figure is in line with claims for possible traffic evaporation. Constant referrals to far higher figures are seriously misleading; whether deliberate or remiss it raises serious questions about the credibility of those responsible. (3/13)
Read 13 tweets

Did Thread Reader help you today?

Support us! We are indie developers!


This site is made by just two indie developers on a laptop doing marketing, support and development! Read more about the story.

Become a Premium Member ($3/month or $30/year) and get exclusive features!

Become Premium

Don't want to be a Premium member but still want to support us?

Make a small donation by buying us coffee ($5) or help with server cost ($10)

Donate via Paypal

Or Donate anonymously using crypto!

Ethereum

0xfe58350B80634f60Fa6Dc149a72b4DFbc17D341E copy

Bitcoin

3ATGMxNzCUFzxpMCHL5sWSt4DVtS8UqXpi copy

Thank you for your support!

Follow Us on Twitter!

:(