FX4LIVING🎱 Profile picture
Jul 9, 2023 7 tweets 2 min read Read on X
Supercharge⚡ Your Learning:
Using Your Mentor's Chart Colors.

Using my mentor as example : @I_Am_The_ICT

A Thread 🧵
1. Muscle memory is a phenomenon where repetitive actions or movements become ingrained in your muscle fibers 🧠 and are performed automatically without conscious effort.
Through consistent charting practices, with the same as the one we learn from, can help a lot. 🔁
2. By using the same chart colors as your mentor's, you establish a mental mapping between their teachings and the visual representations. This mapping facilitates the transfer of knowledge and helps you recall important concepts more effectively. 🗺️
3. Consistency in chart colors speeds up the learning process. By minimizing cognitive load associated with deciphering new color schemes, you can focus more on the content and insights being conveyed, allowing for a smoother and more efficient learning experience. 🧠👁️
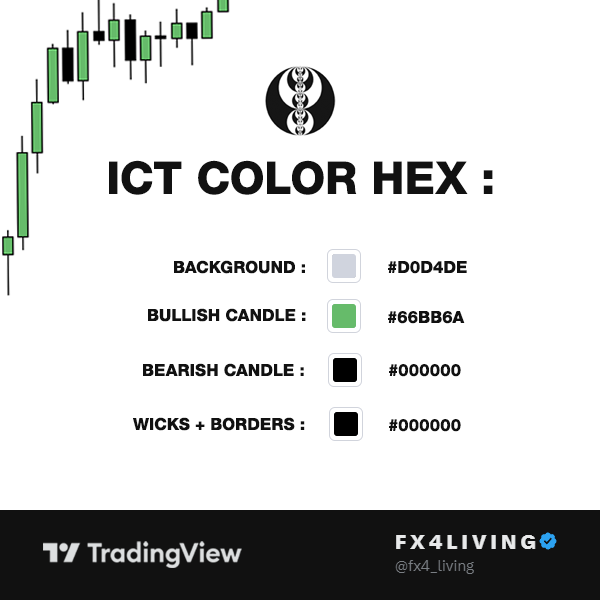
4. Here the last updated ICT Color HEX code for @tradingview ✅

Adopting your mentor's chart colors enhances visual consistency, aids mental mapping, reduces confusion, and accelerates learning. 📈
5. If you appreciate this thread, follow @fx4_living, like, retweet, bookmark 🤍
Are you using your mentor chart colors?

• • •

Missing some Tweet in this thread? You can try to force a refresh
 

Keep Current with FX4LIVING🎱

FX4LIVING🎱 Profile picture

Stay in touch and get notified when new unrolls are available from this author!

Read all threads

This Thread may be Removed Anytime!

PDF

Twitter may remove this content at anytime! Save it as PDF for later use!

Try unrolling a thread yourself!

how to unroll video
  1. Follow @ThreadReaderApp to mention us!

  2. From a Twitter thread mention us with a keyword "unroll"
@threadreaderapp unroll

Practice here first or read more on our help page!

More from @fx4_living

Jan 27
Market Structure Shift (MSS) vs. Change in the State of Delivery (CSOD):

Let me explain you:
🧵Image
Change in the State of Delivery (CSOD):Image
Market Structure Shift (MSS):Image
Read 5 tweets
Dec 7, 2024
🧵[STATIC Data] Combined w/ [STATISTICAL Data]

Turbocharge your FX4 Model framework with the Statistical Statmap by @_joshuuu to pinpoint precise levels for high-quality setups.🧐

We use fractal static levels from the previous day and today's accumulation range to identify premium and discount zones, enhanced by Statmap's datamined data for a stronger edge.

This combination ensures a strategic approach to identifying optimal setups.🤯

Test it yourself 🙏don’t just take my word for it.

Links to both tools are below: 👇Image
Example #1: including the link to get access the FX4 Model: fx4model.comImage
Example #2: including the link to get access the Statmap by @_joshuuu also for extra 20% off
use my promo code: fx4living

stat-map.comImage
Read 4 tweets
Mar 23, 2024
My FX4 oH/Lc Indicator boosted with steroids💥 ;

HTF Po3 [Pro+] by @toodegrees
(Show Higher Timeframe Candle on the right side)

OHLC Statistical Mapping [Pro+] by @_joshuuu
(Show the Average Time x Price of the previous candle of your choice) "Market Cycle Stats"

Take a 5min and watch that.

Here the story 🧵💫 :Image
The OHLC Statistical mapping [Pro+] show you the opening Price, my OH/LC tool show you the previous 30 min candles within the 30 seconds timeframe. (orange🟠 line) Image
Previous M5/M15/M30 right there indicated by the FX4 OH/LC indicator (Red Line) -> that's your short term draw on liquidity.
Image
Image
Read 12 tweets
Mar 16, 2024
Building a Daily Profile, using the 4H OHLC :

[Future & Forex]

A Thread🧵Building a Daily Profile, using the 4H OHLC :
Nasdaq Future $NQ ETH (Electronic Hours)
- [6] 4H OHLC
-🔵 Accumulation [2] 4h
-🔴Manipulation [2] Accumulation 2x 4h
-🟢 Distribution [2] 4hImage
Forex $EU
- [6x] 4H OHLC
-🔵 Accumulation [2x] 4h
-🔴Manipulation [2x] Accumulation 2x 4h
-🟢 Distribution [2x] 4h Image
Read 6 tweets
Feb 11, 2024
"30 Second Model" by ICT Son's Cameron

A Thread. 🧵

Like, Repost, Follow @fx4_living🫡30 Second Model by ICT Son (Cameron Model) 5 Min/30 seconds, 15 min DOL
After the Buy/Sell Stop Raid🛑, if you want to see an FVG ⚡️, must have a Draw on Liquidity 🎯 in the opposite direction of at least 12-15 Handles or 12-15 pips for Forex. Drawing by Inner Circle Trader from the 30 Second Model
5 Minutes Chart, a 15-minute Draw on Liquidity,
can be the Previous 15/30 minutes High and Low.
(Enough Liquidity for Scalping) Image
Read 9 tweets
Jan 17, 2024
60 Minutes Classic ICT Trading Model

A Thread🧵(Part#1 to #5 in comments) ⬇️

Like, Retweet, Follow @fx4_living🫡A Classic Model that can be applied in both directions, Buy and Sell
You want to see a 3-hour range closing with that specific order.

(Part #1) see the next comment for (part #2) ⬇️ Image
You ideally want to see a Fair Value Gap between those 3 hours (the 60 min candle in the middle)

(Part #2) see the next comment for (part #3) ⬇️ Image
Read 10 tweets

Did Thread Reader help you today?

Support us! We are indie developers!


This site is made by just two indie developers on a laptop doing marketing, support and development! Read more about the story.

Become a Premium Member ($3/month or $30/year) and get exclusive features!

Become Premium

Don't want to be a Premium member but still want to support us?

Make a small donation by buying us coffee ($5) or help with server cost ($10)

Donate via Paypal

Or Donate anonymously using crypto!

Ethereum

0xfe58350B80634f60Fa6Dc149a72b4DFbc17D341E copy

Bitcoin

3ATGMxNzCUFzxpMCHL5sWSt4DVtS8UqXpi copy

Thank you for your support!

Follow Us!

:(