Trading in Options can give you consistent income, but if traded without Proper Strategies, then it can make your Capital ZERO in Minutes.
Sharing SIMPLE Index Intraday & Positional Option Selling Strategies and less effort is required.
The last strategy is my favourite.
Sharing SIMPLE Index Intraday & Positional Option Selling Strategies and less effort is required.
The last strategy is my favourite.
1/ Short Straddle or Iron Condor for Expiry (Famous 916 Strategy):
Just create a Short Straddle/Iron Condor 100 points away in Nifty on expiry day.
For eg. if Nifty Spot is at 17610, then short 17700 CE and 17500 PE.
Iron Condor can be taken by buying 300 points away hedge.
Just create a Short Straddle/Iron Condor 100 points away in Nifty on expiry day.
For eg. if Nifty Spot is at 17610, then short 17700 CE and 17500 PE.
Iron Condor can be taken by buying 300 points away hedge.
Exit Strategy:
1. Exit all the Position if any of the options become ATM or near to that. For this, an alert at upper and lower levels can be placed.
2. If the above condition is not executed, then close the position manually by 3:15 PM.
1. Exit all the Position if any of the options become ATM or near to that. For this, an alert at upper and lower levels can be placed.
2. If the above condition is not executed, then close the position manually by 3:15 PM.
For example: In one of the Feb Expiry, we have taken below Short Straddle Trade and same was shared live.
Stoploss was kept as 17450/17750 after considering the premium that we collected from shorting.
Stoploss was kept as 17450/17750 after considering the premium that we collected from shorting.
https://twitter.com/YMehta_/status/1621022270901870594
For Banknifty, short straddle can be created for 250/300 points away and for Finnifty 100 points away.
Trading these two indices is bit difficult as they are very volatile and can give wild swings during intraday and especially on expiry days.
Trading these two indices is bit difficult as they are very volatile and can give wild swings during intraday and especially on expiry days.
2/ Non Expiry Days Intraday Trading:
Here again Short Straddle or Iron Condor can be created at 9:16 AM but with some variation.
We will take short straddle at 50 points away. For eg. if Nifty is trading at 17610 then 17650 CE and 17550 PE will be shorted.
Here again Short Straddle or Iron Condor can be created at 9:16 AM but with some variation.
We will take short straddle at 50 points away. For eg. if Nifty is trading at 17610 then 17650 CE and 17550 PE will be shorted.
Hedges can be taken to make above position intraday.
Stoplosse:
Exit any leg if premium of any options position goes up by 50%. Other leg to keep as it is with same stoploss rule.
If any position is open at 3:15 PM, then manually exit it during the closing.
Stoplosse:
Exit any leg if premium of any options position goes up by 50%. Other leg to keep as it is with same stoploss rule.
If any position is open at 3:15 PM, then manually exit it during the closing.
3/ Using CPR:
It is the powerful indicator that is used widely by the traders. Also, it is freely available in Tradingview and in many broker's chart also.
It has various application and also it gives good reversal trade in Index options.
It is the powerful indicator that is used widely by the traders. Also, it is freely available in Tradingview and in many broker's chart also.
It has various application and also it gives good reversal trade in Index options.
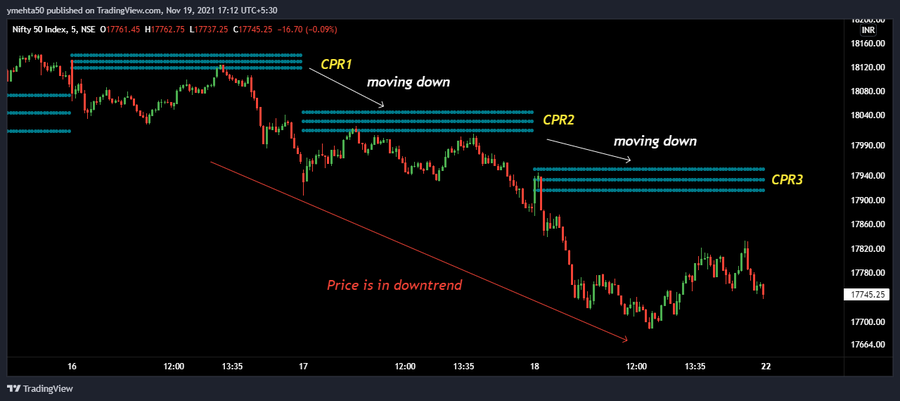
⚡️ Using CPR for identifying trend:
If CPR is moving up for the next day, then the trend is up. If CPR is moving down for the next day, then the trend is down.
Some examples for both:
In the below chart of Nifty (5 mins), CPR is moving down and price is also in downtrend.
If CPR is moving up for the next day, then the trend is up. If CPR is moving down for the next day, then the trend is down.
Some examples for both:
In the below chart of Nifty (5 mins), CPR is moving down and price is also in downtrend.
CPR was moving up on subsequent days. Price was also in uptrend during that time.
One can use higher time frame charts as well to find out long term or short-term trend.
One can use higher time frame charts as well to find out long term or short-term trend.

⚡️ Using CPR to expect the type of day:
If CPR is narrow, then it is expected that there would be a good one-sided trend. If CPR is broad, then it is expected that there would be a consolidation or sideway move.
If CPR is narrow, then it is expected that there would be a good one-sided trend. If CPR is broad, then it is expected that there would be a consolidation or sideway move.
Let's see both the examples now.
Wide CPR was formed and price was in consolidation for intraday. This was a good day to eat premium in options because of theta decay.
When narrow CPR was formed, then one-sided move was seen.
Wide CPR was formed and price was in consolidation for intraday. This was a good day to eat premium in options because of theta decay.
When narrow CPR was formed, then one-sided move was seen.


How much narrow or broad is quite subjective. One can use their own judgement in that case. Also, it's not necessary that price will follow this rule always. This was just an observation.
⚡️ Intraday Sell Setup based on CPR:
You have to add CPR Indicator on Spot Chart of Nifty. Time frame should be 5 mins.
You have to add CPR Indicator on Spot Chart of Nifty. Time frame should be 5 mins.
Bullish Strategy:
1. If Nifty has opened a gap up and above CPR, then wait for it to retrace towards the CPR region.
2. Once, it forms any reversal candle like hammer/doji or strong bullish candle, then Near ATM Puts can be shorted.
3. Stoploss will be a 5 mins close below CPR.
1. If Nifty has opened a gap up and above CPR, then wait for it to retrace towards the CPR region.
2. Once, it forms any reversal candle like hammer/doji or strong bullish candle, then Near ATM Puts can be shorted.
3. Stoploss will be a 5 mins close below CPR.
Let's see an example of Bullish Strategy.
As seen from Nifty chart, CPR was tested after gap up opening, and we have seen upmove in Nifty after that.
A simple Put Short would have given decent profit in this case.
Also, OTM Puts can be bought for hedging.
As seen from Nifty chart, CPR was tested after gap up opening, and we have seen upmove in Nifty after that.
A simple Put Short would have given decent profit in this case.
Also, OTM Puts can be bought for hedging.

Bearish Strategy:
1. If Nifty has opened a gap down and below CPR, then wait for it to retrace towards the CPR.
2. Once, it forms any reversal candle like or strong bearish candle, then Near ATM Calls can be shorted.
3. Stoploss will be a 5 mins close above CPR.
1. If Nifty has opened a gap down and below CPR, then wait for it to retrace towards the CPR.
2. Once, it forms any reversal candle like or strong bearish candle, then Near ATM Calls can be shorted.
3. Stoploss will be a 5 mins close above CPR.
Let's see an example of Bearish Strategy.
As seen from Nifty chart, CPR was tested after gap down opening, and we have seen downmove in Nifty after that.
A simple Call Short would have given decent profit in this case.
Also, OTM Calls can be bought for hedging.
As seen from Nifty chart, CPR was tested after gap down opening, and we have seen downmove in Nifty after that.
A simple Call Short would have given decent profit in this case.
Also, OTM Calls can be bought for hedging.

How to Trail Stoploss in both this strategy:
1. VWAP can be used for trailing in Index Futures or Option Charts.
2. Simple Price Action: If higher highs is getting formed, then can be exited.
Risk:Reward here will be highly favourable as it is a reversal setup.
1. VWAP can be used for trailing in Index Futures or Option Charts.
2. Simple Price Action: If higher highs is getting formed, then can be exited.
Risk:Reward here will be highly favourable as it is a reversal setup.
These are the major strategy but its only 50% of the actual trading. The remaining 50% is Risk and Money Management.
Follow this simple rules here:
1. Close position at any cost if Stoploss is hit, as first loss booked will always be less.
Follow this simple rules here:
1. Close position at any cost if Stoploss is hit, as first loss booked will always be less.
2. Take max risk of 3% on total capital for any position: For this you will require a Payoff charts for the position that you can create for free easily.
3. Don't average losing trades and sit on hopes for recovery.
3. Don't average losing trades and sit on hopes for recovery.
Also, note all these strategies are simple and effective to use, but these are not holy grail strategies. If you are confident, then only use it.
Stoplosses will hit, but it is part of the trading. So accept it and move on to the next opportunity.
Stoplosses will hit, but it is part of the trading. So accept it and move on to the next opportunity.
These are some of the Intraday Strategies that I use in Index Trading.
If you found this useful, please RT the first tweet.
For live trading and stock market related updates, you can join our Telegram Channel⤵️
telegram.me/finquity
If you found this useful, please RT the first tweet.
For live trading and stock market related updates, you can join our Telegram Channel⤵️
telegram.me/finquity
• • •
Missing some Tweet in this thread? You can try to
force a refresh