For the last few years, “climate activists are setting the wildfires” (to fake climate risks?!) was the dominant denial talking point; but now it’s gone even further…claims that the fires were set to clear areas for wind farms, critical mineral extraction, and more. (contd)
As @JustinWorland discusses here, there’s a psychological effect: the more obvious and dangerous, the impacts become, the stronger and more forceful the pushback to deny the urgency of action. (contd) time.com/6298586/extrem…
@JustinWorland Why? Because climate denial was never about a lack of scientific facts or unawareness of the risks of inaction. It was always about solution aversion. Watch:
So what can we do about it? For the 10% or so who are truly dismissive, only this.
But for the vast majority of people, most of whom are worried but don’t know what to do, we must couple negative info about the risks with positive info about solutions, 50-50 instead of the usual 99-1 ratio you see in the news and on social media. ted.com/talks/katharin…
Our goal is not to have everyone in the world paralyzed with fear. Our goal is to have us all motivated to act. But in order to do that, we must understand BOTH the risks of inaction as well as the possibilities of action. Here’s a great place to start!
With climate records being shattered weekly, this cartoon is even more apt.
July global avg temp is the latest to fall; a new analysis by @khaustein finds it's the hottest ever recorded, possibly the hottest in 120,000 years.
Here's what this means & why there’s still hope.🧵
July's average global temperature is projected to be 1.3-1.7°C above the average before human-induced warming began. That's 0.2°C hotter than the previous record set in 2019. For reference see below for July temps through 2022. Source: https://t.co/J6zKe0c9whncei.noaa.gov/access/monitor…
One month above 1.5C **does not mean the Paris Agreement has failed.** Long-term avg warming is measured differently and we've previously seen months above 1.5°C. So while this isn't not a good sign, we still have time to act. For more, read this thread:
This iconic graph tracks how rapidly our planet is warming. Yet every time it's shared on Twitter, someone always asks, "Why does it begin in 1850?"
The answer is simple: it's when we first had enough thermometers to compute a truly representative global temperature average.
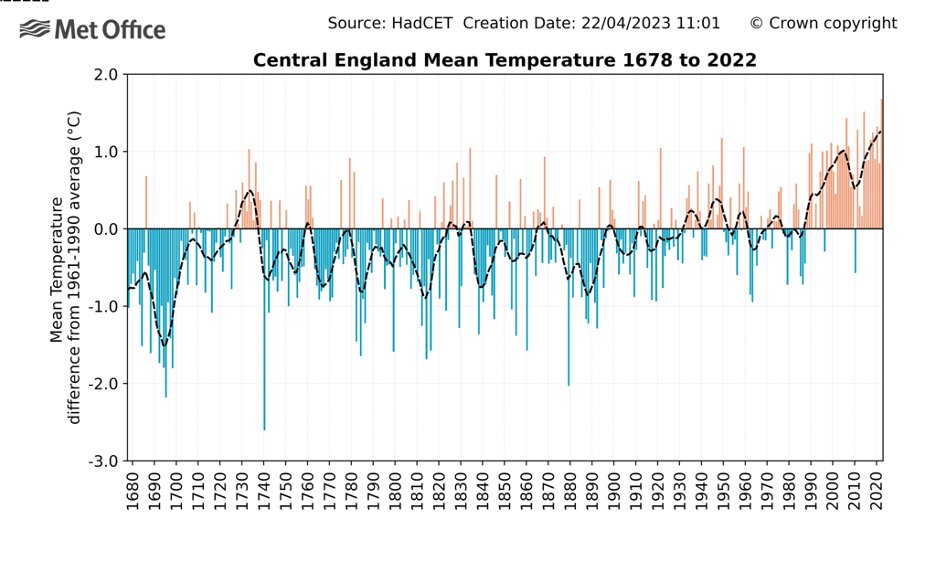
The oldest continuous thermometer-based temperature record is Central England Temperature. It began in 1678 ... when Charles II was King of England! It shows how unusual today's warming is compared to the last four centuries of temperature variability. metoffice.gov.uk/hadobs/hadcet/
We can go further back via proxy records or "natural thermometers" such as historical records, bloom & harvest dates, pollen records, ice cores, etc. Against the backdrop of the last 2,000 years, today's warming is even more abrupt and unusual. Source: nature.com/articles/s4159…
At one end, 53% are already alarmed or concerned. What's critical, though, is that most still aren't ACTIVATED. That's right: only 8% of people in the US are activated! So there's plenty to do in those categories to move people from worried->active. climatecommunication.yale.edu/publications/s…
17% are cautious, and here's a key characteristic of that group: they often lead w their doubts. If those doubts are disrespected, the conversation fails. So don't assume someone is dismissive right away. Ask questions + LISTEN. @karinkirk_mt shows us how: yaleclimateconnections.org/2018/01/middle…
Facebook used to be a lot higher…similar to Twitter…but in Aug 2018 they moved “climate change” and “clean energy” to the list of “sensitive topics” and shadow-banned my account. Since then, growth virtually ceased and the number of people-incl trolls-seeing my posts plummeted.
I should add that I did not contribute to the survey above, but it aligns well with my experience.
Looking for more from me than tweets? I regularly share unique content on a dozen other online platforms...and you won't see most of it on Twitter. Browse this thread for direct links and dive in!
1/ Every week, my free newsletter shares good news, not so good news, and something you can do about climate change. It also has links to join my online talks and read things I've written recently. Subscribe here: mailchi.mp/fae4224ba66d/s…
2/ On LinkedIn, I share longer posts aimed at a knowledgeable audience. I also re-post good discussions and articles from other experts that I appreciate and think others might, too. linkedin.com/in/katharine-h…
Much has changed here since Elon took over. Based on my own before-and-after expts, climate denial responses are up 15-30x. Changes in followers are even more dramatic: Stef's analysis shows that climate accounts have seen little change while denial accounts have boomed.
I've tested a few hypotheses and I think there are a few different factors contributing to this.
First, there was an exodus in Oct. I lost several thousand followers myself and about 10% of the people on my list of "scientists who do climate". Not huge but still real.
Second, many of the trolls replying to climate topics these days joined Twitter within the last six months. Some aren't real, of course, but many swarmed back as previously banned accounts were re-opened and their perspectives validated and supported.