I made $87,000 this month day trading because of one simple concept.
I understand how to enter the most profitable trades possible.
In this thread I’ll explain:
3 Steps To Enter The Best Trades👇
(1/12)
I understand how to enter the most profitable trades possible.
In this thread I’ll explain:
3 Steps To Enter The Best Trades👇
(1/12)

Do you enter trades with no confidence?
Have you tried every trading strategy possible and still can’t find profitability?
Have you asked yourself the question “what am I doing wrong in my trading journey?”
Th answer is you don’t have a strict entry criteria to enter trades.
Have you tried every trading strategy possible and still can’t find profitability?
Have you asked yourself the question “what am I doing wrong in my trading journey?”
Th answer is you don’t have a strict entry criteria to enter trades.
1) Entry Criteria
An entry criteria for entering each trade is important because it helps you to mitigate your emotions.
With a criteria you follow steps that are mechanical so you trade like a robot rather than entering off fomo or greed.
An entry criteria for entering each trade is important because it helps you to mitigate your emotions.
With a criteria you follow steps that are mechanical so you trade like a robot rather than entering off fomo or greed.
2) Step 1
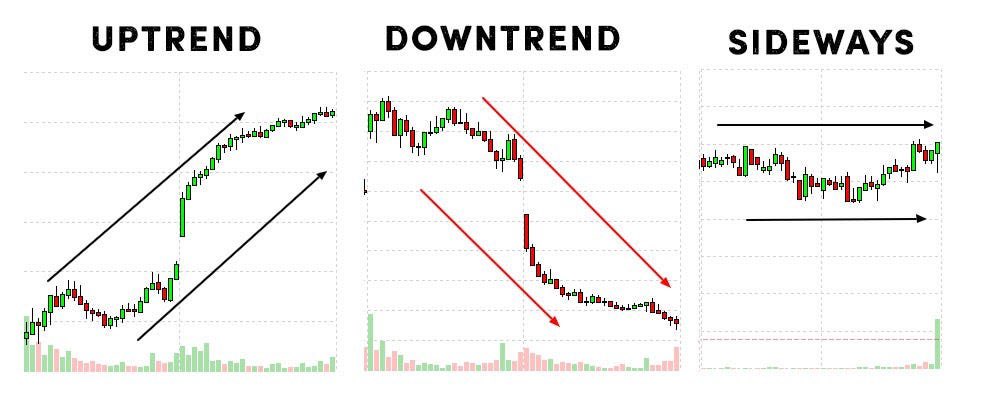
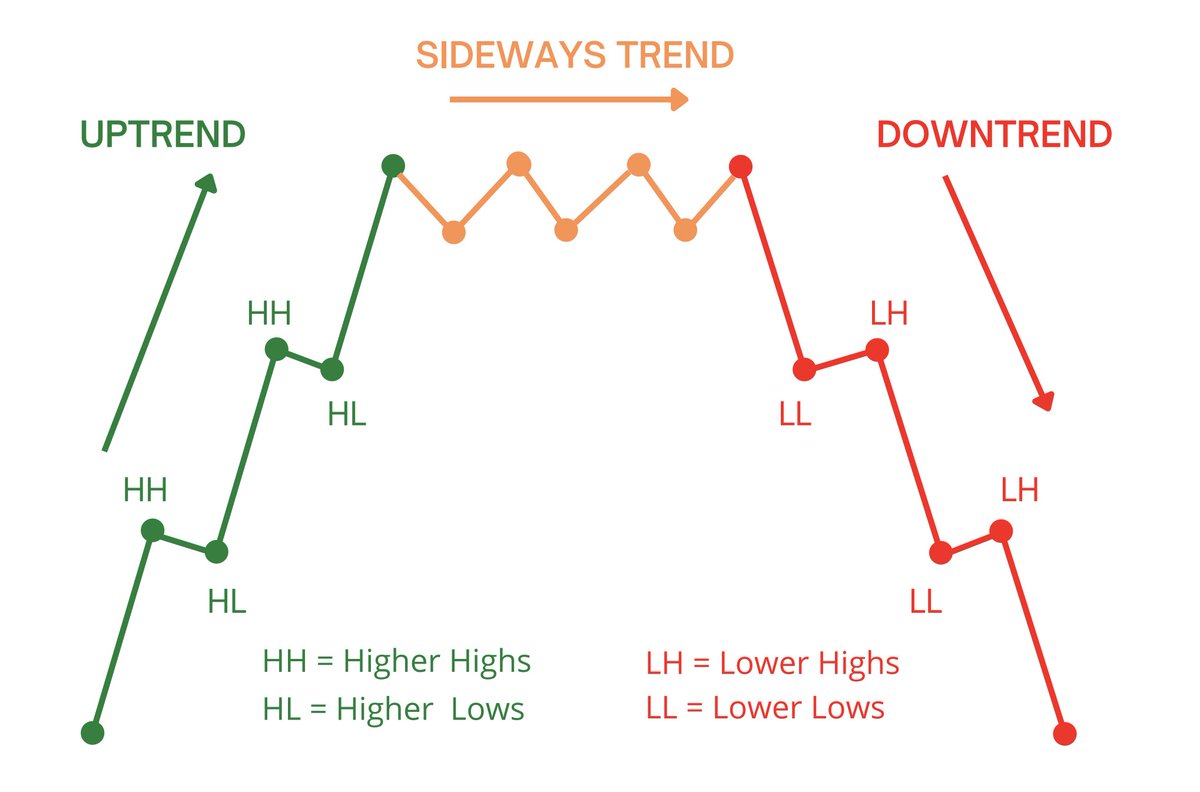
The first step in entering the perfect trade is to understand context.
This is done through identifying market trend, patterns & structure.
The first step in entering the perfect trade is to understand context.
This is done through identifying market trend, patterns & structure.
3) Step 2
The second step is to understand key levels.
This will help you enter and exit at the best r/r entries.
For this you need to mark out levels on your preferred time frames.
The second step is to understand key levels.
This will help you enter and exit at the best r/r entries.
For this you need to mark out levels on your preferred time frames.
4) Step 3
Now, we need to enter the trade.
For this we will only enter based on strong price action for whichever direction the stock is trending.
Now, we need to enter the trade.
For this we will only enter based on strong price action for whichever direction the stock is trending.
5) Real Example of A+ Entry
Here on the higher time frame we see a stock making new higher highs and lows along with creating a flag pattern.
This shows that we will be looking for a continuation of the upside and going long.
Here on the higher time frame we see a stock making new higher highs and lows along with creating a flag pattern.
This shows that we will be looking for a continuation of the upside and going long.

6) Key Levels
We mark out the previous day high and pre market low for our key levels.
To enter this trade we want the stock to break above the level to show strong buyers active and then we will wait for a retest of that level or new highs. I’m
We mark out the previous day high and pre market low for our key levels.
To enter this trade we want the stock to break above the level to show strong buyers active and then we will wait for a retest of that level or new highs. I’m


7) Price Action
Now, the stock retested with a strong hammer candle.
This shows sellers tried to bring the stock below the previous high but couldn’t and buyers stepped in to close it above the level.
We enter here targeting HOD with our stop below the level.
Now, the stock retested with a strong hammer candle.
This shows sellers tried to bring the stock below the previous high but couldn’t and buyers stepped in to close it above the level.
We enter here targeting HOD with our stop below the level.

8) Playing Out The Trade
If we play this trade out it worked and gave us a 2.4 R.
This means if we risked $200 on this trade we would have made $480.
If we play this trade out it worked and gave us a 2.4 R.
This means if we risked $200 on this trade we would have made $480.

In Conclusion,
I hope this 3 step guide to entering the perfect trade helped you build a better energy criteria for your own trades.
If this thread helped you:
- Like + Retweet Original Tweet!
- Follow For More Education!✅
I hope this 3 step guide to entering the perfect trade helped you build a better energy criteria for your own trades.
If this thread helped you:
- Like + Retweet Original Tweet!
- Follow For More Education!✅
P.S-
I made a whole video going into depth about the 3 steps with more examples!
Watch The Video Now: 👇
Daily Trade Reviews + EDU: 👇
https://t.co/TVUK6UnVY3
instagram.com/scarfacetrades_
I made a whole video going into depth about the 3 steps with more examples!
Watch The Video Now: 👇
Daily Trade Reviews + EDU: 👇
https://t.co/TVUK6UnVY3
instagram.com/scarfacetrades_
• • •
Missing some Tweet in this thread? You can try to
force a refresh