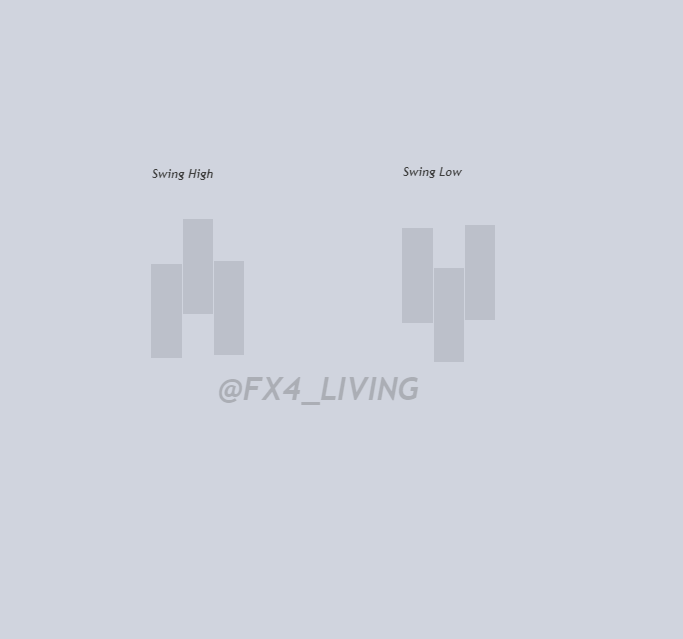
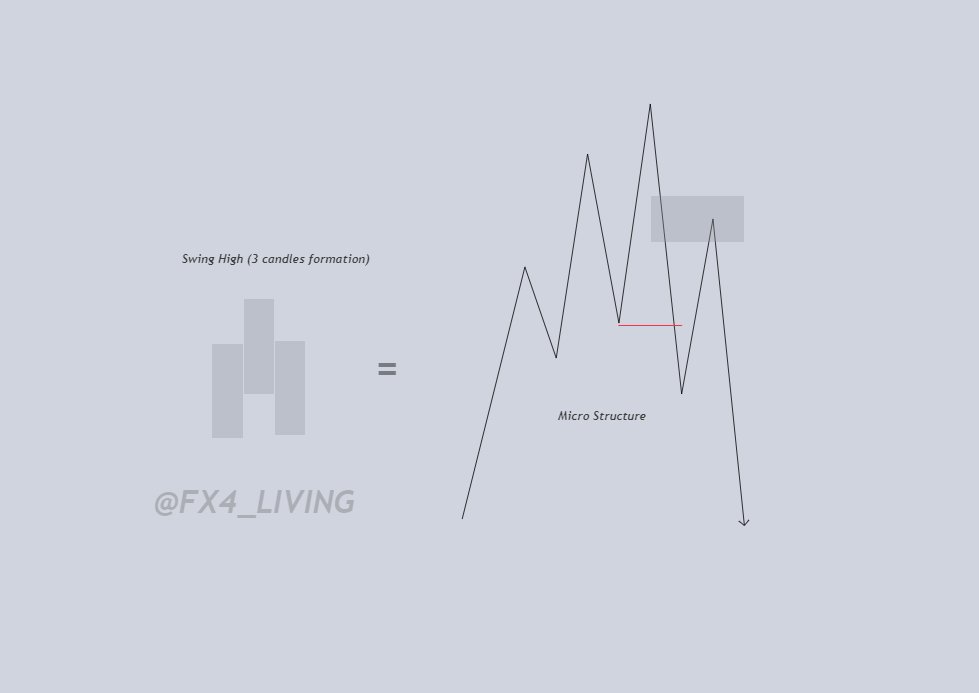
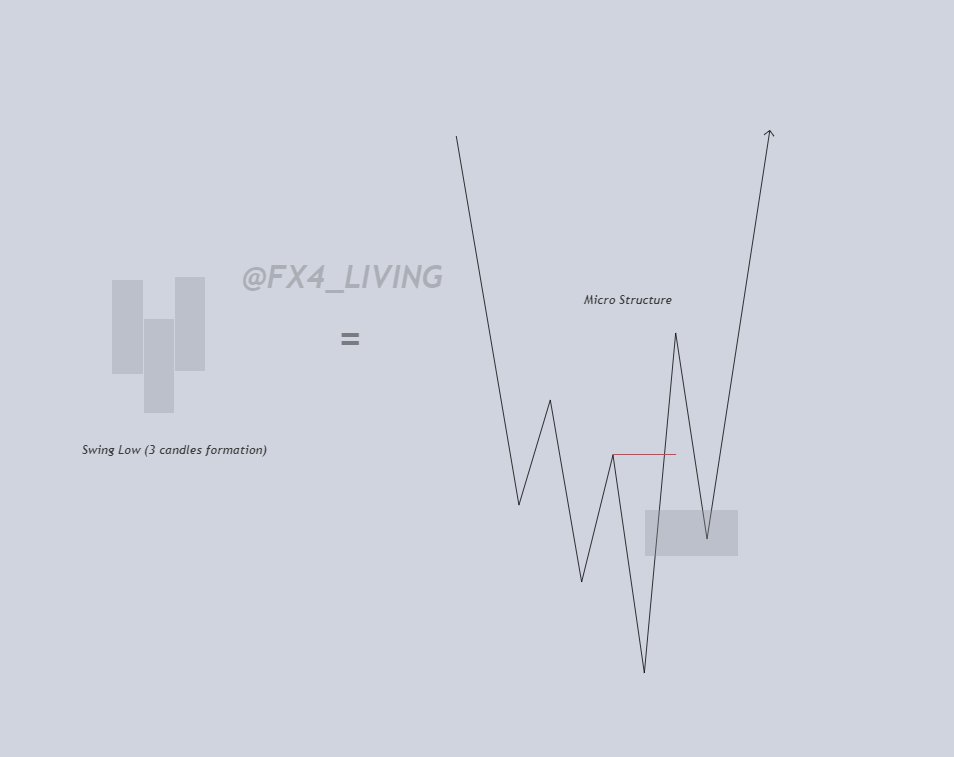
A swing high is a three-candle or three-bar pattern with a high in the middle and two lower highs on either side of it. Conversely, a swing low is a pattern with a low in the middle and two higher lows on either side of it.
These patterns were taught by Larry Williams and are simple and easy to identify in price action.
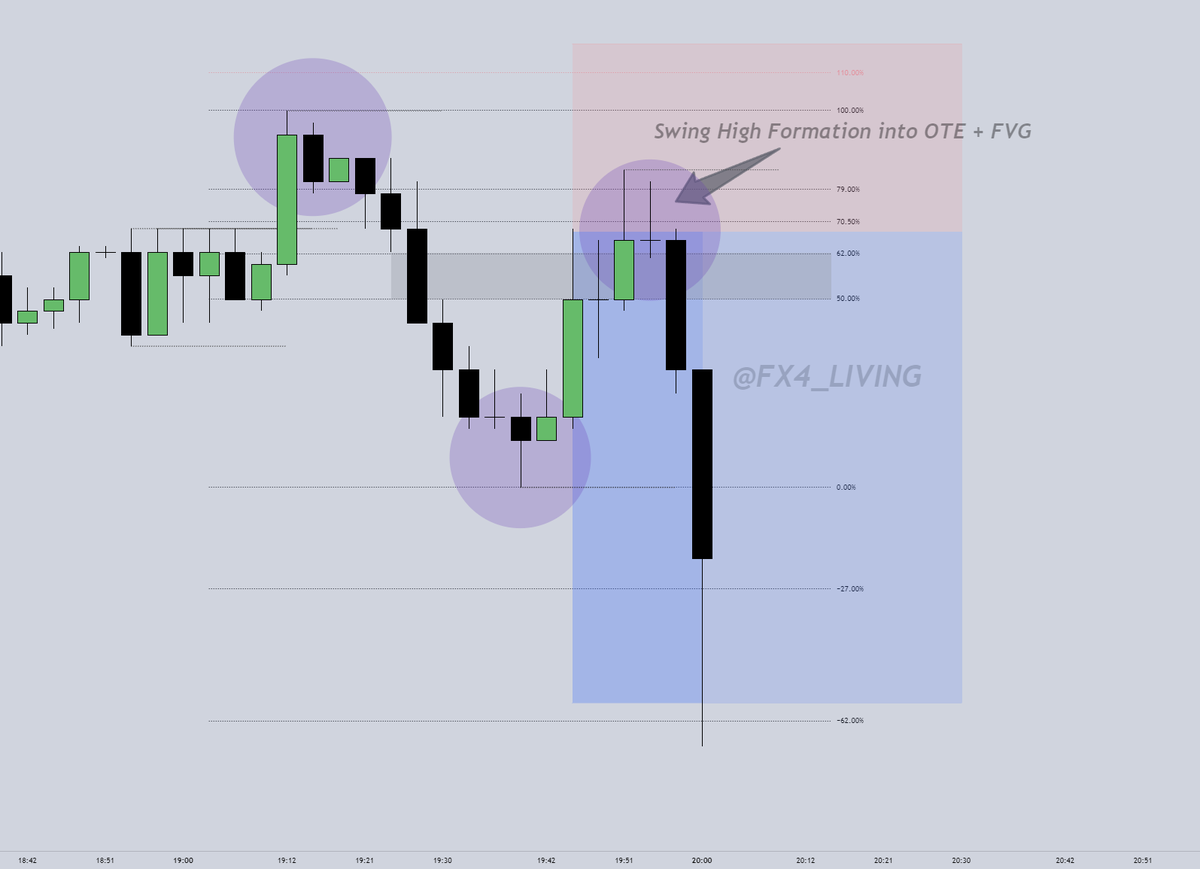
They can be used to anticipate price movements, such as expecting the price to drop after a swing high or rise after a swing low using an ICT OTE.
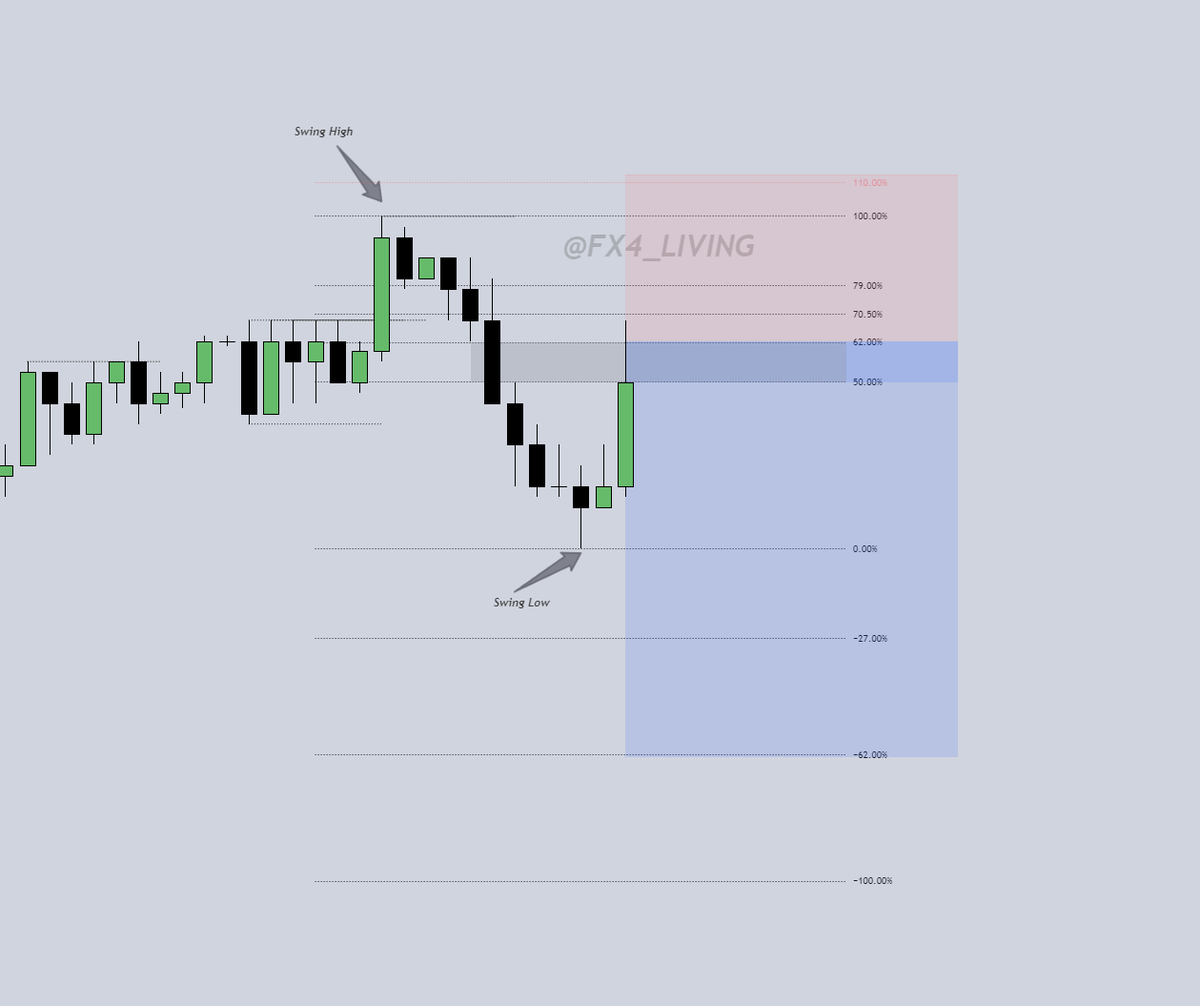
If you add an OTE + FVG, it's like the cream.
:)
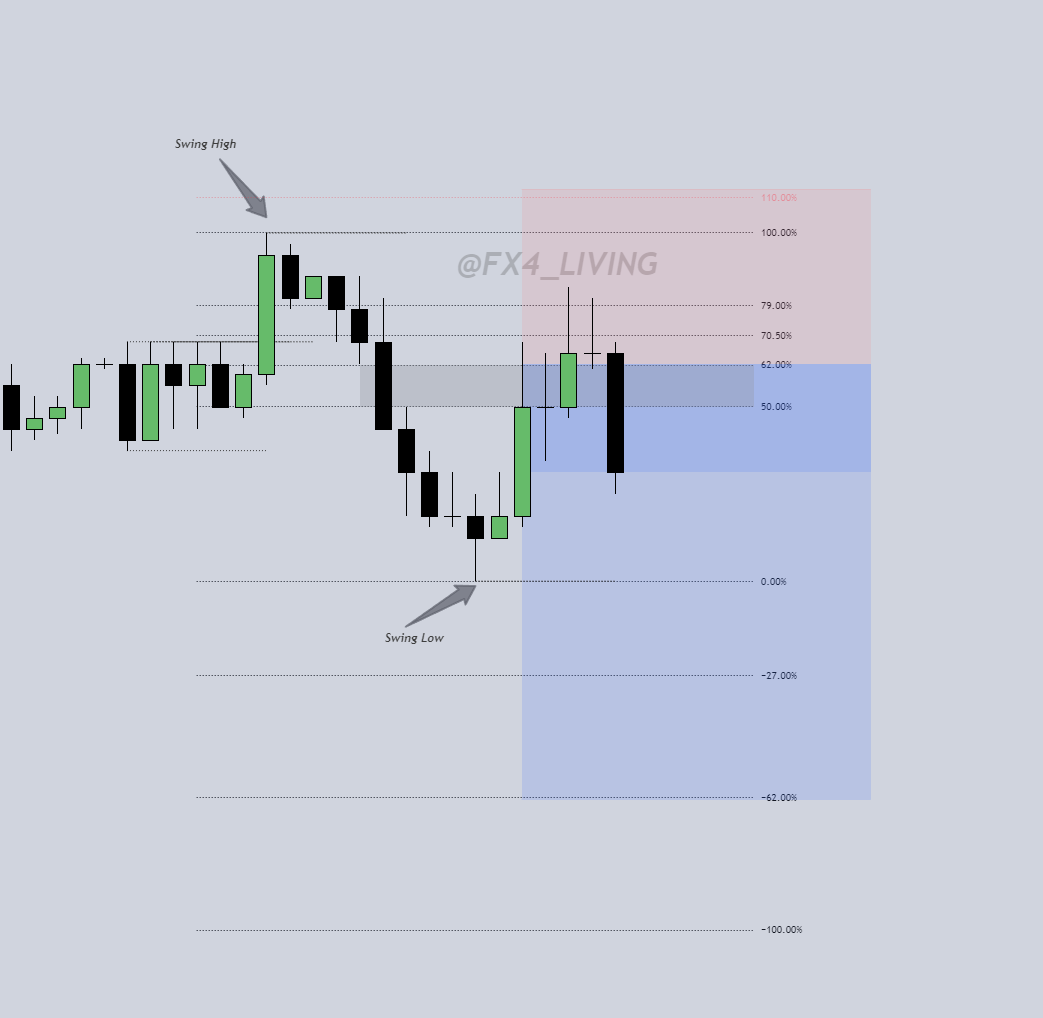
What does a Swing High Consist of in a lower timeframe microstructure?
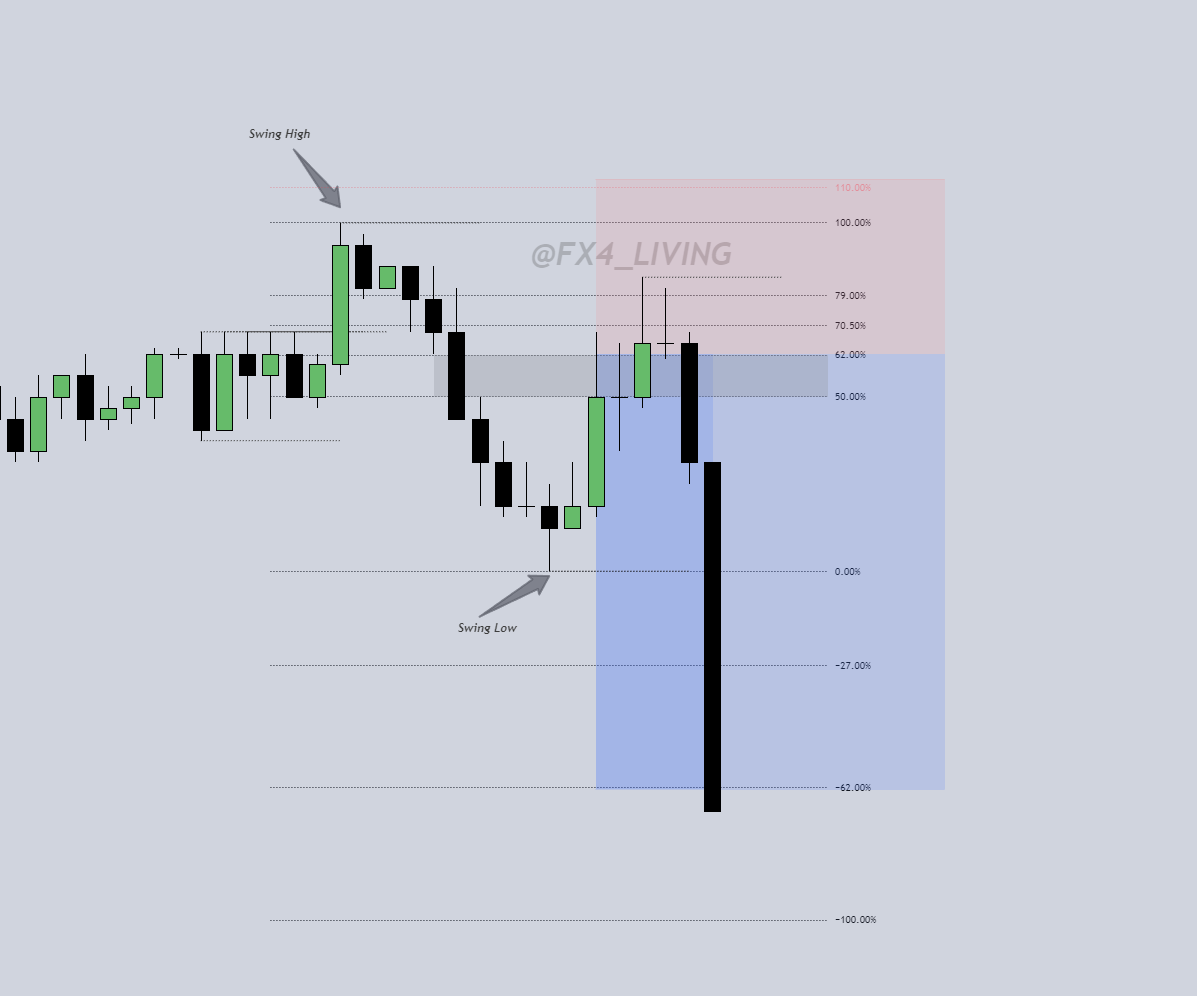
What does a Swing Low Consist of in a lower timeframe microstructure?
Putting the confluences together. (Reinforcing your trading idea)
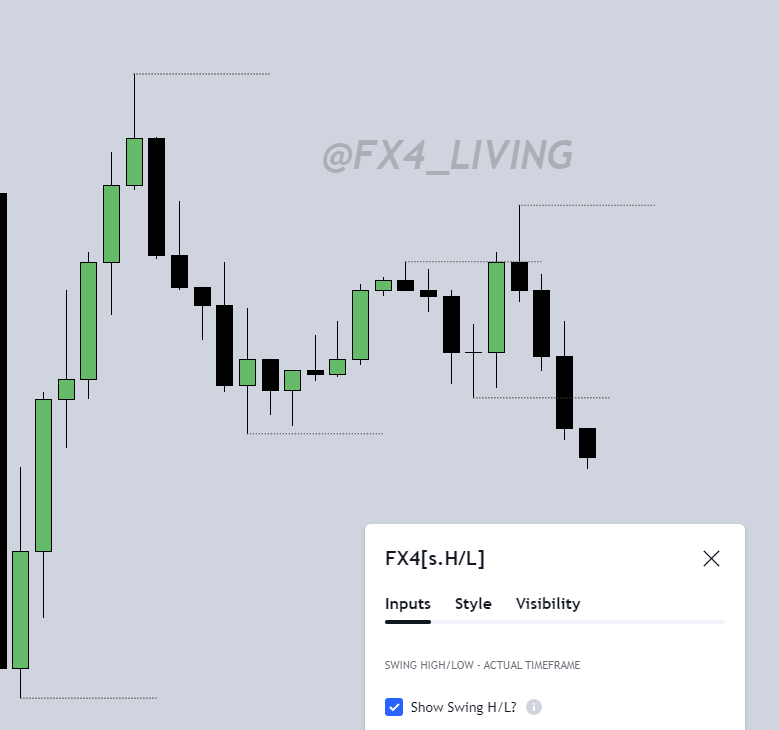
I coded a very simple tool to identify those, you can get access to it for 100% FREE in my Discord (link in my bio) you are welcome! 🫡🤝
• • •
Missing some Tweet in this thread? You can try to
force a refresh
Turbocharge your FX4 Model framework with the Statistical Statmap by @_joshuuu to pinpoint precise levels for high-quality setups.🧐
We use fractal static levels from the previous day and today's accumulation range to identify premium and discount zones, enhanced by Statmap's datamined data for a stronger edge.
This combination ensures a strategic approach to identifying optimal setups.🤯
Test it yourself 🙏don’t just take my word for it.
Links to both tools are below: 👇
Example #1: including the link to get access the FX4 Model: fx4model.com
Example #2: including the link to get access the Statmap by @_joshuuu also for extra 20% off
use my promo code: fx4living
HTF Po3 [Pro+] by @toodegrees
(Show Higher Timeframe Candle on the right side)
OHLC Statistical Mapping [Pro+] by @_joshuuu
(Show the Average Time x Price of the previous candle of your choice) "Market Cycle Stats"
Take a 5min and watch that.
Here the story 🧵💫 :
The OHLC Statistical mapping [Pro+] show you the opening Price, my OH/LC tool show you the previous 30 min candles within the 30 seconds timeframe. (orange🟠 line)
Previous M5/M15/M30 right there indicated by the FX4 OH/LC indicator (Red Line) -> that's your short term draw on liquidity.
After the Buy/Sell Stop Raid🛑, if you want to see an FVG ⚡️, must have a Draw on Liquidity 🎯 in the opposite direction of at least 12-15 Handles or 12-15 pips for Forex.
5 Minutes Chart, a 15-minute Draw on Liquidity,
can be the Previous 15/30 minutes High and Low.
(Enough Liquidity for Scalping)