TEN types of statistical averages
THREE simple frameworks for thinking about measures of central tendency.
This thread has it all!
THREE simple frameworks for thinking about measures of central tendency.
This thread has it all!

Warning: You may have heard people say there's only one thing called "the average" or "the mean". In this thread, we're going to use the word "average" or "mean" to apply to any one of a large family of measures of central tendency.
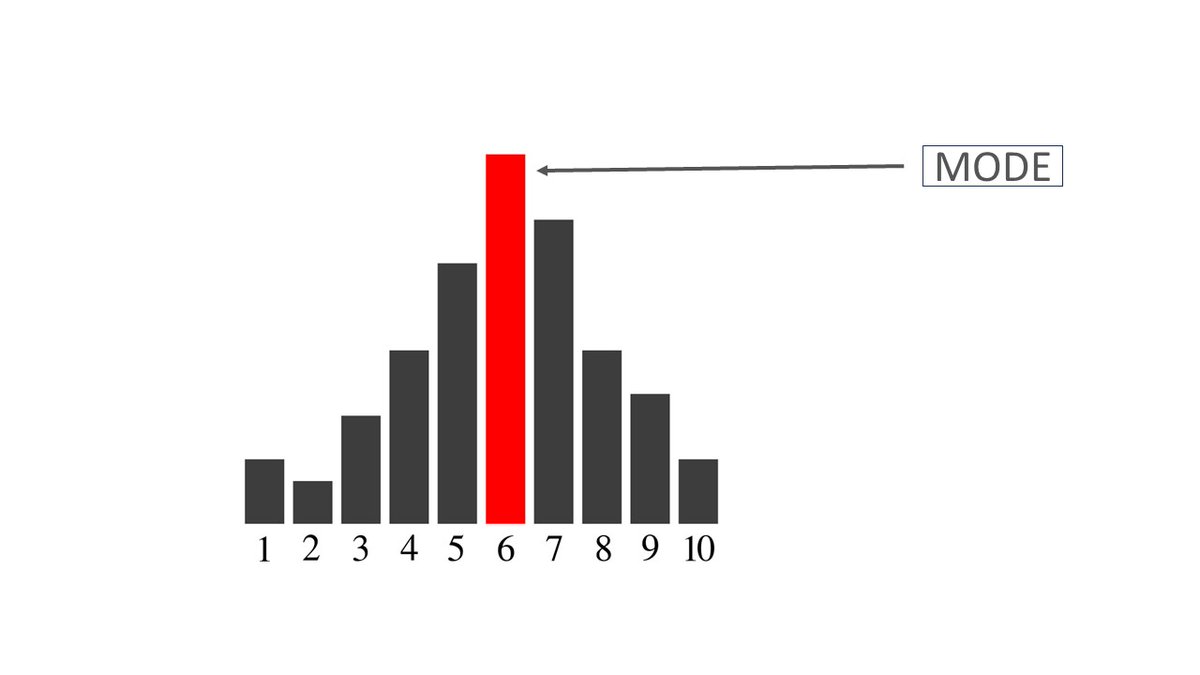
1. Mode
(Let's start slow. Feel free to skip the stuff you already know!)
This is the value that occurs most frequently in your data.
(Let's start slow. Feel free to skip the stuff you already know!)
This is the value that occurs most frequently in your data.
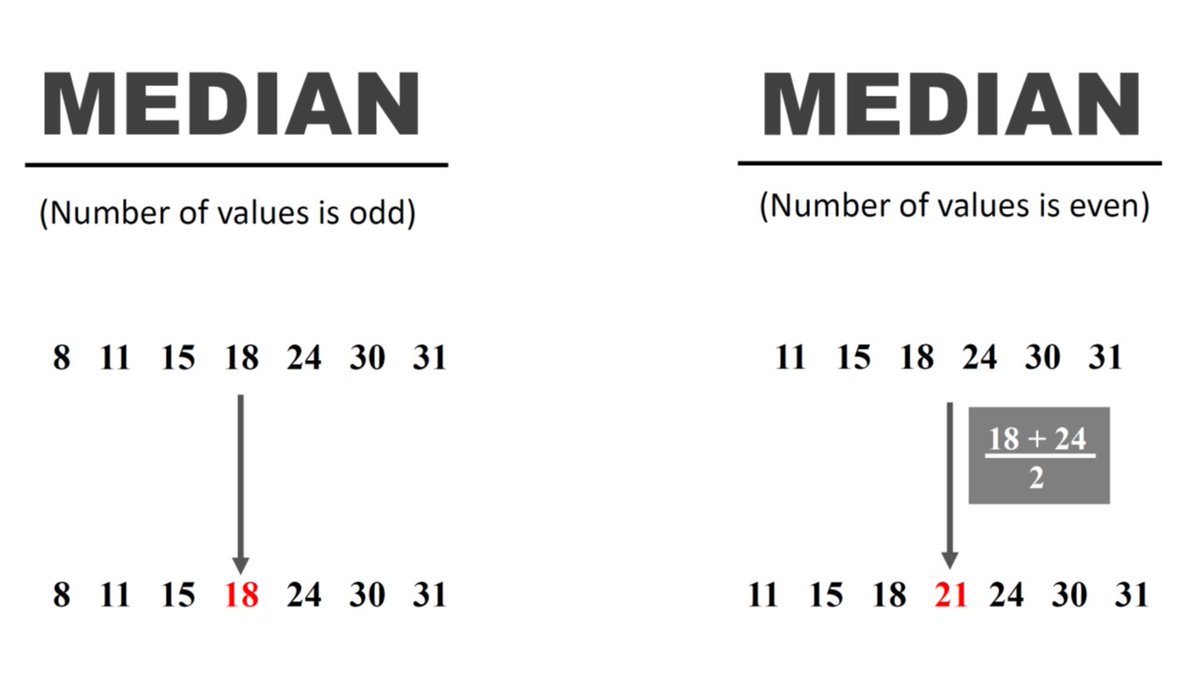
2. Median
If you line your data up from largest to smallest, then this is the value at the center of your data. (If you have an even number of data points then it's the number that's half way between those two central values.)
If you line your data up from largest to smallest, then this is the value at the center of your data. (If you have an even number of data points then it's the number that's half way between those two central values.)
3. Arithmetic mean
This is what people usually mean by "the mean" or "the average". It's the gold standard. You add up all your data and divide by the number of observations.
This is what people usually mean by "the mean" or "the average". It's the gold standard. You add up all your data and divide by the number of observations.

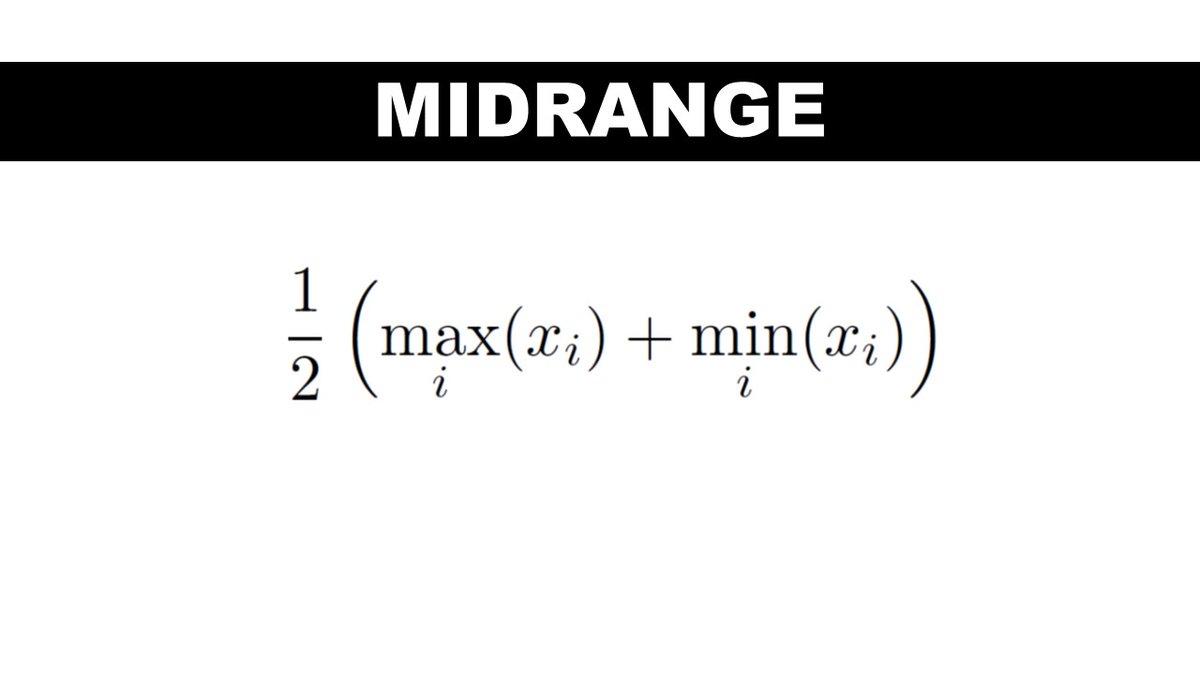
4. Midrange
The value in the exact middle of the range of your data. It's halfway between the maximum and minimum value.
The value in the exact middle of the range of your data. It's halfway between the maximum and minimum value.
FRAMEWORK: Distance to Data
The mode, median, midrange and arithmetic mean might seem disconnected but there's a single mathematical idea that ties them together.
They all minimize the distance measure below for specific values of p.
They're the "closest" point to your data.
The mode, median, midrange and arithmetic mean might seem disconnected but there's a single mathematical idea that ties them together.
They all minimize the distance measure below for specific values of p.
They're the "closest" point to your data.
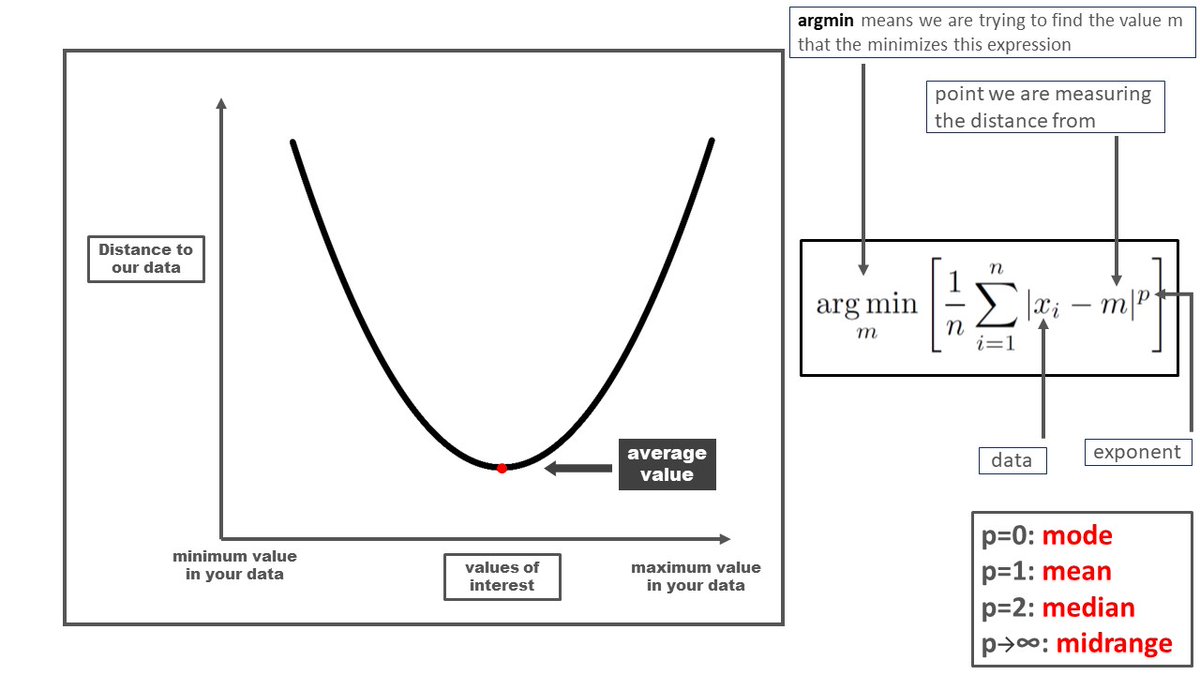
The idea is the "center" of our data is the the point that's closest to all the data points simultaneously.
The mode, median, midrange and arithmetic mean are at the center of our data according to four different definitions of distance.
The mode, median, midrange and arithmetic mean are at the center of our data according to four different definitions of distance.
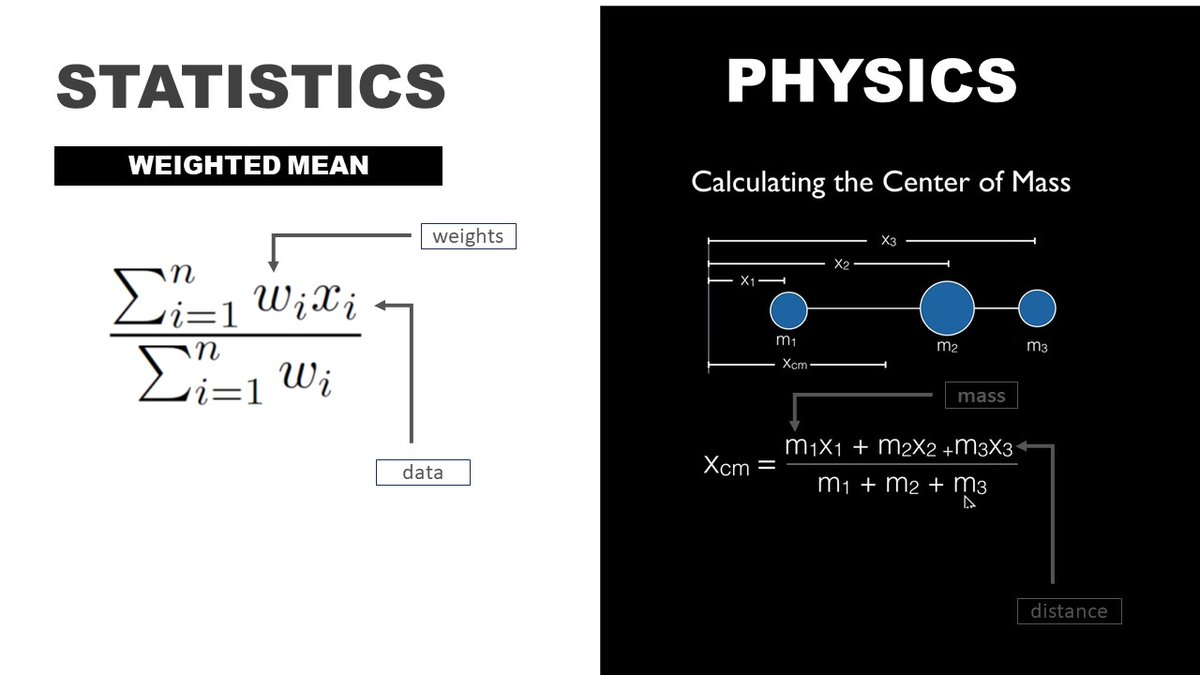
5. Weighted arithmetic mean
In physics, the center of mass is the point where an object perfectly balances.
The weighted mean is kind of like the center of mass of your data when weighted according to your chosen weights. The formula is basically the same as the physics version
In physics, the center of mass is the point where an object perfectly balances.
The weighted mean is kind of like the center of mass of your data when weighted according to your chosen weights. The formula is basically the same as the physics version
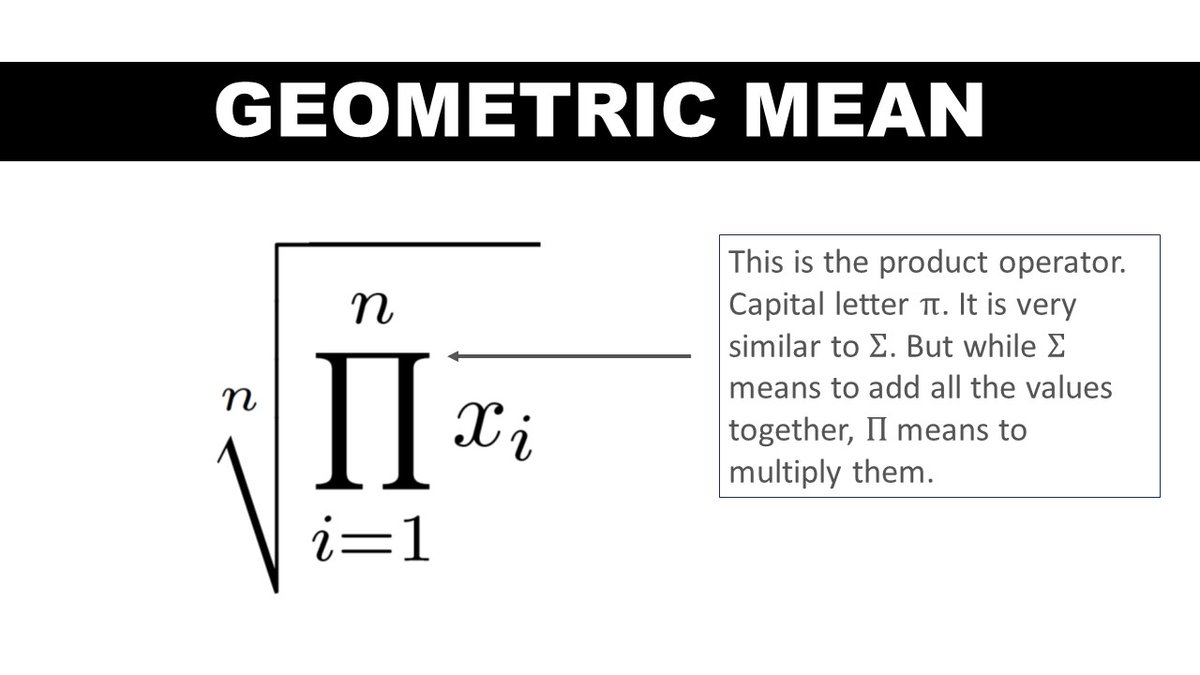
6 Geometric mean
To compute this mean, we multiply all the values together and take the nth root.
If your investments grew at a factor of x in the first year and y in the second then the average yearly growth of your investments is the geometric mean.
To compute this mean, we multiply all the values together and take the nth root.
If your investments grew at a factor of x in the first year and y in the second then the average yearly growth of your investments is the geometric mean.
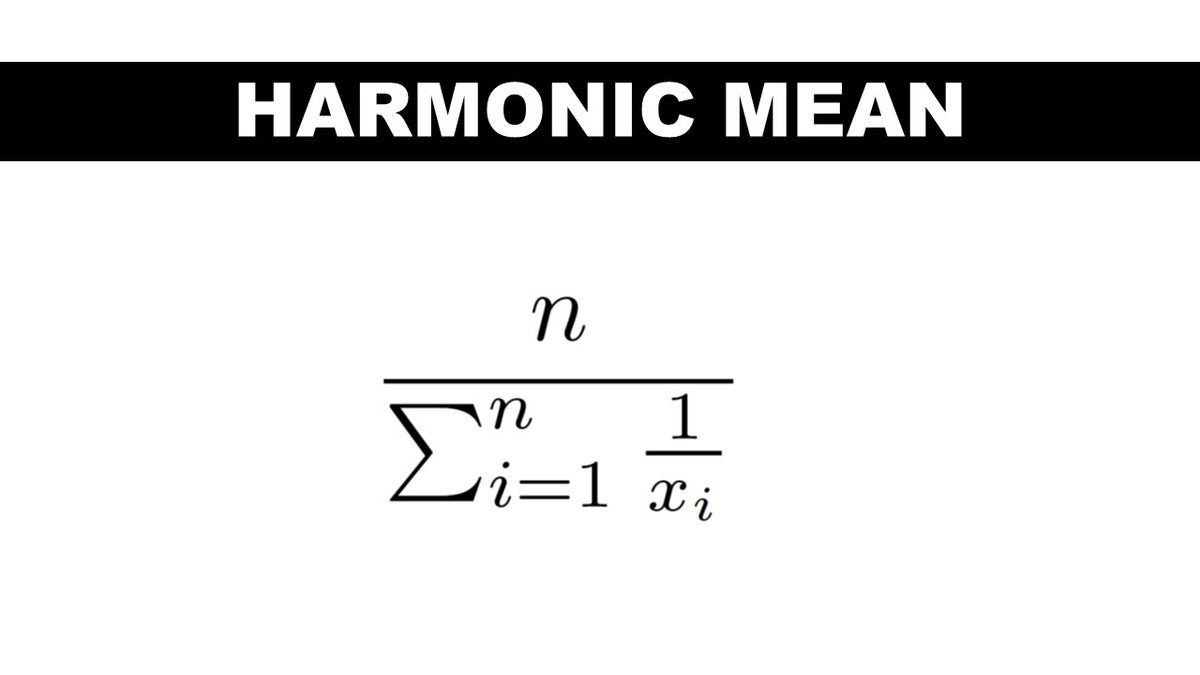
7. Harmonic Mean
You might be wondering when would anybody ever use this crazy mean?
It actually has plenty of real-world relevance. For example, if you drive to work at speed x and return home at speed y, the average speed of your round trip is the harmonic mean of x and y.
You might be wondering when would anybody ever use this crazy mean?
It actually has plenty of real-world relevance. For example, if you drive to work at speed x and return home at speed y, the average speed of your round trip is the harmonic mean of x and y.
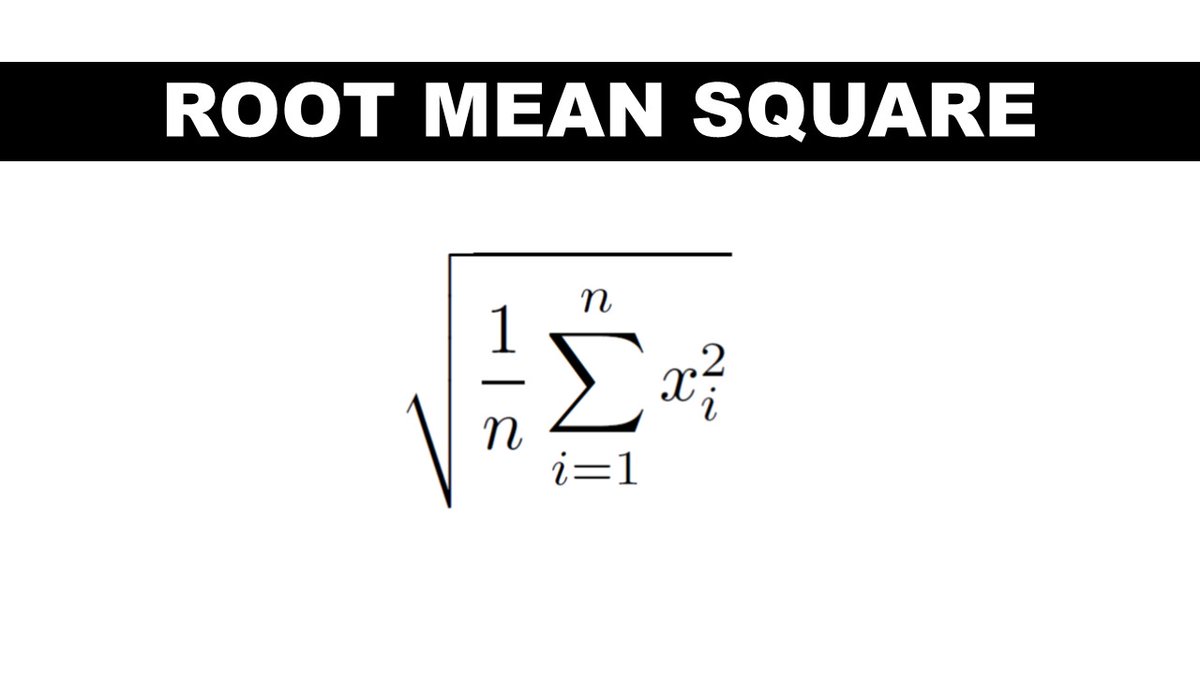
8. Root mean square
This one shows up in physics class as a measure of the power of waves. Waves vary in time and this is the right way of averaging over that variation.
This mean also shows up in a slightly modified form as a measure of average error in machine learning models
This one shows up in physics class as a measure of the power of waves. Waves vary in time and this is the right way of averaging over that variation.
This mean also shows up in a slightly modified form as a measure of average error in machine learning models
FRAMEWORK: The Algebraic Perspective
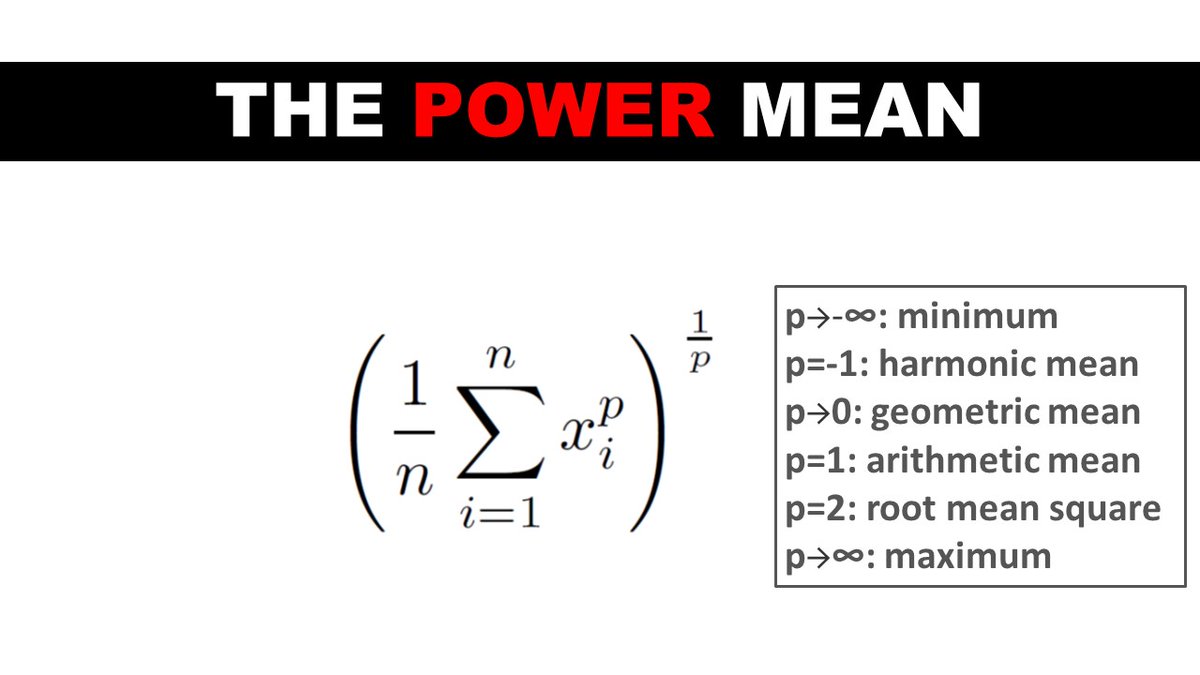
9. Power Mean
The root mean square and also the arithmetic, geometric and harmonic means probably seem disconnected as well but they have their own unifying principle.
They are specific examples of the power mean!
9. Power Mean
The root mean square and also the arithmetic, geometric and harmonic means probably seem disconnected as well but they have their own unifying principle.
They are specific examples of the power mean!
10. F-Mean
The power mean itself is just a specific example of a more general concept, the F-mean!
If there's a function f that never decreases in the range of our data, we can use it to define our own mean.
(You'll probably never use this but it's still fun to know.)
The power mean itself is just a specific example of a more general concept, the F-mean!
If there's a function f that never decreases in the range of our data, we can use it to define our own mean.
(You'll probably never use this but it's still fun to know.)

FRAMEWORK: A Shopping List of Desirable Criteria
We can further unify the concept of an average by thinking of them as a collection of procedures that usually have most of the following properties.
(Don't worry. I will explain these in plain English in the next tweet.)
We can further unify the concept of an average by thinking of them as a collection of procedures that usually have most of the following properties.
(Don't worry. I will explain these in plain English in the next tweet.)
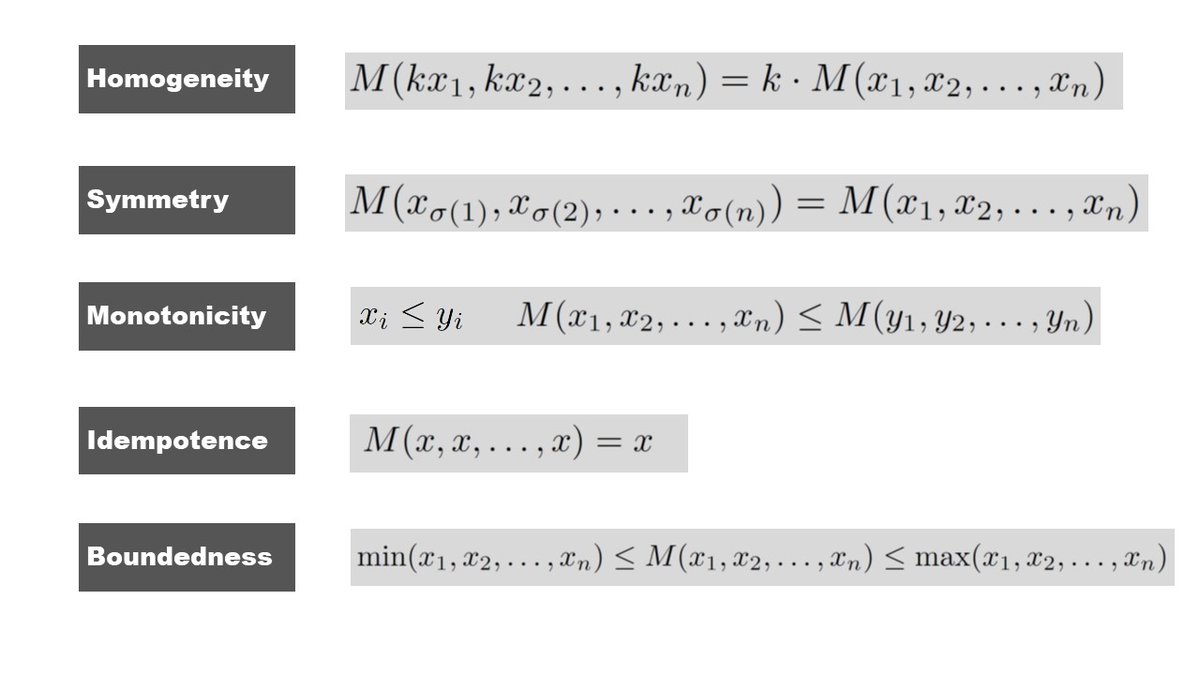
Homogeneity: mean of k times the data is k times the mean
Symmetry: order of the data doesn't matter
Monotonicity: increasing any of the values never decreases the mean
Idempotence: mean of identical values is the value itself
Boundedness: mean is always between the min and max
Symmetry: order of the data doesn't matter
Monotonicity: increasing any of the values never decreases the mean
Idempotence: mean of identical values is the value itself
Boundedness: mean is always between the min and max
SUMMARY:
Averages arise in diverse ways:
- measures of distance to our data
- analogies to physical properties (center of mass)
- summarizers of physical and real world processes like average speeds, interest rates and waves
Averages arise in diverse ways:
- measures of distance to our data
- analogies to physical properties (center of mass)
- summarizers of physical and real world processes like average speeds, interest rates and waves
Despite that diversity, they aren't disconnected concepts, there are several intriguing, unifying themes in their mathematical properties.
If you liked this thread and want more stuff like this on your timeline, give me a follow and don't forget to click the notification bell!
If you liked this thread and want more stuff like this on your timeline, give me a follow and don't forget to click the notification bell!
• • •
Missing some Tweet in this thread? You can try to
force a refresh