Mike Babayan Profile picture
Aug 4, 2023 β€’ 11 tweets β€’ 3 min read β€’ Read on X
FREE Supply & Demand Trading Guide

Everything you need to know... πŸ‘‡

Like & RT If you enjoy ❀️ Image
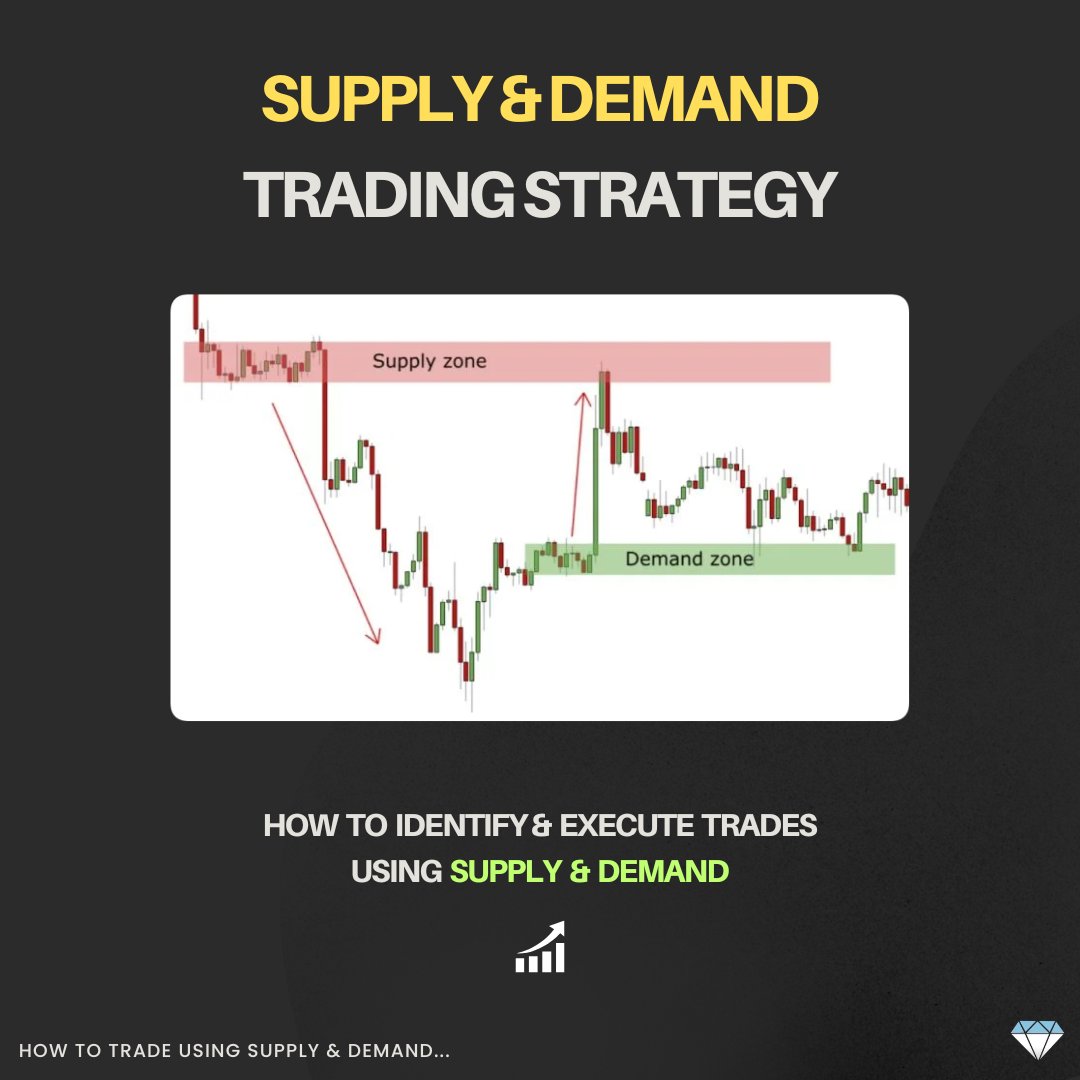
1) What is Supply & Demand? Image
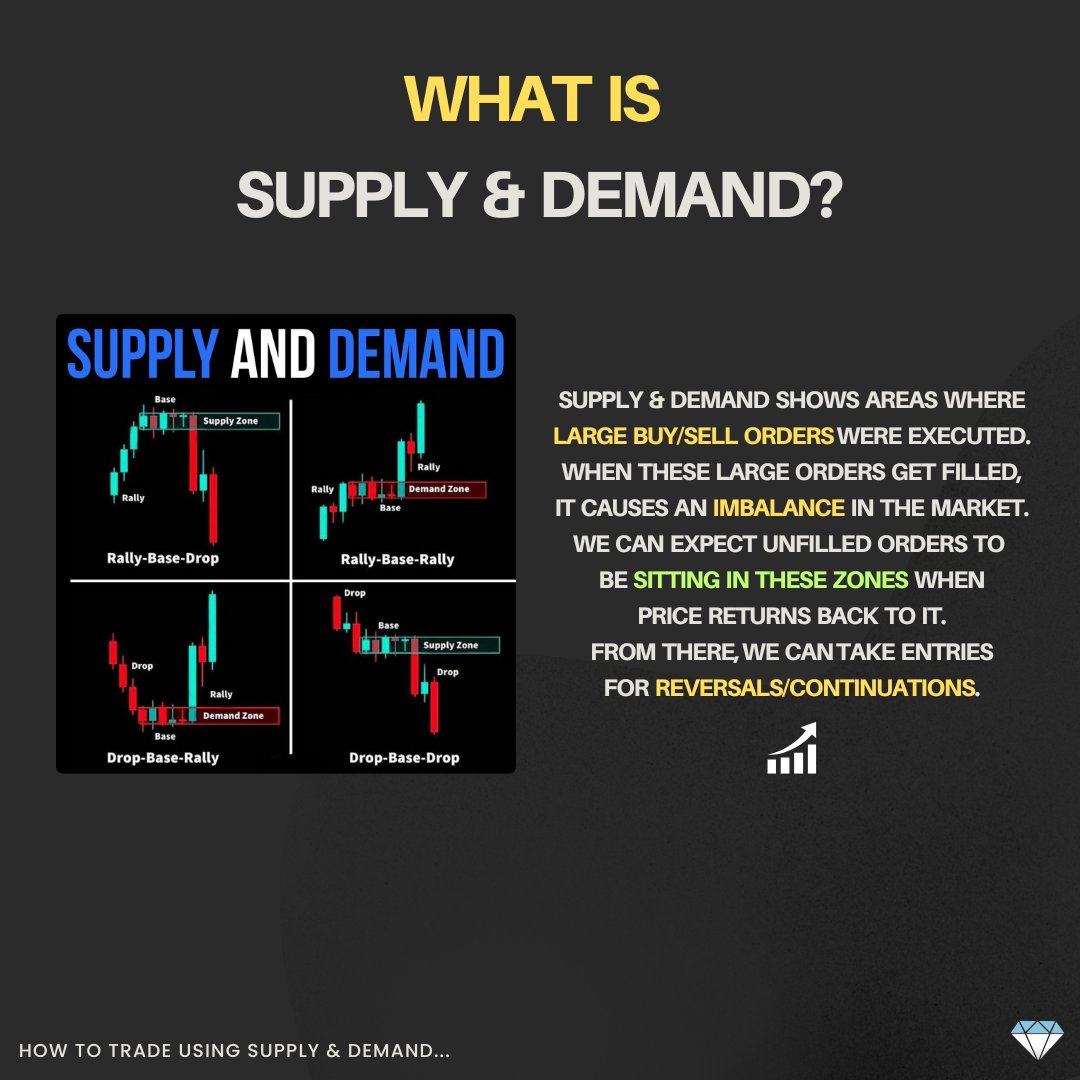
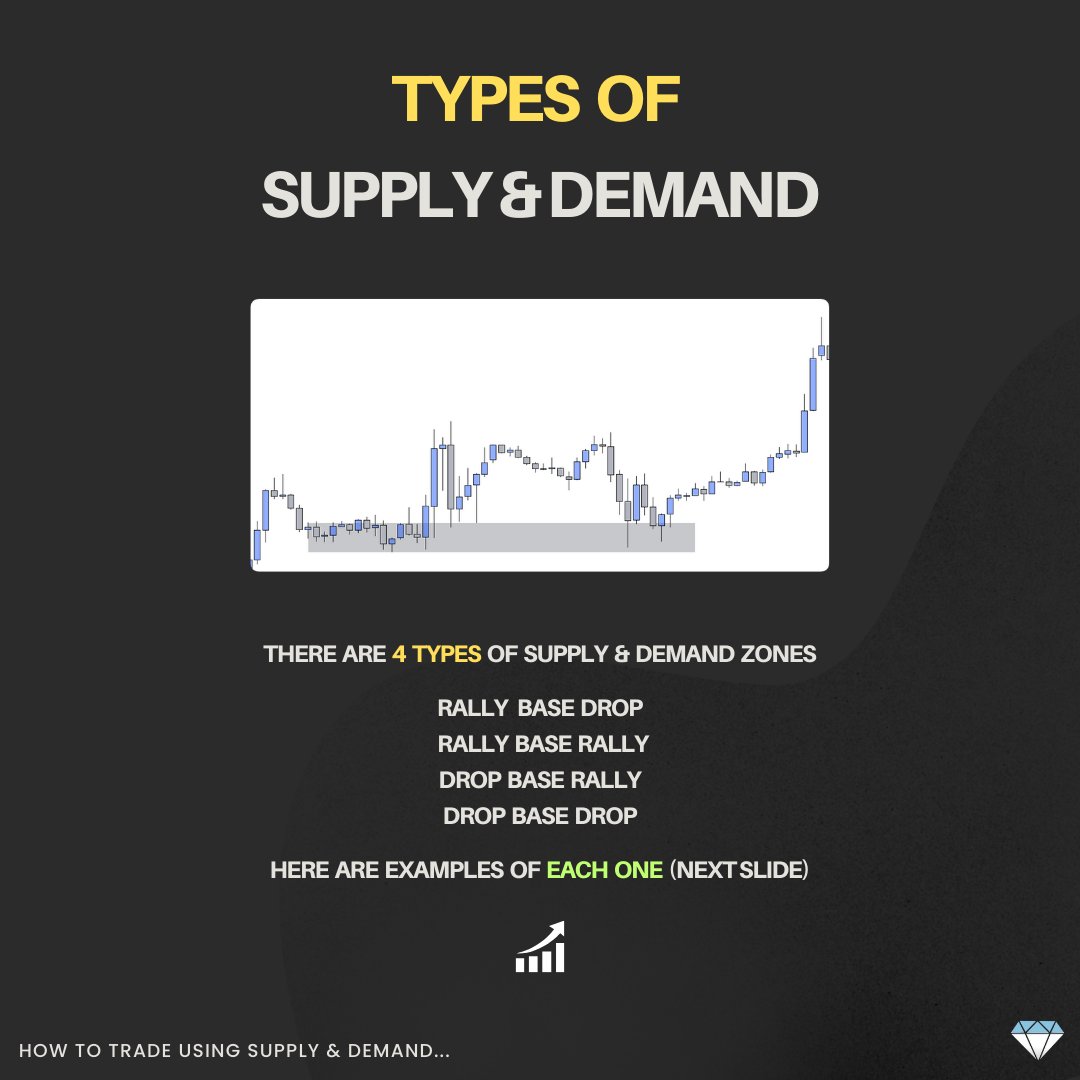
2) Types of Supply & Demand Image
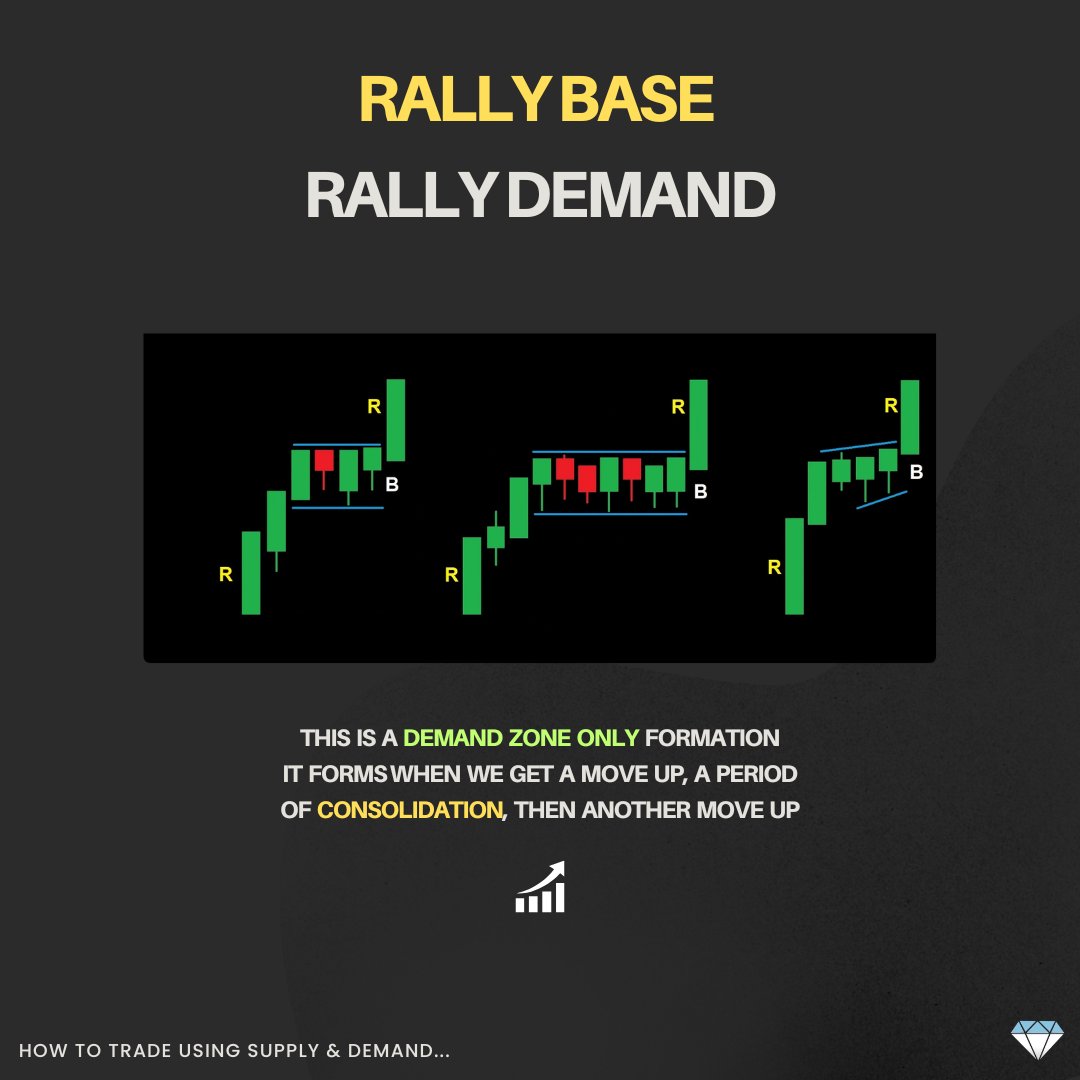
3) Rally Base Rally Demand Image
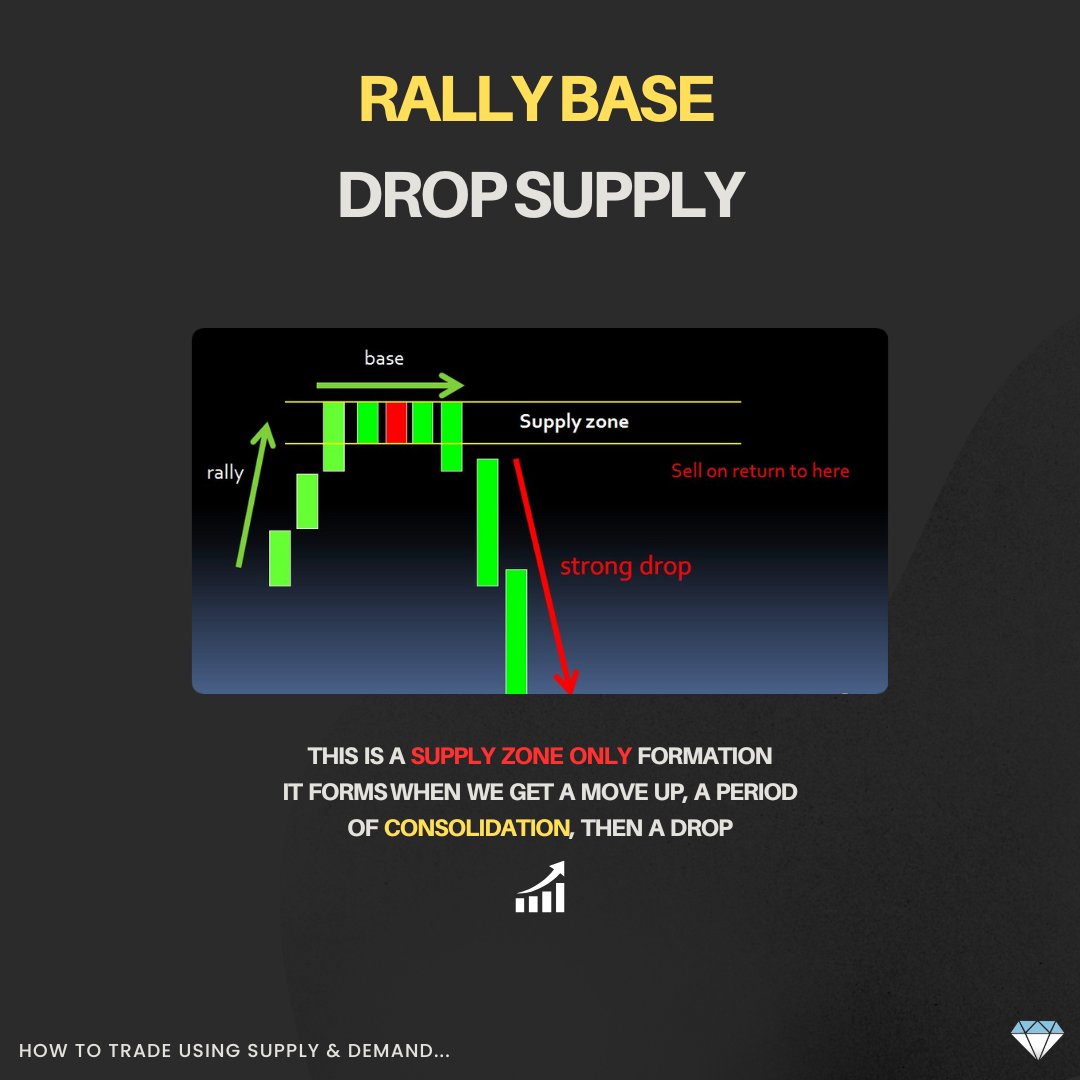
4) Rally Base Drop Supply Image
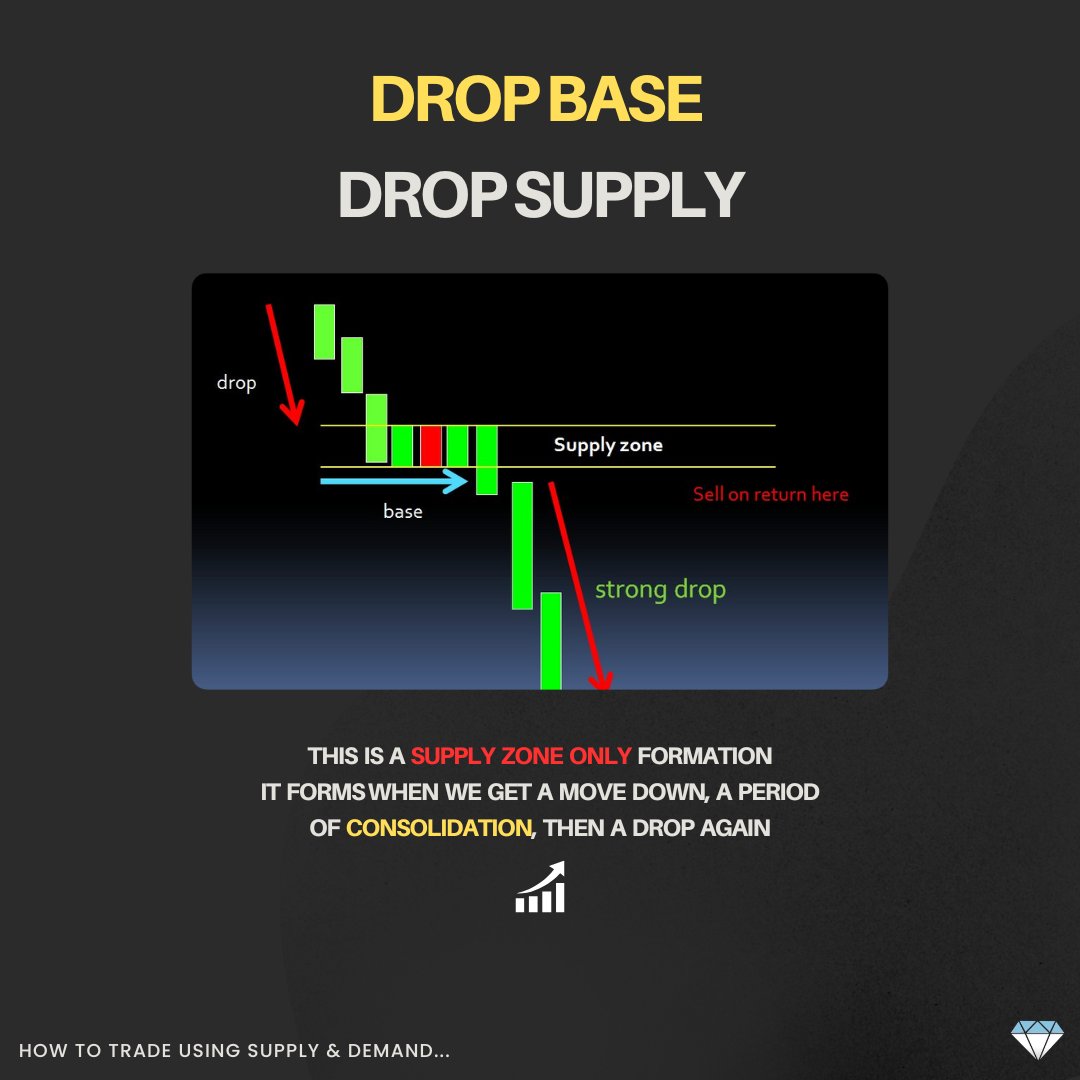
5) Drop Base Drop Supply Image
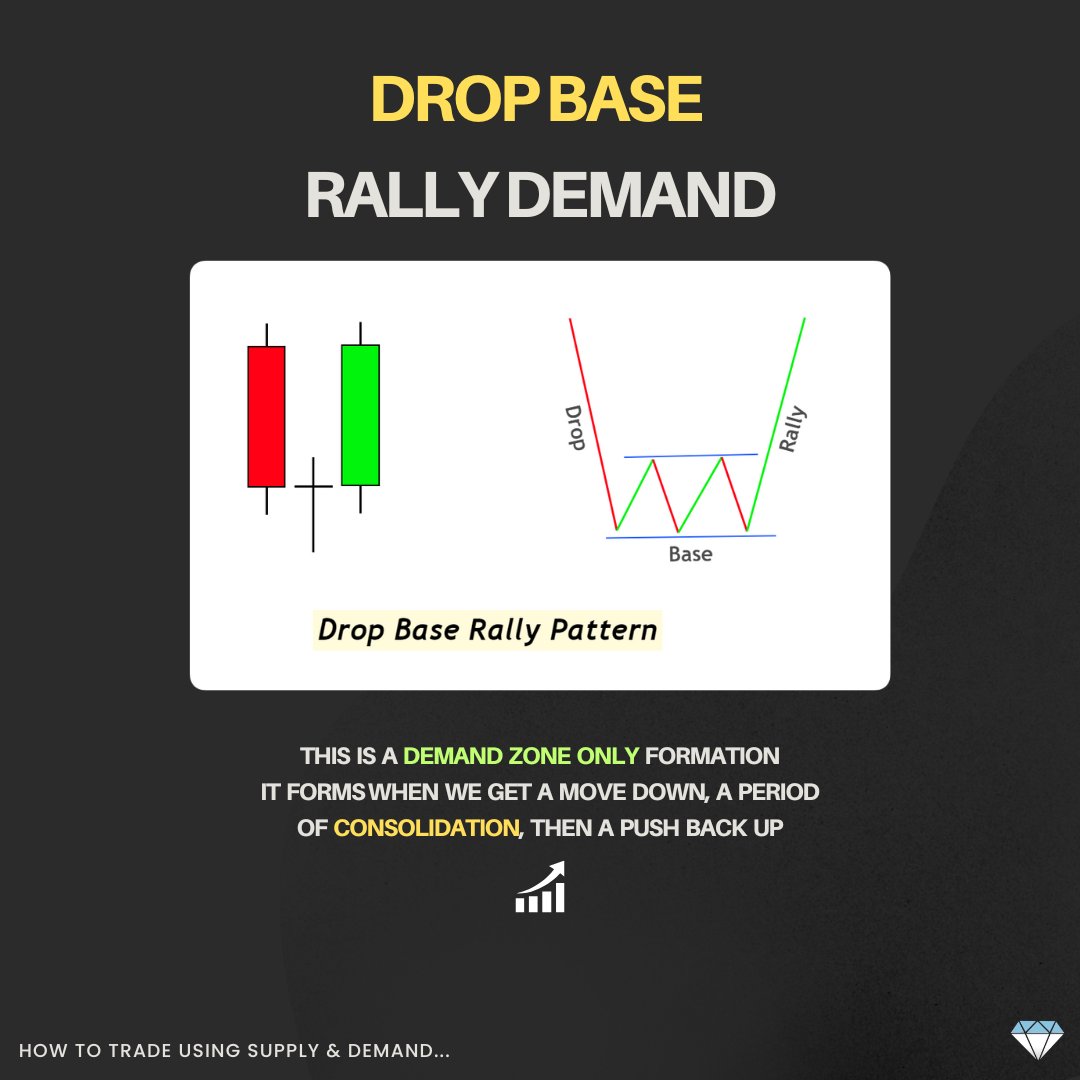
6) Drop Base Rally Demand
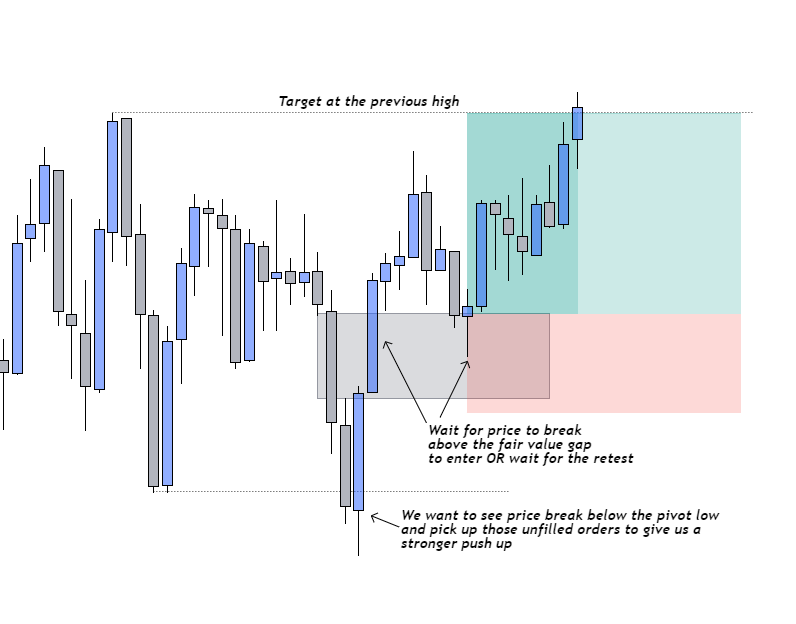
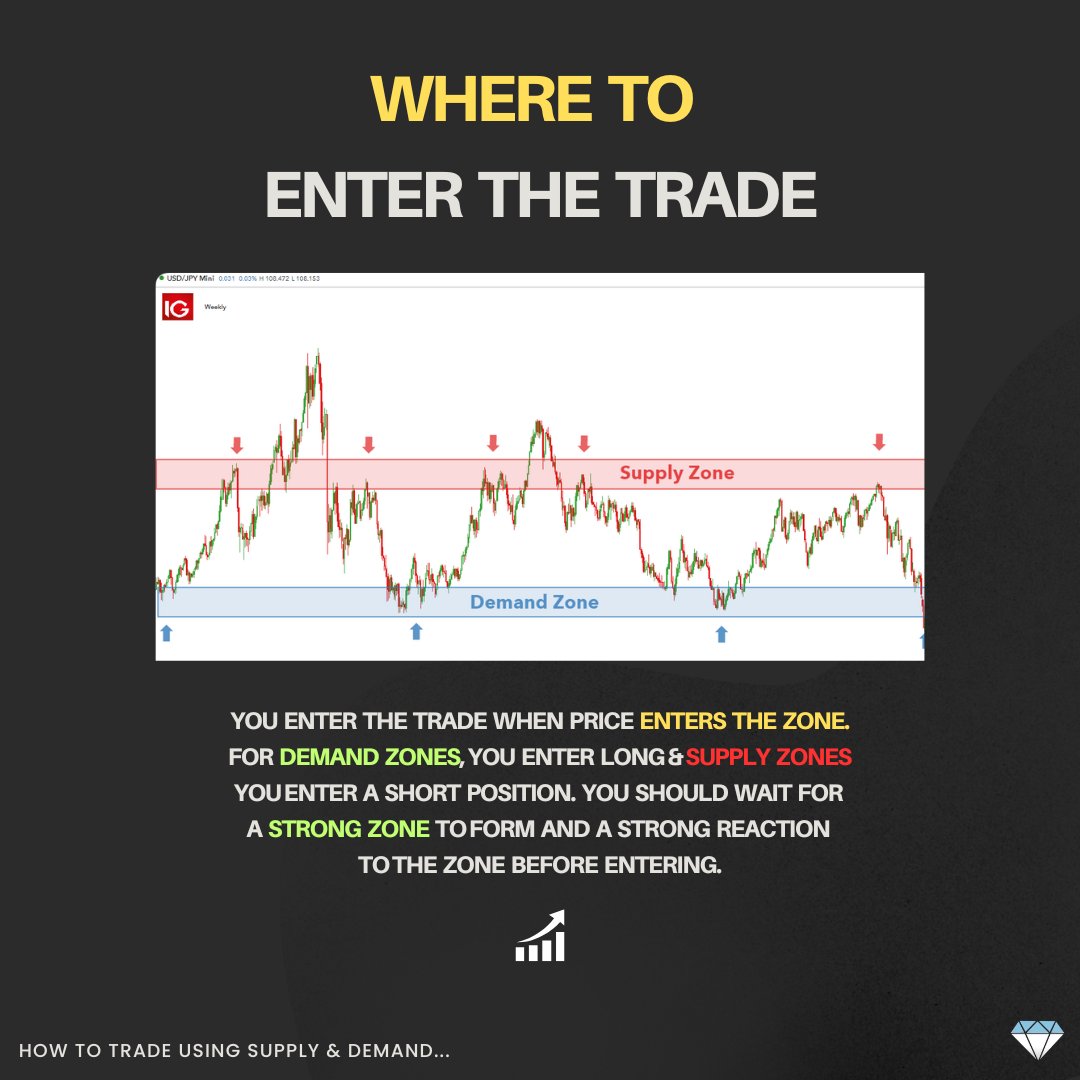
 Image
7) Where To Enter? Image
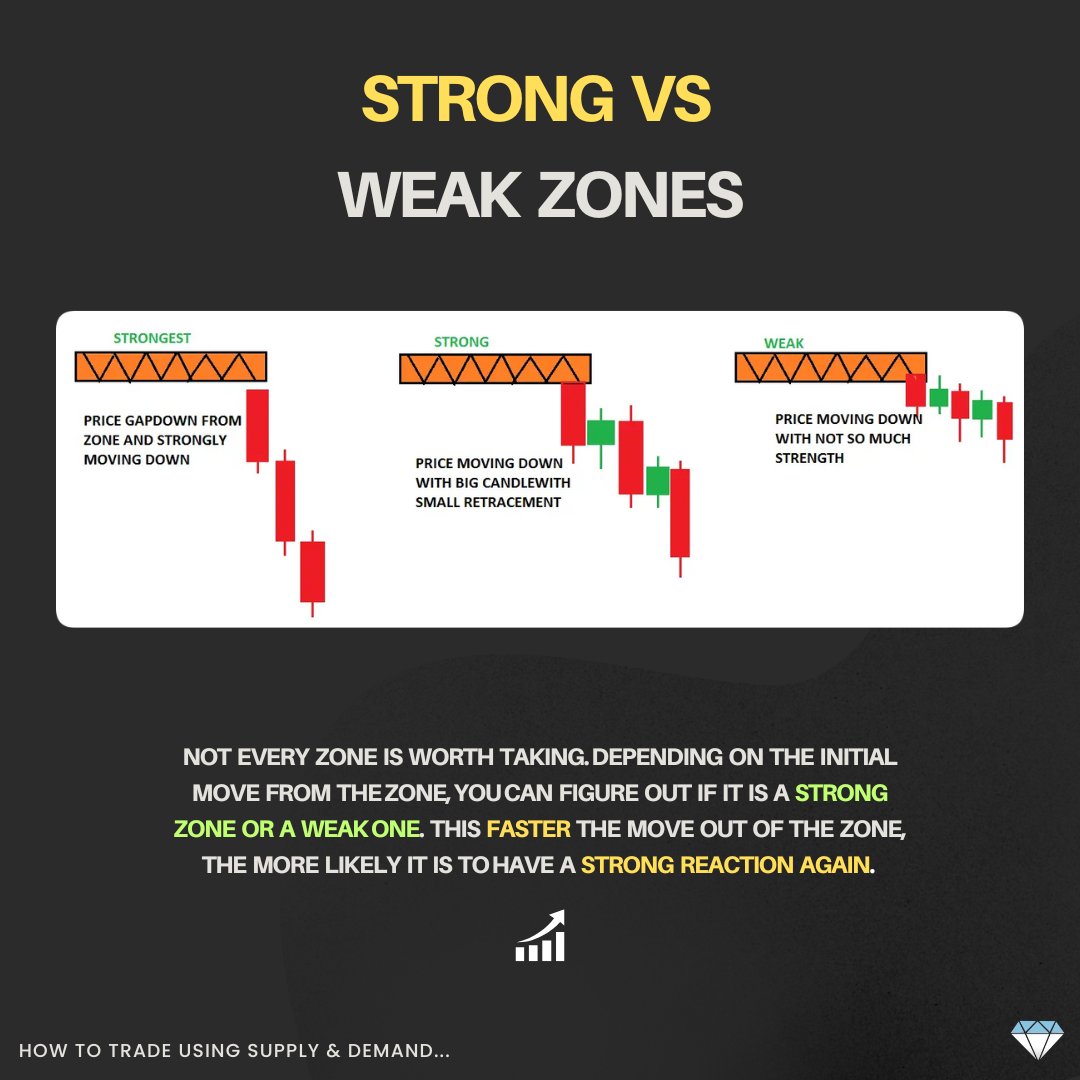
8) Strong VS Weak Zones Image
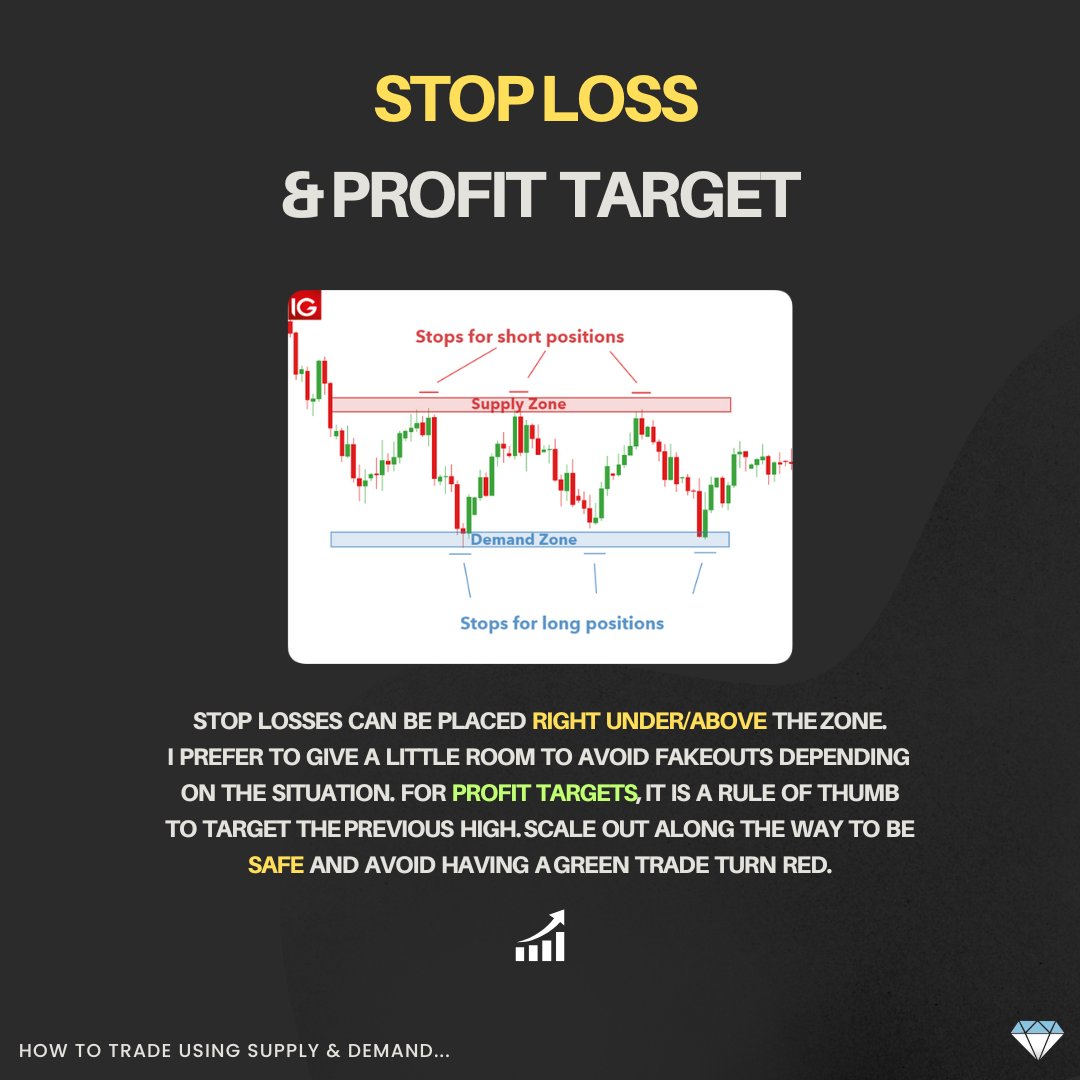
9) Stop Losses & Targets Image
10) If you enjoyed, make sure to Like & RT the first tweet ❀️

Also, make sure to join the FREE telegram for more tips, strategies, and trade recaps! πŸ‘‡

t.me/innercircleint

β€’ β€’ β€’

Missing some Tweet in this thread? You can try to force a refresh
γ€€

Keep Current with Mike Babayan

Mike Babayan Profile picture

Stay in touch and get notified when new unrolls are available from this author!

Read all threads

This Thread may be Removed Anytime!

PDF

Twitter may remove this content at anytime! Save it as PDF for later use!

Try unrolling a thread yourself!

how to unroll video
  1. Follow @ThreadReaderApp to mention us!

  2. From a Twitter thread mention us with a keyword "unroll"
@threadreaderapp unroll

Practice here first or read more on our help page!

More from @Nitro_Trades

Apr 27, 2025
After six years of trading...

The BOS + FVG is still the BEST Entry Model I've used

In this thread, I'll explain the full system from start to finish so you can copy my exact system Image
1) Break of structure

Break of structure is very simply, basically a breakout that confirms the trend

- Price takes out previous high, expect more upside
- Price takes out previous low, expect more downside

The break has to be strong, cant be a break and reversal Image
2) Finding levels

To find our BOS of levels, we do one of two things

1) Mark out PM Highs/Lows (4-9:30 AM EST)
2) Mark out High/Low of day from (9:30-10 AM EST)

Then we simply wait for a strong break of either one of those levels, up to you which you prefer to use Image
Read 9 tweets
Mar 3, 2025
You can make $1,000/day trading the same setup every day

I'm giving you guys my EXACT Model that you can copy and trade by yourself

Fully Explained in this thread from Start To FinishπŸ‘‡ Image
1. BOS + FVG Model Basic Overview
2. Break of structure Explained
Read 8 tweets
Jun 29, 2024
The ONLY Trading Models you need to become profitable

Study these well 🫑 Image
Model 1

- Liquidity Sweep
- Shift
- FVG Image
Model 2

PO3 (AMD)

- Accumulation
- Manipulation
- FVG + Distribution Image
Read 11 tweets
Jun 16, 2024
I turned $5K into $83K in 5 months

Here's the EXACT Setups I used to do it

Enjoy the free game in this thread, study it well πŸ‘‡ Image
1. Break + IFVG

- Price breaks below a pivot low and reverses back up
- Wait for it to invalidate a bearish fair value gap and enter or wait and enter on the retest
- Stop Loss below the zone, Target at the previous high

Best Time To Trade : 10 AM - 12 PM EST Image
2. Break + FVG Pullback

- Wait for price to break above a previous high
- Wait for a fair value gap to form (or if it's already formed under the high can play that too)
- Wait for a confirmation candle (wick, etc.)
- Enter

This works best in trending markets, so give the price action one hour to settle from the open before enteringImage
Read 6 tweets
Jul 5, 2022
πŸ“š5 best tips for growing a small account

Thread... πŸ‘‡
1. Good Risk To Reward Trades

The most important thing you want to do is take trades that have a positive Risk to Reward. This means your risk (stop loss) shouldn't be more than your reward (target). You shouldn't play breakouts with smaller accounts and instead focus on
Getting trades with clear defined risk. Supply and Demand techniques are one to look into.
Read 11 tweets
Feb 18, 2022
πŸ“šSUPPLY AND DEMAND FULL GUIDE πŸ“š

This is one of the most important techniques in trading/investing so do make sure to study it well.

Leave a like to save and retweet to spread the word ❀

Thread starts below... πŸ‘‡
1. What is Supply & Demand?

Supply & Demand is a way to determine where there is strong buying/selling.

Supply & Demand's show imbalances in trades and illustrate where we can expect to see another bounce or sell off from previous action.
1 continued...

It is pretty similar to a support and resistance level in that you are playing areas of buying/selling, but it includes a stronger sense of the moves and includes a wider range.

Here is a fairly simple way to understand Supply & Demand :

When there is a
Read 16 tweets

Did Thread Reader help you today?

Support us! We are indie developers!


This site is made by just two indie developers on a laptop doing marketing, support and development! Read more about the story.

Become a Premium Member ($3/month or $30/year) and get exclusive features!

Become Premium

Don't want to be a Premium member but still want to support us?

Make a small donation by buying us coffee ($5) or help with server cost ($10)

Donate via Paypal

Or Donate anonymously using crypto!

Ethereum

0xfe58350B80634f60Fa6Dc149a72b4DFbc17D341E copy

Bitcoin

3ATGMxNzCUFzxpMCHL5sWSt4DVtS8UqXpi copy

Thank you for your support!

Follow Us!

:(