1/9
COLD AGGLUTININ DISEASE (CAD)
Yesterday I posted CBCs from a patient, posed three questions and asked for a diagnosis.
Kudos to @EltonWandira for coming up with the answers and diagnosis within minutes of posting!
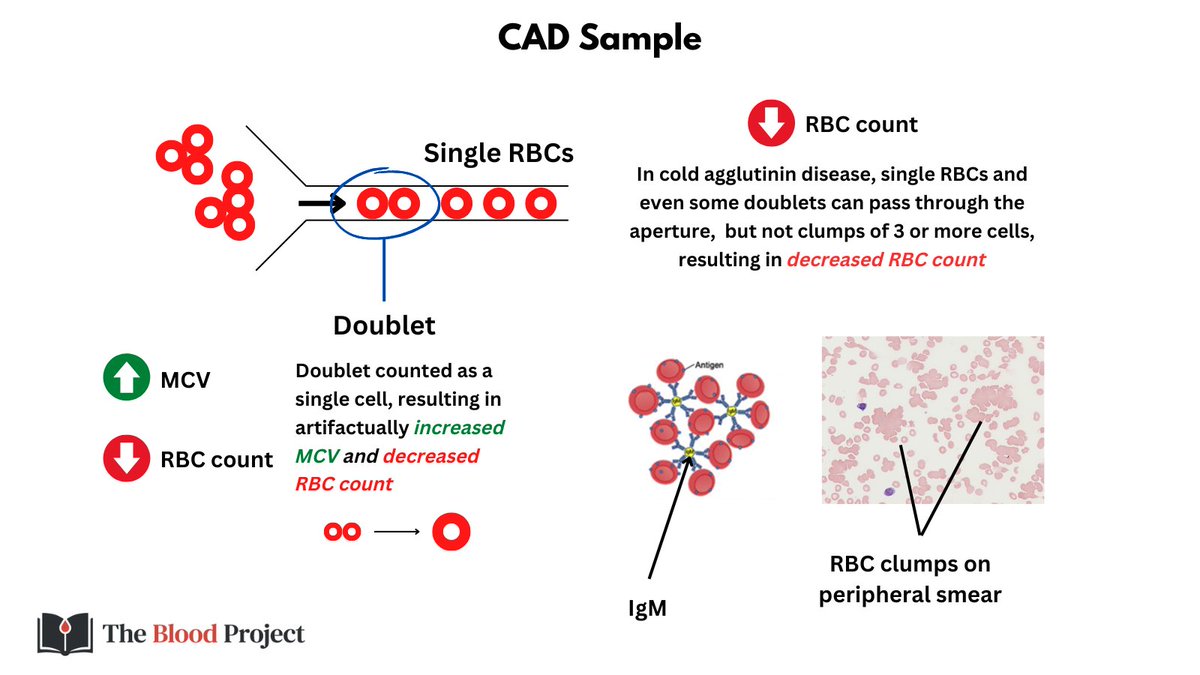
The dx is CAD.
COLD AGGLUTININ DISEASE (CAD)
Yesterday I posted CBCs from a patient, posed three questions and asked for a diagnosis.
Kudos to @EltonWandira for coming up with the answers and diagnosis within minutes of posting!
The dx is CAD.

2/9
Answers to questions:
Q1. Which value at time 0 is physiologically impossible?
A1. The MCHC of 65.4 g/dL. Hb is almost supersaturated under normal conditions, and rarely increases above 40 g/dL.
Answers to questions:
Q1. Which value at time 0 is physiologically impossible?
A1. The MCHC of 65.4 g/dL. Hb is almost supersaturated under normal conditions, and rarely increases above 40 g/dL.
3/9
Q2. What does the notation 4 refer to at time 0?
A2. Spun Hct. Note that the Hb is reported as 8.5 g/dL, the Hct as 26.5%. Recall that the MCHC = Hb/Hct, which in this case would = 32 g/dL, a far cry from the reported MCHC of 65.4 g/dL!
Q2. What does the notation 4 refer to at time 0?
A2. Spun Hct. Note that the Hb is reported as 8.5 g/dL, the Hct as 26.5%. Recall that the MCHC = Hb/Hct, which in this case would = 32 g/dL, a far cry from the reported MCHC of 65.4 g/dL!
4/9
Q3. What has the lab technician done to the blood to obtain 4 h results?
A3: They have warmed the blood to disassemble the cold agglutinins from the RBCs, converting clumps to single cells.
Q3. What has the lab technician done to the blood to obtain 4 h results?
A3: They have warmed the blood to disassemble the cold agglutinins from the RBCs, converting clumps to single cells.
5/9
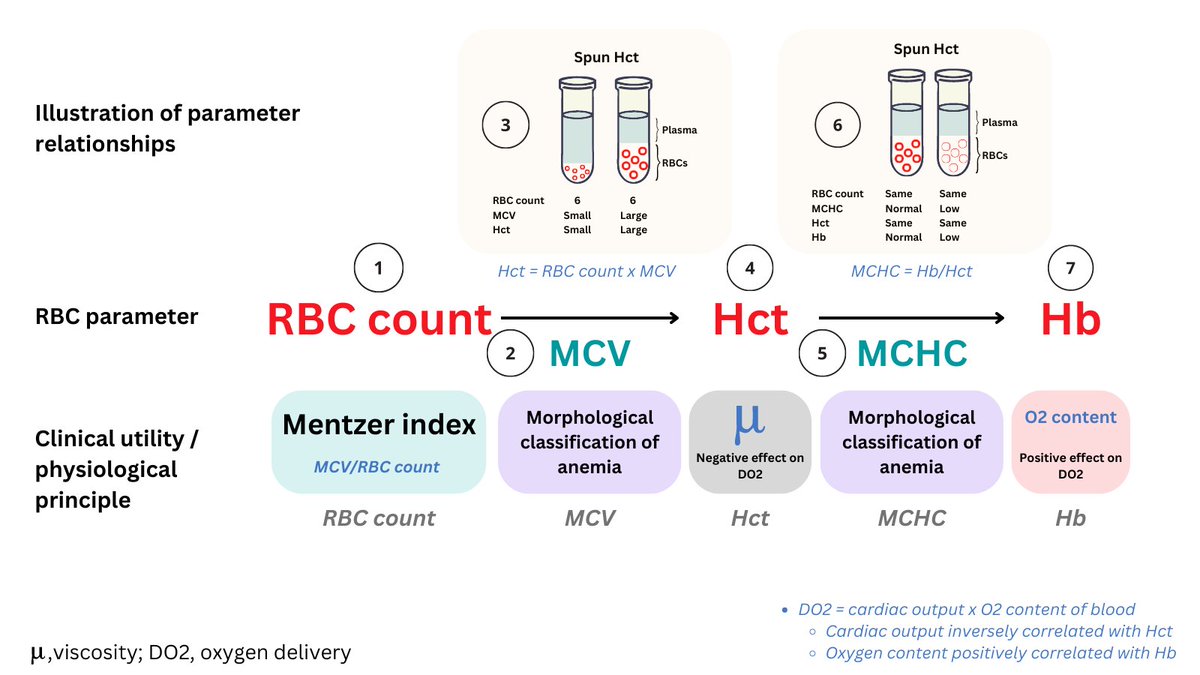
Instead of simply memorizing this pattern of CBC changes in CAD, let's think our way through it.
In automated hematology analyzers ('CBC machines'), RBCs normally pass in single file as their numbers are counted and their volume measured using the Coulter principle.
Instead of simply memorizing this pattern of CBC changes in CAD, let's think our way through it.
In automated hematology analyzers ('CBC machines'), RBCs normally pass in single file as their numbers are counted and their volume measured using the Coulter principle.

6/9
In CAD, clumps of 3 or more RBCs cannot squeeze through the aperture used for counting/sizing cells, so fewer cells get through, leading to falsely low RBC count. Doublets can pass through, but are counted as single cells, resulting in falsely high MCV and reduced RBC count.
In CAD, clumps of 3 or more RBCs cannot squeeze through the aperture used for counting/sizing cells, so fewer cells get through, leading to falsely low RBC count. Doublets can pass through, but are counted as single cells, resulting in falsely high MCV and reduced RBC count.
7/9
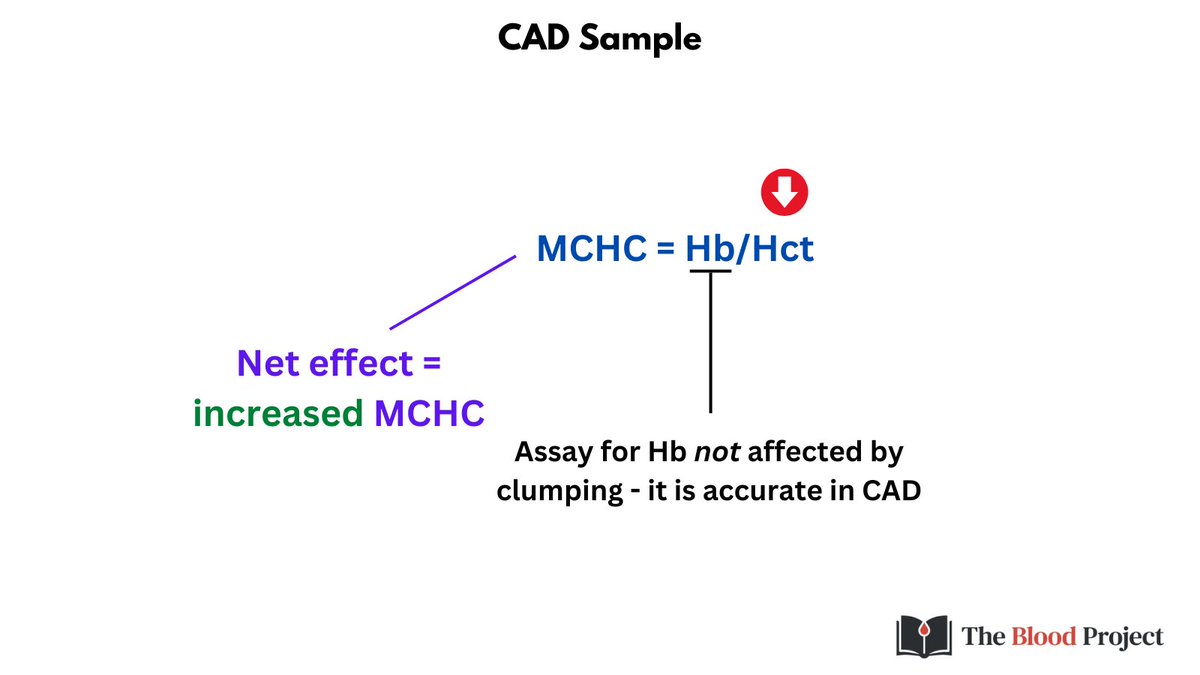
These artefactual changes can be incorporated in the equation Hct = RBC count x MCV. Because the RBC takes a double hit, it is disproportionately decreased relative to the change in MCV, resulting in a reduction in Hct.
These artefactual changes can be incorporated in the equation Hct = RBC count x MCV. Because the RBC takes a double hit, it is disproportionately decreased relative to the change in MCV, resulting in a reduction in Hct.

8/9
Finally because the Hct is falsely low (and the Hb is one of the few parameters unaffected in CAD), the MCHC is falsely elevated.
Finally because the Hct is falsely low (and the Hb is one of the few parameters unaffected in CAD), the MCHC is falsely elevated.
9/9
We can put it all together in table format with findings and explanations.
We can put it all together in table format with findings and explanations.

• • •
Missing some Tweet in this thread? You can try to
force a refresh