My Favorite Indicators and How I use them to Trade Every Day🧵
1. VWAP (Best Indicator IMO)
2. 9 EMA
3. Parabolic Sar
4. Volume Profile
This thread took a lot of time to make. I hope you guys enjoy! If you do make sure to❤️and follow me :), all engagement is appreciated.
1. VWAP (Best Indicator IMO)
2. 9 EMA
3. Parabolic Sar
4. Volume Profile
This thread took a lot of time to make. I hope you guys enjoy! If you do make sure to❤️and follow me :), all engagement is appreciated.
• VWAP
There are 4 different ways I like to play VWAP.
1. Close under VWAP
2. Close over VWAP
3. Bounce on VWAP
4. Rejection off VWAP
There are 4 different ways I like to play VWAP.
1. Close under VWAP
2. Close over VWAP
3. Bounce on VWAP
4. Rejection off VWAP

• VWAP
1. Close under VWAP.
A close under VWAP is when the candle goes from above VWAP to below it and closes a 5 min candle under it. When this happens I like to buy puts with a stoploss above VWAP.
1. Close under VWAP.
A close under VWAP is when the candle goes from above VWAP to below it and closes a 5 min candle under it. When this happens I like to buy puts with a stoploss above VWAP.

• VWAP
2. Close over VWAP.
A close over VWAP is when the stock is under VWAP but then closes above it. This is when I buy calls, with a stoploss under VWAP. I ALWAYS WAIT FOR CONFIRMATION WHICH IS A 5 MINUTE CLOSE OVER/UNDER the VWAP.
2. Close over VWAP.
A close over VWAP is when the stock is under VWAP but then closes above it. This is when I buy calls, with a stoploss under VWAP. I ALWAYS WAIT FOR CONFIRMATION WHICH IS A 5 MINUTE CLOSE OVER/UNDER the VWAP.

• VWAP
3. Bounce off VWAP.
This is when the stock is above VWAP and bounces off of it with continued strength. On green trend days you scalp the VWAP dips with calls.
3. Bounce off VWAP.
This is when the stock is above VWAP and bounces off of it with continued strength. On green trend days you scalp the VWAP dips with calls.

• VWAP
4. Rejection Off VWAP.
This is when the stock is under VWAP and retests it but gets rejected. On bearish days you want to scalp these pops with puts
4. Rejection Off VWAP.
This is when the stock is under VWAP and retests it but gets rejected. On bearish days you want to scalp these pops with puts

• Parabolic Sar
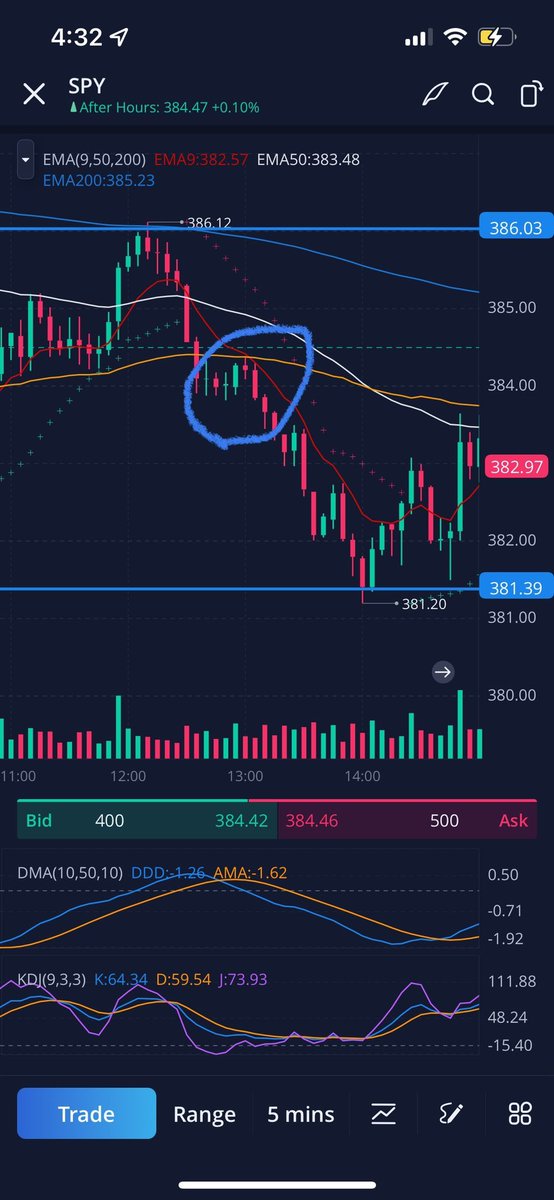
I scalp the Sar on the 5/10/20 min time frames! Buy when it goes under (green, and sell/short when it goes over, red). The Sar helps you to identify the intraday trends.
I scalp the Sar on the 5/10/20 min time frames! Buy when it goes under (green, and sell/short when it goes over, red). The Sar helps you to identify the intraday trends.
https://twitter.com/PBInvesting/status/1465861724364492809?s=20
• 9 EMA
I use the 9 EMA to identify when a stock is overextended and when to buy the dips on Green Day’s. When the stock is too overextended from the 9EMA on the five minute timeframe I sell and buy back when it touches.
I use the 9 EMA to identify when a stock is overextended and when to buy the dips on Green Day’s. When the stock is too overextended from the 9EMA on the five minute timeframe I sell and buy back when it touches.
https://twitter.com/PBInvesting/status/1484275561354649602?s=20
• Volume Profile
Volume profile helps me to identify key pivots while charting out stocks. It helps me to identify volume gaps, supply and demand, and so much more. The more volume blocks the harder it is going to be to move through that level.
Volume profile helps me to identify key pivots while charting out stocks. It helps me to identify volume gaps, supply and demand, and so much more. The more volume blocks the harder it is going to be to move through that level.

• Volume / Price action
Although these indicators are helpful, price action + volume are simply the most important concepts, and If you don’t know how to read them then you will not be able to trade. Indicators are just tools that can help.
Although these indicators are helpful, price action + volume are simply the most important concepts, and If you don’t know how to read them then you will not be able to trade. Indicators are just tools that can help.
I hope you guys enjoyed this thread! If you did make sure to LIKE + RT ❤️
Also Follow me with NOTIS on to learn more about trading⚡️
I also post a ton on IG! Check out my IG for exclusive trading content - instagram.com/pbinvesting/
Also Follow me with NOTIS on to learn more about trading⚡️
I also post a ton on IG! Check out my IG for exclusive trading content - instagram.com/pbinvesting/
• • •
Missing some Tweet in this thread? You can try to
force a refresh


