How To Do Proper Top-Down Analysis
A thread🧵
A thread🧵
1/
Top-Down Analysis is the foundational backbone of my trading strategy. By analyzing the higher timeframes down to the lower timeframes, it gives me a clear overall direction of the market and helps me set a bias for the day.
Top-Down Analysis is the foundational backbone of my trading strategy. By analyzing the higher timeframes down to the lower timeframes, it gives me a clear overall direction of the market and helps me set a bias for the day.
2/
But how do you perform proper top-down analysis and combine it to set a bias for the day? Well, in this short thread, I will cover all of it.
But how do you perform proper top-down analysis and combine it to set a bias for the day? Well, in this short thread, I will cover all of it.
3/
These are the timeframes I use for the top down analysis:
Weekly, Daily, H4 and H1. Some people start with the monthly timeframe, but I personally do not look at it, you can add it if you want to.
These are the timeframes I use for the top down analysis:
Weekly, Daily, H4 and H1. Some people start with the monthly timeframe, but I personally do not look at it, you can add it if you want to.
4/
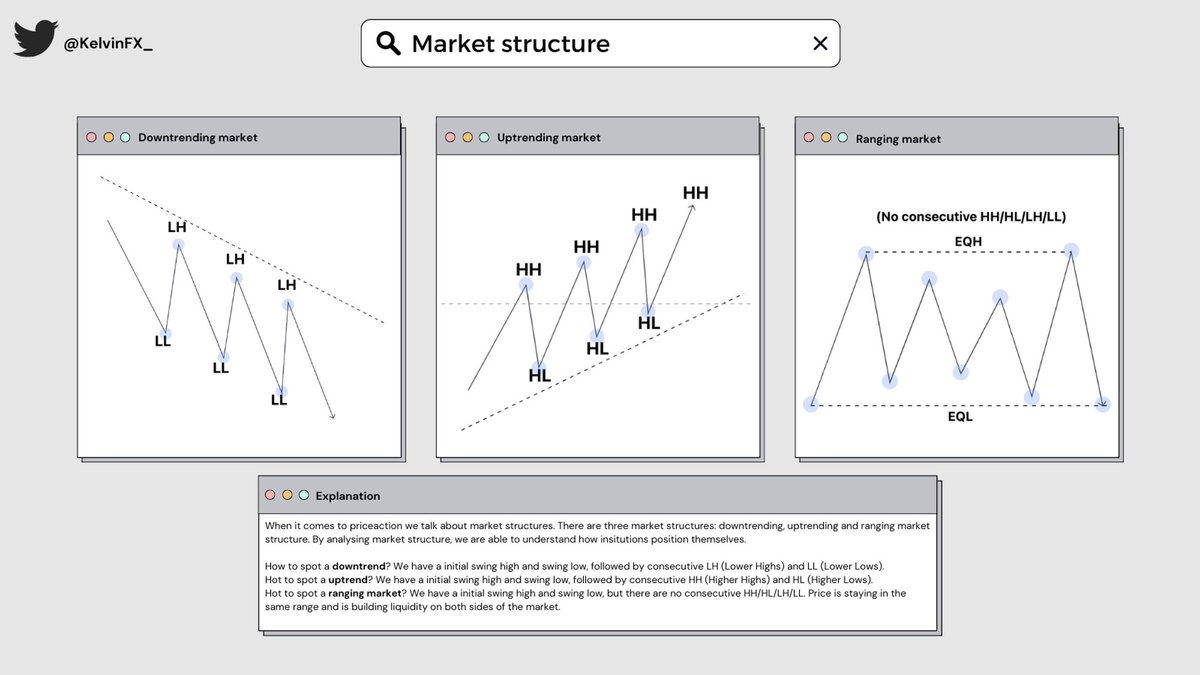
Step 1: Analyse The Market Structure
On all of these above mentioned timeframes, you want to analyse the structure first. Is the structure bullish or bearish? Refer to the attached picture if you do not know how to analyse the market structure.
Step 1: Analyse The Market Structure
On all of these above mentioned timeframes, you want to analyse the structure first. Is the structure bullish or bearish? Refer to the attached picture if you do not know how to analyse the market structure.
5/
You want to write it down on paper or in a excel sheet, whatever you want, as long as you have it in front of you.
Example:
Weekly - Bullish
Daily - Bullish
H4 - Bearish
H1 - Bullish
You want to write it down on paper or in a excel sheet, whatever you want, as long as you have it in front of you.
Example:
Weekly - Bullish
Daily - Bullish
H4 - Bearish
H1 - Bullish
6/
Step 2: Premium Or Discount?
In the second step you want to analyse where price is currently trading at, is it in premium or discount? If you don’t know what 'premium' and 'discount' mean, refer to the attached tweet. In this tweet, I explain what...
Step 2: Premium Or Discount?
In the second step you want to analyse where price is currently trading at, is it in premium or discount? If you don’t know what 'premium' and 'discount' mean, refer to the attached tweet. In this tweet, I explain what...
7/
...'premium' and 'discount' are and how to measure them. You should analyse this for all the timeframes I have mentioned above and write it down next to the structure.
...'premium' and 'discount' are and how to measure them. You should analyse this for all the timeframes I have mentioned above and write it down next to the structure.
https://twitter.com/KelvinFX_/status/1689921110479896576
8/
Example:
Weekly - Bullish - Discount
Daily - Bullish - Premium
H4 - Bearish - Premium
H1 - Bullish - Premium
Example:
Weekly - Bullish - Discount
Daily - Bullish - Premium
H4 - Bearish - Premium
H1 - Bullish - Premium
9/
Step 3: Additional Factor
Now that you have analysed the structure and where price is currently trading at, you want to look at areas in the market where price might want to trade. This can be in form of ineffiencies in priceaction, also refered as FVG, or...
Step 3: Additional Factor
Now that you have analysed the structure and where price is currently trading at, you want to look at areas in the market where price might want to trade. This can be in form of ineffiencies in priceaction, also refered as FVG, or...
10/
...some obvious liquidity areas in form of EQHs and EQLs. These are additional factors that contribute to finding a BIAS for the day. In the next step, I will explain how we are going to combine all of this together to determine which direction to trade.
...some obvious liquidity areas in form of EQHs and EQLs. These are additional factors that contribute to finding a BIAS for the day. In the next step, I will explain how we are going to combine all of this together to determine which direction to trade.
11/
Step 4: Put It All Together
Now that we have analysed the structure, premium and discount, as well as the areas in price action where it might want to trade, in the form of inefficiency and liquidity, we want to combine all this information together.
Step 4: Put It All Together
Now that we have analysed the structure, premium and discount, as well as the areas in price action where it might want to trade, in the form of inefficiency and liquidity, we want to combine all this information together.
12/
We will continue with the example that I have written above. On each specific timeframe, you want to write down which direction the market is more favorable for.
For this step I want you to keep this sentence in mind: Longs in discount and shorts in premium.
We will continue with the example that I have written above. On each specific timeframe, you want to write down which direction the market is more favorable for.
For this step I want you to keep this sentence in mind: Longs in discount and shorts in premium.
13/
Weekly - Bullish - Discount:
Structure is bullish and price is currently trading at discount, so for the weekly timeframe it is logical to look for longs.
Weekly - Bullish - Discount:
Structure is bullish and price is currently trading at discount, so for the weekly timeframe it is logical to look for longs.
14/
Daily - Bullish - Premium
Structure is bullish and is currently trading at a premium. You want to look for longs inside discount, so we can take shorts here into the discount area of the structure. For this timeframe, you want to look for shorts.
Daily - Bullish - Premium
Structure is bullish and is currently trading at a premium. You want to look for longs inside discount, so we can take shorts here into the discount area of the structure. For this timeframe, you want to look for shorts.
15/
H4 - Bearish - Premium
Structure is bearish and is currently trading at a premium. It is logical to look for shorts here.
H4 - Bearish - Premium
Structure is bearish and is currently trading at a premium. It is logical to look for shorts here.
16/
H1 - Bullish - Premium
Structure is bullish and is currently trading at a premium. You want to look for longs inside discount, we can take shorts here into the discount area of the structure, where we can look for longs again. For this timeframe, you want to look for shorts
H1 - Bullish - Premium
Structure is bullish and is currently trading at a premium. You want to look for longs inside discount, we can take shorts here into the discount area of the structure, where we can look for longs again. For this timeframe, you want to look for shorts
17/
Now that we have analyzed the trading direction for each specific timeframe, let's summarize our results.
Longs: 1
Shorts: 3
Now that we have analyzed the trading direction for each specific timeframe, let's summarize our results.
Longs: 1
Shorts: 3
18/
It's 3v1, so for any normally thinking person, it's logical to look for shorts for the day. You should repeat this process at the beginning of your trading day and monitor where price is trading throughout the day, as price can break structure on each timeframe...
It's 3v1, so for any normally thinking person, it's logical to look for shorts for the day. You should repeat this process at the beginning of your trading day and monitor where price is trading throughout the day, as price can break structure on each timeframe...
19/
...and move from premium to discount and vice versa. Keep this sheet up to date!
...and move from premium to discount and vice versa. Keep this sheet up to date!
20/
What should we do with the inefficiencies and the liquidity areas that we have analyzed?
You can use these confluences to enhance your trade direction and create a stronger directional bias. You can also use them as trouble areas for your trades.
What should we do with the inefficiencies and the liquidity areas that we have analyzed?
You can use these confluences to enhance your trade direction and create a stronger directional bias. You can also use them as trouble areas for your trades.
21/
For example:
You are in a short trade and price is heading into a weekly bullish FVG, or price is about to take out EQL on the daily timeframe, ideally, you would want to close the trade before that happens as there is a high likelihood that you will get a bullish reaction
For example:
You are in a short trade and price is heading into a weekly bullish FVG, or price is about to take out EQL on the daily timeframe, ideally, you would want to close the trade before that happens as there is a high likelihood that you will get a bullish reaction
22/
We have come to the end of this thread. Please test this approach out for yourself to see if it suits your current trading style. This is how I perform my top-down analysis to determine my bias for the day. However, this doesn’t mean that it's the only way to do it.
We have come to the end of this thread. Please test this approach out for yourself to see if it suits your current trading style. This is how I perform my top-down analysis to determine my bias for the day. However, this doesn’t mean that it's the only way to do it.
23/
hope that it was informative for you and that you have enjoyed this thread.
If you have any questions, please don’t hesitate to ask in the comments :)
Like and retweet are much appreciated ♥️
Cya on the next one!
hope that it was informative for you and that you have enjoyed this thread.
If you have any questions, please don’t hesitate to ask in the comments :)
Like and retweet are much appreciated ♥️
Cya on the next one!
6/
• • •
Missing some Tweet in this thread? You can try to
force a refresh