
Day 10: "MACD Crossover"
I'm sharing a simple backtest of trading strategies & ideas I find online for 30 days.
Today we go over a simple MACD crossover and analyze its historical performance.
Let's put the strategy to the test. Check it out below!

I'm sharing a simple backtest of trading strategies & ideas I find online for 30 days.
Today we go over a simple MACD crossover and analyze its historical performance.
Let's put the strategy to the test. Check it out below!


The MACD is an indicator commonly used for its trend identification properties.
The MACD is typically calculated by subtracting the 26 EMA from the 12 EMA.
A 9 EMA of the MACD, termed the "signal line," is then plotted on top of the MACD line, which acts as a trigger.
The MACD is typically calculated by subtracting the 26 EMA from the 12 EMA.
A 9 EMA of the MACD, termed the "signal line," is then plotted on top of the MACD line, which acts as a trigger.
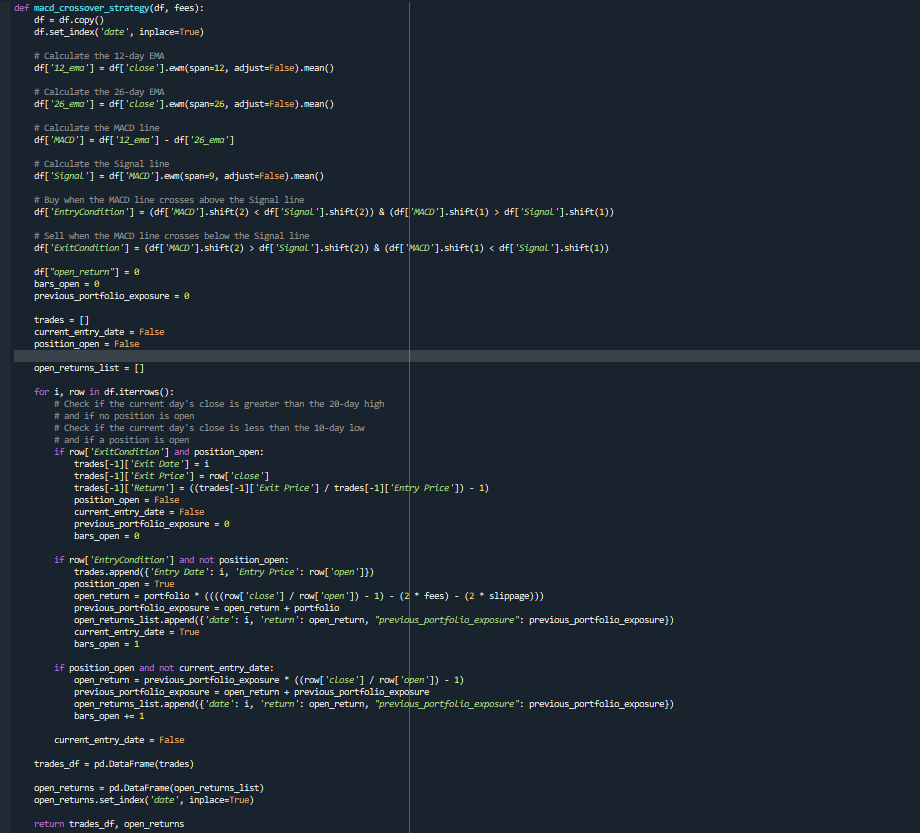
Strategy Rules:
Entry Rules:
1. MACD line is greater than the Signal line on the previous day, indicating a bullish crossover.
2. The MACD line is below the Signal line on the day before the previous day, ensuring that the crossover has just occurred.
Entry Rules:
1. MACD line is greater than the Signal line on the previous day, indicating a bullish crossover.
2. The MACD line is below the Signal line on the day before the previous day, ensuring that the crossover has just occurred.

Exit Rules:
1. The MACD line is below the Signal line on the previous day, indicating a bearish crossover.
2. The MACD line was above the Signal line on the day before the previous day, ensuring that the crossover has just occurred.
1. The MACD line is below the Signal line on the previous day, indicating a bearish crossover.
2. The MACD line was above the Signal line on the day before the previous day, ensuring that the crossover has just occurred.
Testing Assets:
- BTC/USD
- ETH/USD
- XRP/USD
- LTC/USD
- BCH/USD
Backtest Parameters:
- Timeframe: 1 Day
- Fees: 0.0004
- Slippage: 0.0002
Initial Portfolio Value: $10,000
Start Year: 2016
- BTC/USD
- ETH/USD
- XRP/USD
- LTC/USD
- BCH/USD
Backtest Parameters:
- Timeframe: 1 Day
- Fees: 0.0004
- Slippage: 0.0002
Initial Portfolio Value: $10,000
Start Year: 2016
This is the section where we get these rules into code.
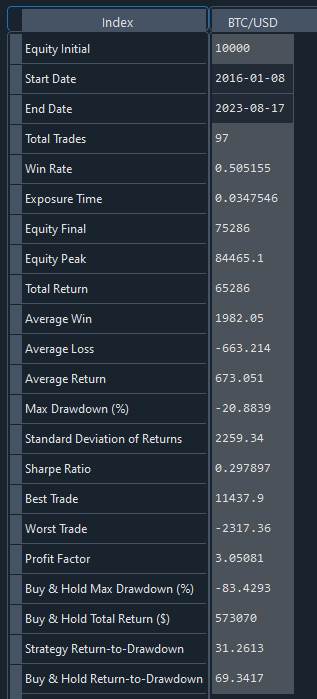
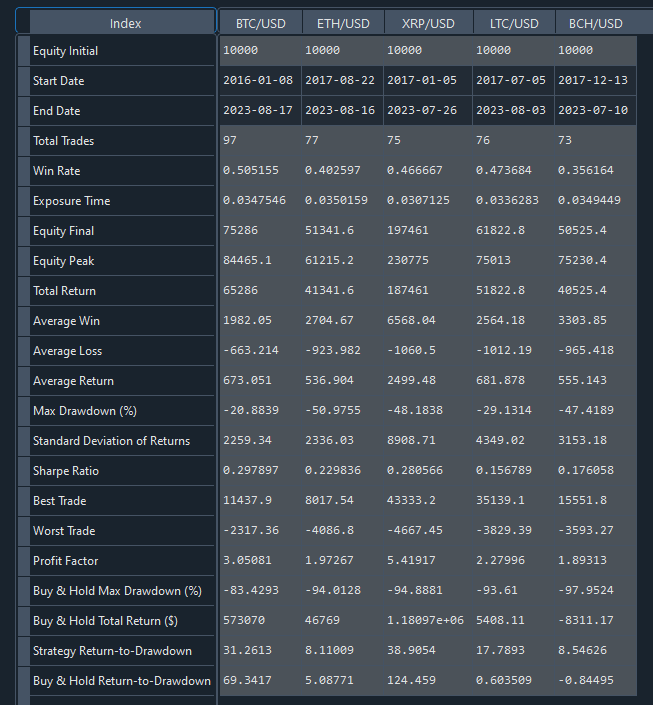
📊 BTC/USD Performance Metrics:
• Start: 2016-01-08
• End: 2023-08-17
• Equity Initial: $10,000
• Final: $75,285
• Equity Peak: $84,465
• Total Trades: 97
• Win Rate: 50.52%
• Exposure: 3.48%
• Return: $65,285
• Avg Win: $1,982
• Avg Loss: -$663
• Max DD: -20.88%
• Start: 2016-01-08
• End: 2023-08-17
• Equity Initial: $10,000
• Final: $75,285
• Equity Peak: $84,465
• Total Trades: 97
• Win Rate: 50.52%
• Exposure: 3.48%
• Return: $65,285
• Avg Win: $1,982
• Avg Loss: -$663
• Max DD: -20.88%
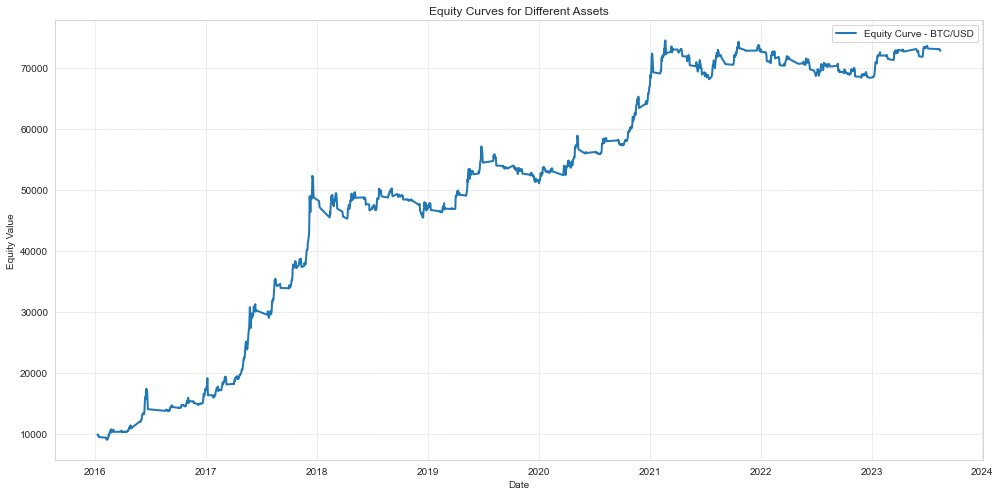
Being a trend following strategy, strength in the asset definitely correlates to better performance.
Drawdowns are heavily reduced as exposure in the markets are way less and more focused on strong regimes.
Drawdowns are heavily reduced as exposure in the markets are way less and more focused on strong regimes.
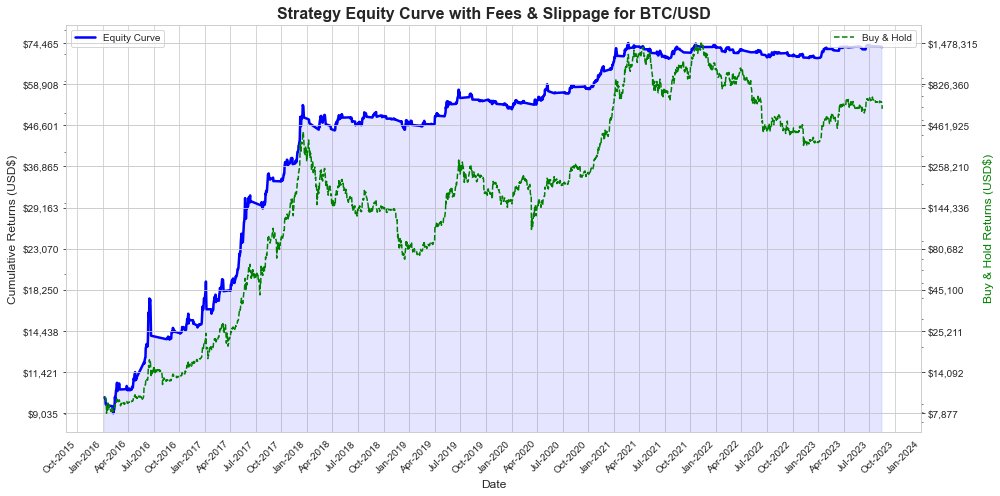
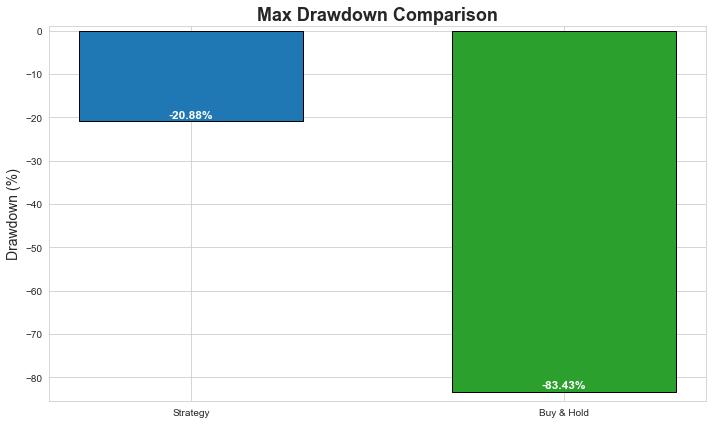
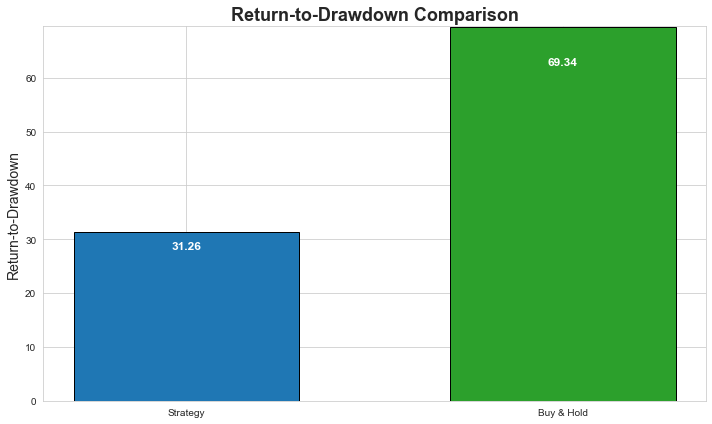
If we look at the return to drawdown ratio, we can see that is not that bad when we compare to buy and hold.
We decreased our drawdown by 75% and decreased our return to drawdown by around half.
It's a good indication of risk mitigation when comparing to simple buy and hold.
We decreased our drawdown by 75% and decreased our return to drawdown by around half.
It's a good indication of risk mitigation when comparing to simple buy and hold.
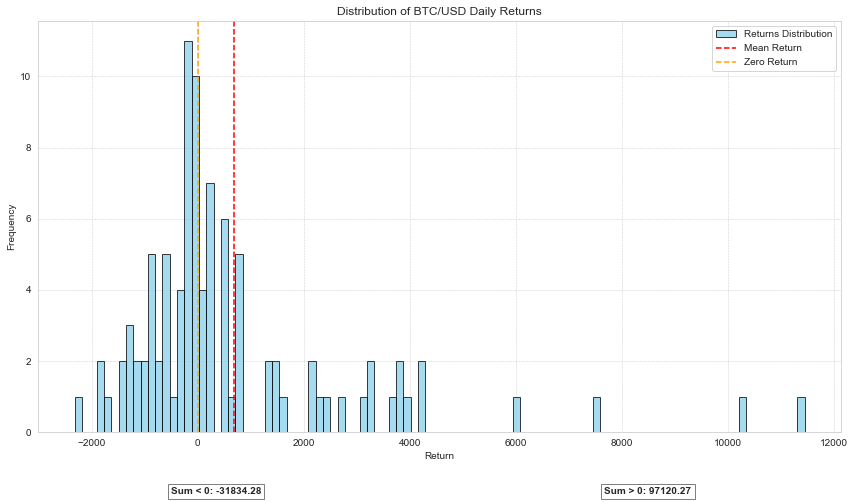
There's a skew to the right side of the axis as it is expected from trend following systems.
We can expect higher average returns and lower win rates because we are trying to take advantage of trends.
Predicting a trend is hard but if we bet enough times, eventually we get it.
We can expect higher average returns and lower win rates because we are trying to take advantage of trends.
Predicting a trend is hard but if we bet enough times, eventually we get it.
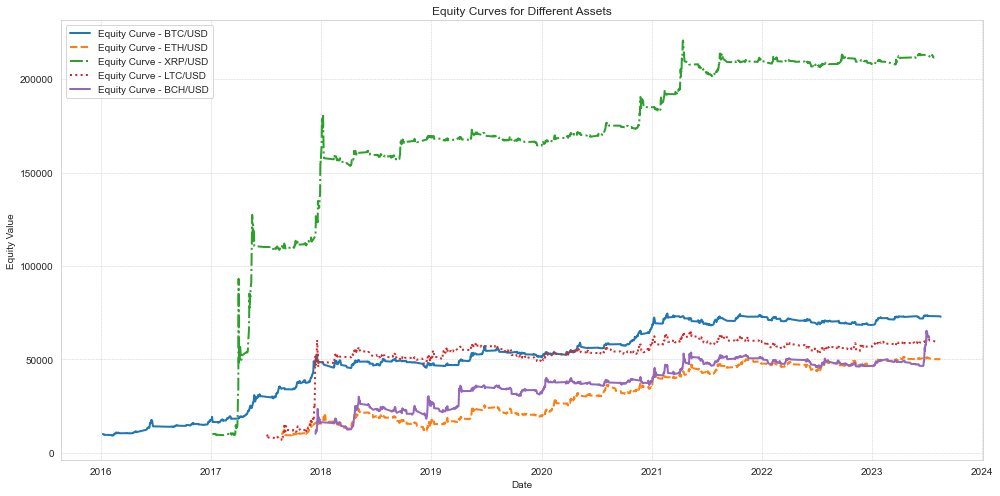
Now let's take a look at other correlated assets.
They all display some sort of resemblance and XRP showcasing outperformance.
This is because XRP has experienced extreme positive periods back in 2017 which helps in trend strategies.
They all display some sort of resemblance and XRP showcasing outperformance.
This is because XRP has experienced extreme positive periods back in 2017 which helps in trend strategies.
Now let's look at the same strategy but on traditional assets:
1) NASDAQ Composite
2) SPX
3) Amazon
4) Apple
1) NASDAQ Composite
2) SPX
3) Amazon
4) Apple
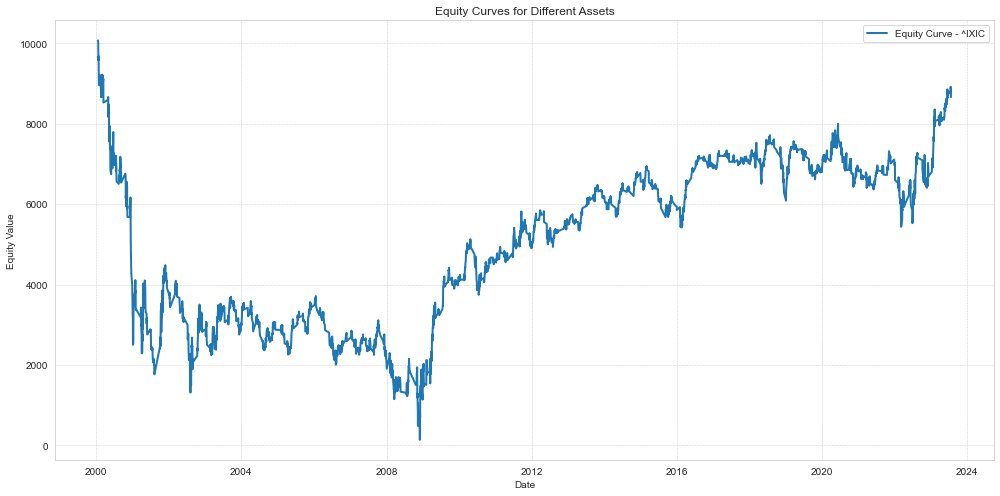
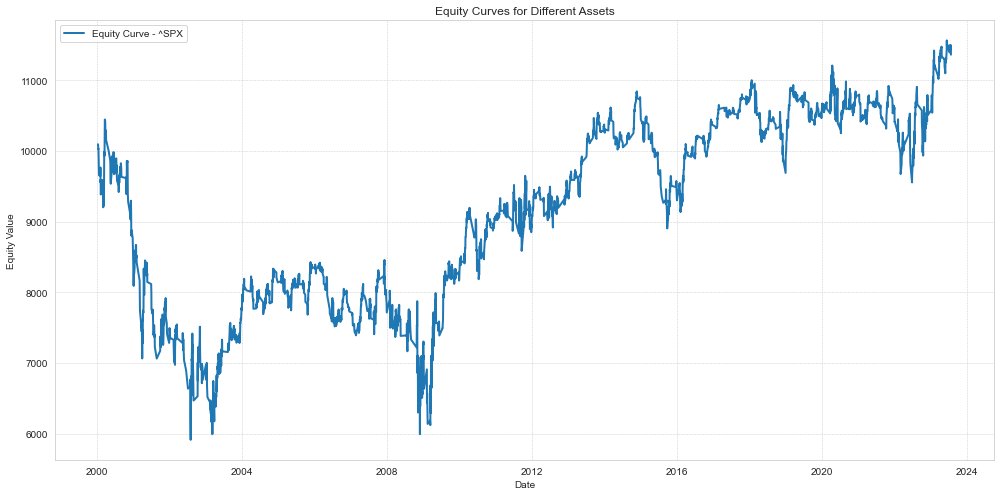
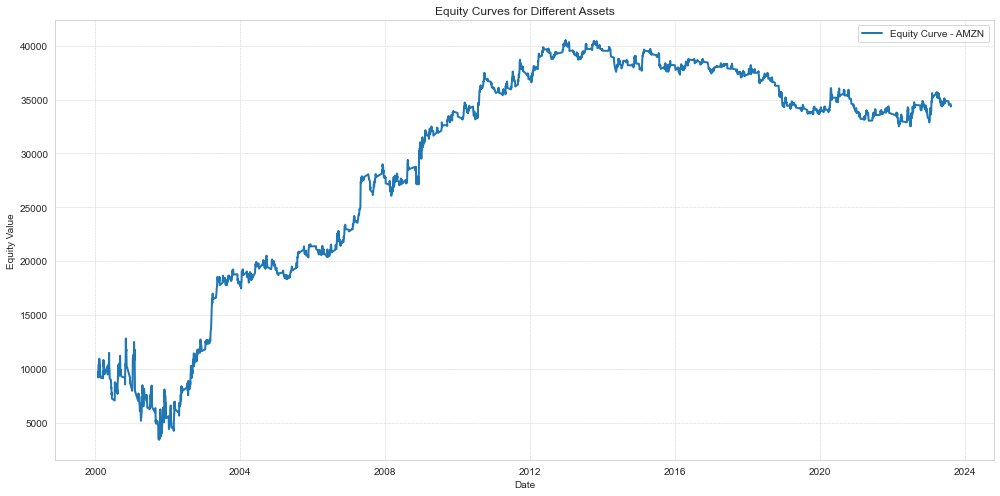
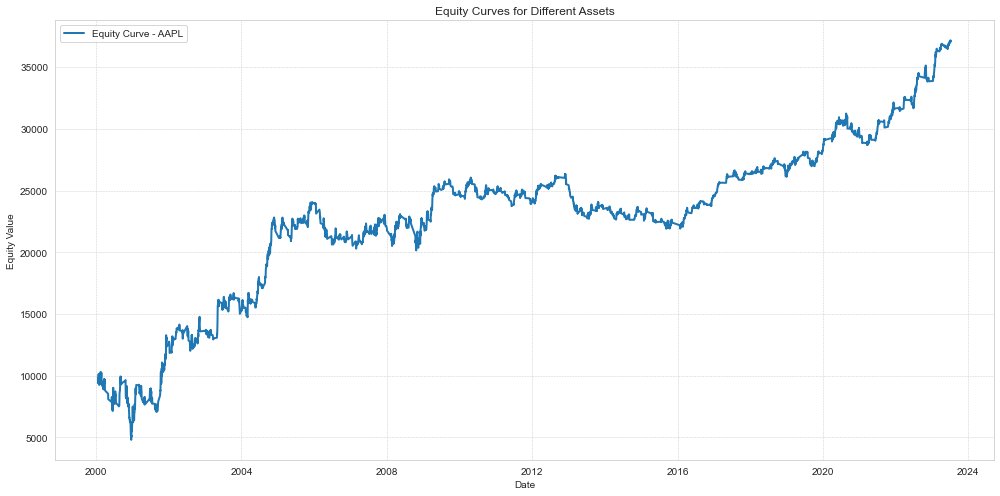
We can see that such a simple strategy is not optimal in traditional markets.
This is natural as this markets are more "mature" and require better strategic approach to make strategies work.
AAPL does display good returns to this day which is interesting.
This is natural as this markets are more "mature" and require better strategic approach to make strategies work.
AAPL does display good returns to this day which is interesting.
Now let's take a look of red flags with these assumptions:
1) The fees and slippage used for these tests might be misleading because we don't know how much real costs there were in the past. Also slippage is heavily influenced by liquidity and the size at the time of trades.
1) The fees and slippage used for these tests might be misleading because we don't know how much real costs there were in the past. Also slippage is heavily influenced by liquidity and the size at the time of trades.
2) Survivorship biases are not taken into consideration in these tests. For the sake of simplicity, I randomly picked assets that were available in Bitstamp, and used them for this simple testing.
A careful backtester will use all assets from those times, including the failures.
A careful backtester will use all assets from those times, including the failures.
3) We know that these things have gone up in the past and we don't know if they ever will again. This is an assumption we make and further thought into it might be wise.
Conclusion:
This is just meant as a test of a common indicator and how it has performed historically with over-simplified rules.
Optimization and a more strategic approach is required to make it robust and produce returns that are actually attractive.
Good luck!
This is just meant as a test of a common indicator and how it has performed historically with over-simplified rules.
Optimization and a more strategic approach is required to make it robust and produce returns that are actually attractive.
Good luck!
I hope you've found this thread helpful.
Follow me @pedma7 for more as I'll be sharing more backtests in the following weeks.
Like/Retweet the first tweet below if you can:
Follow me @pedma7 for more as I'll be sharing more backtests in the following weeks.
Like/Retweet the first tweet below if you can:
https://twitter.com/pedma7/status/1694318680732270825
• • •
Missing some Tweet in this thread? You can try to
force a refresh


