
A Complete Master Thread on Top 10 Candlestick Patterns that
Change My Swing Trading Setup Completely
Master Thread...
Change My Swing Trading Setup Completely
Master Thread...

1. Hammer:-
✅ The hammer candlestick pattern is formed of a short body with a long lower wick
✅ Found at the bottom of a downward trend
✅ A hammer shows there were selling pressures during the day & ultimately a strong buying pressure Come Back
✅ The hammer candlestick pattern is formed of a short body with a long lower wick
✅ Found at the bottom of a downward trend
✅ A hammer shows there were selling pressures during the day & ultimately a strong buying pressure Come Back

2. Inverse hammer:-
✅ A similarly bullish pattern is the inverted hammer
✅ The only difference is that the upper wick is long, while the lower wick is short
✅ The inverse hammer suggests that buyers will soon have control of the market
✅ A similarly bullish pattern is the inverted hammer
✅ The only difference is that the upper wick is long, while the lower wick is short
✅ The inverse hammer suggests that buyers will soon have control of the market
3. Bullish engulfing:-
✅ The bullish engulfing pattern is formed of two candlesticks
✅ The first candle is a short red body that is completely engulfed by a larger green candle
✅ This candlestick formation is a bullish signal
✅ The bullish engulfing pattern is formed of two candlesticks
✅ The first candle is a short red body that is completely engulfed by a larger green candle
✅ This candlestick formation is a bullish signal

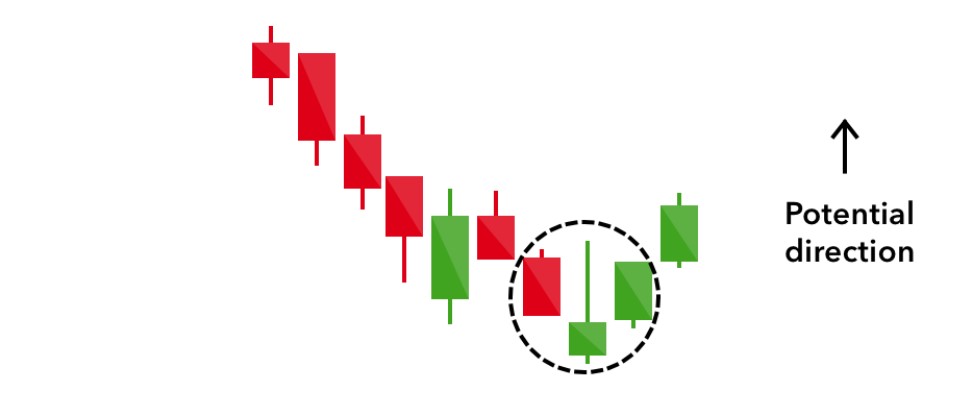
4. Morning star:-
✅ It is a three-stick pattern: one short-bodied candle between a long red and a long green
✅Traditionally, the ‘star’ will have no overlap with the longer bodies, as the market gaps both open and close
✅ It signals that a bull market is on the horizon
✅ It is a three-stick pattern: one short-bodied candle between a long red and a long green
✅Traditionally, the ‘star’ will have no overlap with the longer bodies, as the market gaps both open and close
✅ It signals that a bull market is on the horizon

5. Three White Soldiers:
✅The three white soldiers pattern occurs over three day
✅ It consists of consecutive long green candles with a small wick
✅Open and close progressively higher than the previous day & it's a very strong bullish signal that occurs after a downtrend
✅The three white soldiers pattern occurs over three day
✅ It consists of consecutive long green candles with a small wick
✅Open and close progressively higher than the previous day & it's a very strong bullish signal that occurs after a downtrend

6. Shooting Star:-
✅ The shooting star is the same shape as the inverted hammer but formed in an uptrend
✅ It has a small lower body and a long upper wick
✅ After an Uptrend, this is a very dangerous pattern that indicates downfall
✅ The shooting star is the same shape as the inverted hammer but formed in an uptrend
✅ It has a small lower body and a long upper wick
✅ After an Uptrend, this is a very dangerous pattern that indicates downfall

7. Hanging Man:-
✅ The hanging man is the bearish equivalent of a hammer
✅ It has the same shape but forms at the end of an uptrend
✅The large sell-off is often seen as an indication that the bulls are losing control of the market
✅ The hanging man is the bearish equivalent of a hammer
✅ It has the same shape but forms at the end of an uptrend
✅The large sell-off is often seen as an indication that the bulls are losing control of the market

8. Bearish Engulfing:-
✅ A bearish engulfing pattern occurs at the end of an uptrend
✅ The first candle has a small green body that is engulfed by a subsequent long red candle
✅ The lower the second candle goes, the more significant the trend is likely to be
✅ A bearish engulfing pattern occurs at the end of an uptrend
✅ The first candle has a small green body that is engulfed by a subsequent long red candle
✅ The lower the second candle goes, the more significant the trend is likely to be

9. Evening Star:-
✅ The evening star is a three-candlestick pattern that is the equivalent of the bullish morning star
✅ It is formed of a short candle sandwiched between a long green candle and a large red candlestick
✅ It indicates the reversal of an uptrend
✅ The evening star is a three-candlestick pattern that is the equivalent of the bullish morning star
✅ It is formed of a short candle sandwiched between a long green candle and a large red candlestick
✅ It indicates the reversal of an uptrend

10. Three Black Crows:-
✅ The three black crows candlestick pattern comprises three consecutive long red candles with short or non-existent wicks
✅ Each session opens at a similar price to the previous day, but selling pressures push the price lower and lower
✅ The three black crows candlestick pattern comprises three consecutive long red candles with short or non-existent wicks
✅ Each session opens at a similar price to the previous day, but selling pressures push the price lower and lower

Follow Our Free Telegram Group For
✅ Trading Day Intraday Chart
✅ Weekend Swing Trading Chart
✅ 1% Weekly Income Trades Continuously 16 Trades Profitable
✅ Weekly Positional Option Trades
✅ Nifty, BankNifty & Stocks S&R Levels
Join II t.me/MohitShrama
✅ Trading Day Intraday Chart
✅ Weekend Swing Trading Chart
✅ 1% Weekly Income Trades Continuously 16 Trades Profitable
✅ Weekly Positional Option Trades
✅ Nifty, BankNifty & Stocks S&R Levels
Join II t.me/MohitShrama
• • •
Missing some Tweet in this thread? You can try to
force a refresh


