Everyone dreams of buying a STOCK at the BOTTOM and sell it at the TOP to get MAX PROFIT.
It looks IMPOSSIBLE, but it can be done using RSI Divergence Strategy.
A detailed thread🧵 on how to use RSI Divergence Strategy in Stock Trading:
It looks IMPOSSIBLE, but it can be done using RSI Divergence Strategy.
A detailed thread🧵 on how to use RSI Divergence Strategy in Stock Trading:
We will split this thread into five parts:
• Basics of RSI Indicator
• What is RSI Divergence
• How to incorporate RSI Divergences in your Trading (Daily/Weekly Time Frame)
• Free Tradingview Indicator
• Free RSI Divergence Screener Link to simplify your analysis
• Basics of RSI Indicator
• What is RSI Divergence
• How to incorporate RSI Divergences in your Trading (Daily/Weekly Time Frame)
• Free Tradingview Indicator
• Free RSI Divergence Screener Link to simplify your analysis
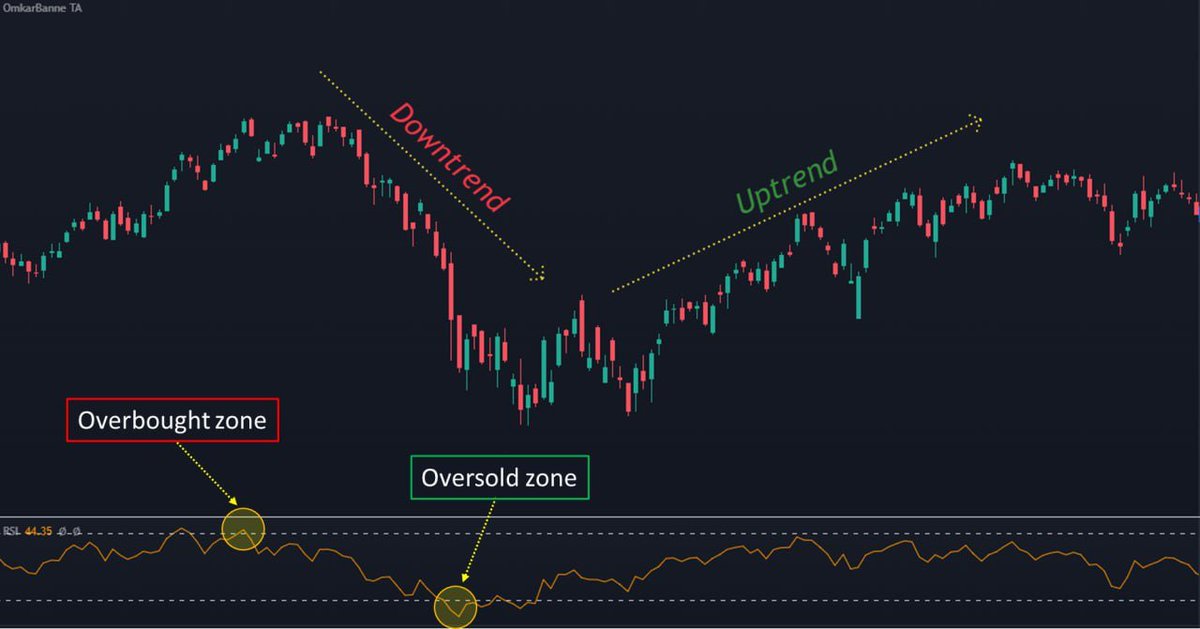
1/ Basics of RSI Indicator:
The Relative Strength Index (RSI) is a momentum indicator used in technical analysis. It provides traders with signals about bullish and bearish price momentum.
It is very common indicator and is available on the Broker Platform and Tradingview
The Relative Strength Index (RSI) is a momentum indicator used in technical analysis. It provides traders with signals about bullish and bearish price momentum.
It is very common indicator and is available on the Broker Platform and Tradingview
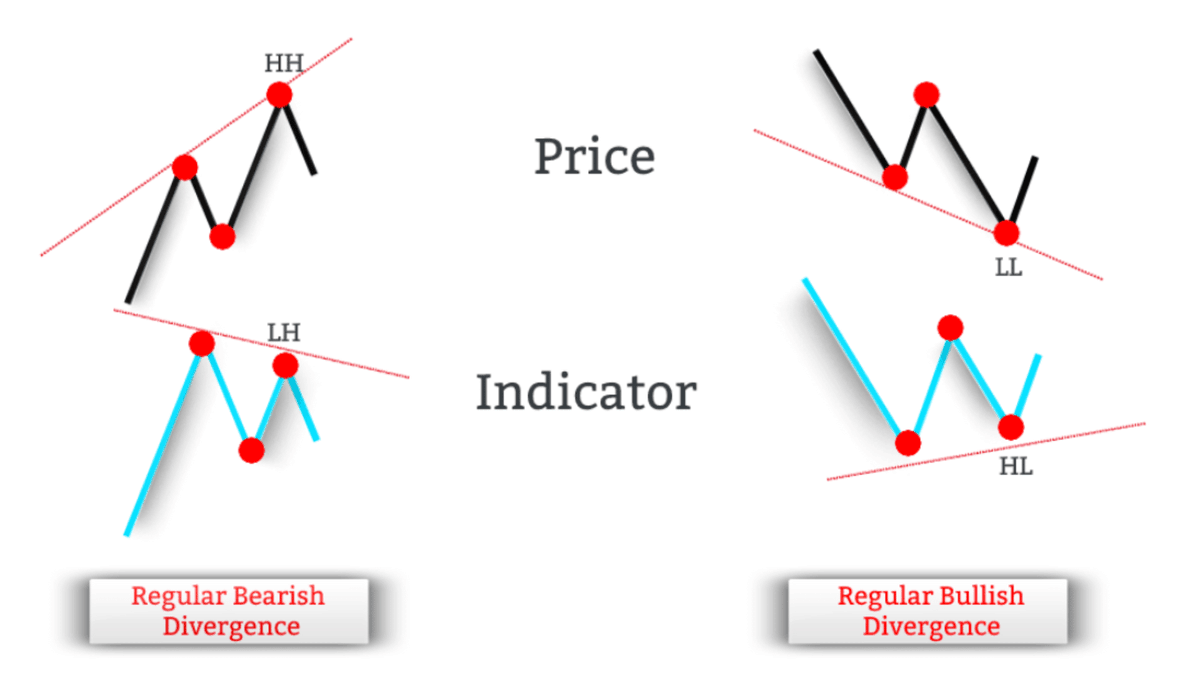
2/ What is RSI Divergence?
It is one of the best setups for finding out reversal stocks that are near the bottom or near the top. Based on this, a trader can buy and sell a stock at right time and can ride the momentum in the stock.
It is one of the best setups for finding out reversal stocks that are near the bottom or near the top. Based on this, a trader can buy and sell a stock at right time and can ride the momentum in the stock.
There are two types of Regular RSI Divergence:
• Bullish Divergence
• Bearish Divergence
Now we will dig into both these Divergences and understand what Bullish and Bearish Divergence are and how it helps traders to catch the near Top and Bottom in any stocks.
• Bullish Divergence
• Bearish Divergence
Now we will dig into both these Divergences and understand what Bullish and Bearish Divergence are and how it helps traders to catch the near Top and Bottom in any stocks.
• Bullish Divergence/
In Bullish Divergence, the price forms lower lows but RSI is forming higher lows as seen in the below image.
This means that Bearish/Downside momentum in the stock is fading out and the price is about to reverse on the upside.
In Bullish Divergence, the price forms lower lows but RSI is forming higher lows as seen in the below image.
This means that Bearish/Downside momentum in the stock is fading out and the price is about to reverse on the upside.
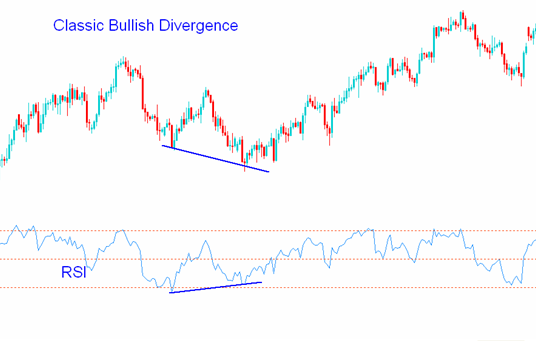
For Bullish Divergence, there are some prerequisites for confirmation, such as:
⚡️ Price Should Form Lower Lows
⚡️ RSI Should Form Higher Lows
⚡️ Atleast one RSI Low should be in the Oversold Region (RSI Below 30)
⚡️ RSI should reverse (upward sloping) after the second point
⚡️ Price Should Form Lower Lows
⚡️ RSI Should Form Higher Lows
⚡️ Atleast one RSI Low should be in the Oversold Region (RSI Below 30)
⚡️ RSI should reverse (upward sloping) after the second point
How to Trade Bullish Divergence?
⚡️ Identify RSI Bullish Divergence
⚡️ Mark the High of the Candle where there is a confirmation of Bullish Divergence (most likely it will be a bullish candle)
⚡️ Buy if subsequent candles cross the high of the Divergence candle
⚡️ Identify RSI Bullish Divergence
⚡️ Mark the High of the Candle where there is a confirmation of Bullish Divergence (most likely it will be a bullish candle)
⚡️ Buy if subsequent candles cross the high of the Divergence candle
⚡️ Keep Stoploss as the nearest Swing Low (CLB)
⚡️ Keep a Target of at least 1:2 or 1:3 Risk:Reward. If the Risk at Stoploss is 5% then keep the target of at least 3-6%. Anything above this is good or can trail Stoploss also, whichever is appropriate
⚡️ Exit if Stoploss is hit
⚡️ Keep a Target of at least 1:2 or 1:3 Risk:Reward. If the Risk at Stoploss is 5% then keep the target of at least 3-6%. Anything above this is good or can trail Stoploss also, whichever is appropriate
⚡️ Exit if Stoploss is hit
Let's see some Bullish Divergence examples:
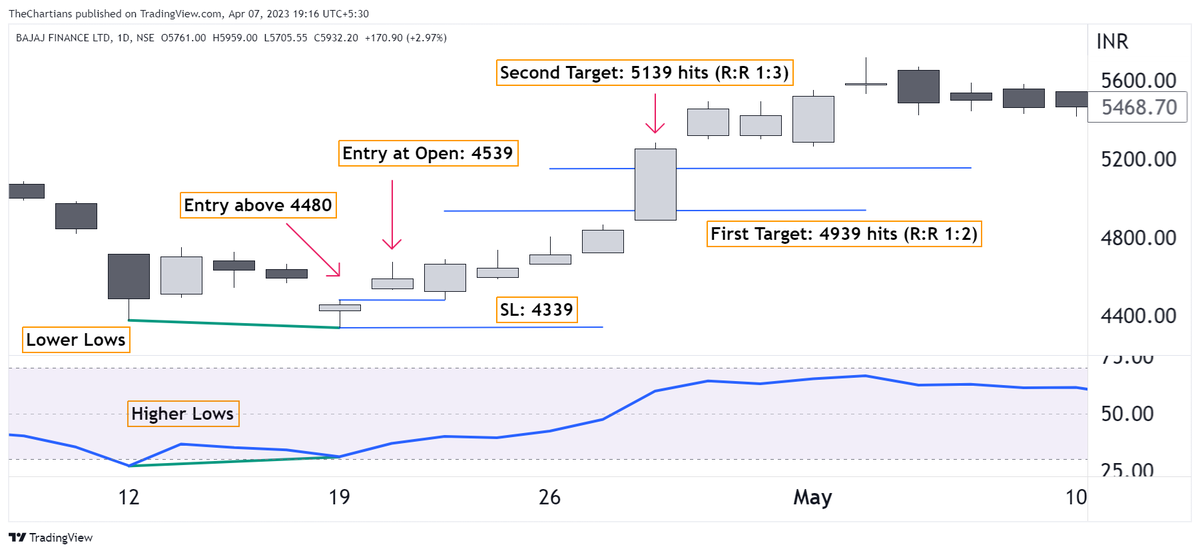
#BajFinance formed a Bullish Divergence on 19th April 2021.
The next candle opened directly above the Divergence candle's high and we entered the opening.
Buying Price: 4539
SL: 4339
Target: 4939/5139 which got hit on 28th April 2021.
#BajFinance formed a Bullish Divergence on 19th April 2021.
The next candle opened directly above the Divergence candle's high and we entered the opening.
Buying Price: 4539
SL: 4339
Target: 4939/5139 which got hit on 28th April 2021.
• Bearish Divergence/
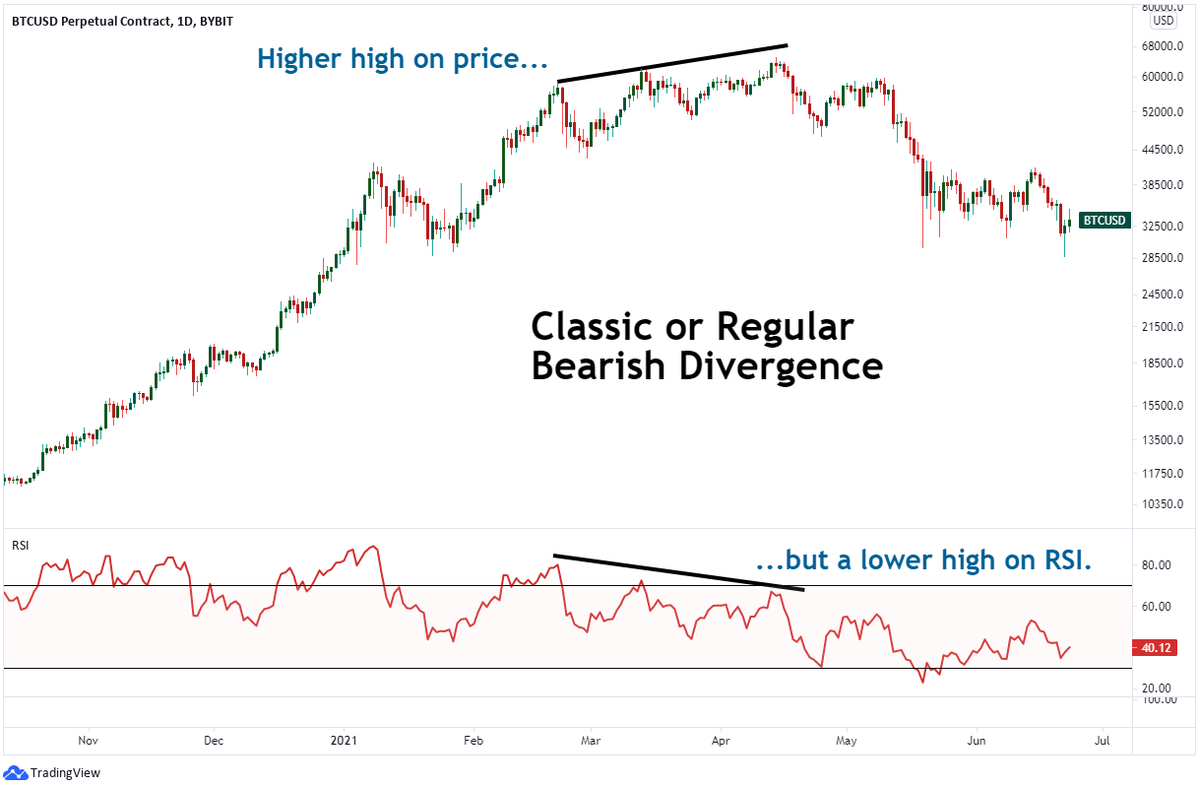
In Bearish Divergence, the price forms higher highs but RSI is forming Lower Highs as seen in the below image.
This means that the Bullish/Upside momentum in the stock is fading out and the price is about to reverse on the downside.
In Bearish Divergence, the price forms higher highs but RSI is forming Lower Highs as seen in the below image.
This means that the Bullish/Upside momentum in the stock is fading out and the price is about to reverse on the downside.
For Bearish Divergence, there are some prerequisites for confirmation such as:
⚡️ Price Should Form Higher Highs
⚡️ RSI Should Form Lower Highs
⚡️ Atleast one RSI High should be in the Overbought Region (RSI Above 70)
⚡️ RSI should reverse (downward sloping)
⚡️ Price Should Form Higher Highs
⚡️ RSI Should Form Lower Highs
⚡️ Atleast one RSI High should be in the Overbought Region (RSI Above 70)
⚡️ RSI should reverse (downward sloping)
How to Trade Bearish Divergence?
⚡️ Identify RSI Bearish Divergence
⚡️ Mark the Lows of the Candle where there is a confirmation of Bearish Divergence (most likely it will be a bearish candle)
⚡️ Sell if subsequent candles cross the below the low of the Divergence candle
⚡️ Identify RSI Bearish Divergence
⚡️ Mark the Lows of the Candle where there is a confirmation of Bearish Divergence (most likely it will be a bearish candle)
⚡️ Sell if subsequent candles cross the below the low of the Divergence candle
⚡️ Keep Stoploss as the nearest Swing High (CLB)
⚡️ Keep a Target of at least 1:2 or 1:3 Risk:Reward. If the Risk at Stoploss is 5% then keep the target of at least 3-6%. Anything above this is good or can trail Stoploss also whichever is appropriate
⚡️ Exit if Stoploss is hit
⚡️ Keep a Target of at least 1:2 or 1:3 Risk:Reward. If the Risk at Stoploss is 5% then keep the target of at least 3-6%. Anything above this is good or can trail Stoploss also whichever is appropriate
⚡️ Exit if Stoploss is hit
Since you can't sell any stocks directly in Indian Stock Market. For selling you will have to select Derivatives products like Futures or Options of that particular stock. Trading in this involves high risk as it is a leveraged instrument.
We would suggest that looking at Bearish Divergence, if you are holding any stocks then you can exit that particular stock for a certain time period and protect your capital in that case.
You can reenter that stock once your target is hit on the downside.
You can reenter that stock once your target is hit on the downside.
Let's see some Bearish Divergence examples:
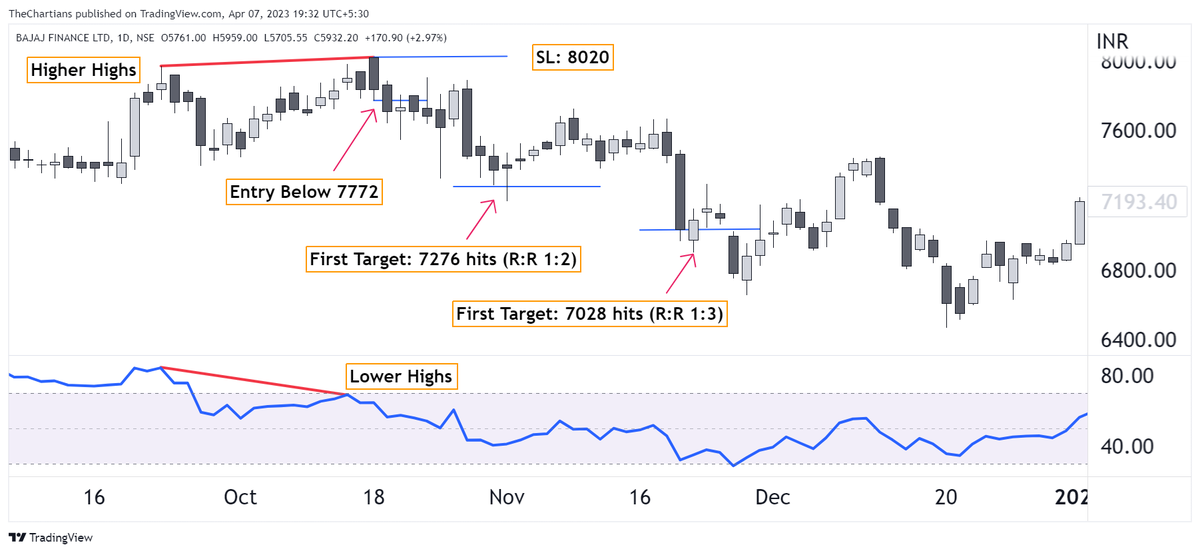
#BajFinance formed a Bearish Divergence on 18th Oct 2021.
The next candle crossed below the Divergence candle's low and we entered the opening.
Selling Price: 7772
SL: 8020
Target: 7276/7028 which got hit on 22nd Nov 2021.
#BajFinance formed a Bearish Divergence on 18th Oct 2021.
The next candle crossed below the Divergence candle's low and we entered the opening.
Selling Price: 7772
SL: 8020
Target: 7276/7028 which got hit on 22nd Nov 2021.
Some Guidelines to use Bullish and Bearish RSI Divergences:
⚡️ Use Divergence on the minimum time frame of Daily and Max at weekly.
⚡️ Your Risk in any trade will be relatively less as it is a reversal trading setup
⚡️ Follow Stoploss and Target always
⚡️ Use Divergence on the minimum time frame of Daily and Max at weekly.
⚡️ Your Risk in any trade will be relatively less as it is a reversal trading setup
⚡️ Follow Stoploss and Target always
Isn't this setup quite easy to practice and follow?
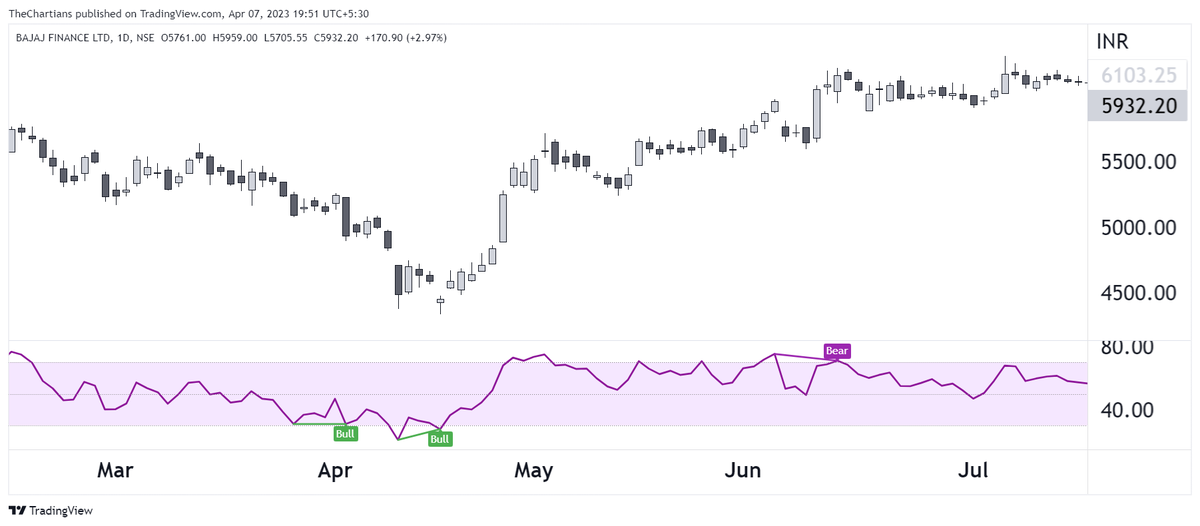
Let's make it simpler as we will be sharing a FREE Tradingview to plot such Divergences automatically on your charts.
Indicator Link:
It is similar to what manual plotting we were doing on the charts.tradingview.com/script/qSLcZSy…
Let's make it simpler as we will be sharing a FREE Tradingview to plot such Divergences automatically on your charts.
Indicator Link:
It is similar to what manual plotting we were doing on the charts.tradingview.com/script/qSLcZSy…
You can add this indicator in Favorites and add it to the charts also.
If you are searching with charts then search for the following indicator.
The indicator will just plot Divergences, Entry, Stoplosses, and Target needs to be decided by you.
If you are searching with charts then search for the following indicator.
The indicator will just plot Divergences, Entry, Stoplosses, and Target needs to be decided by you.

Now there are 1000+ listed stocks that have good liquidity so which stocks to track out of these?
There is a screener also that you can use to track stock names that have Bullish or Bearish Divergence on a Daily Basis.
There is a screener also that you can use to track stock names that have Bullish or Bearish Divergence on a Daily Basis.
Below are the screener links for both and are created by me.
Bullish Divergence:
Bearish Divergence: chartink.com/screener/bulli…
chartink.com/screener/beari…
Bullish Divergence:
Bearish Divergence: chartink.com/screener/bulli…
chartink.com/screener/beari…
Note: Above screeners will just help in getting the name of the stocks from the list of the universe. It's your responsibility to take confirmation from the chart once and plan your entry, stoploss, and target in the stock trades that you are taking.
Also, an indicator is always used as an additional context and price will always lead.
This learning thread is for you guys so that if in future you want to trade on RSI this thread can help.
This learning thread is for you guys so that if in future you want to trade on RSI this thread can help.
This is all about the Basics of RSI Divergences and How to Trade Based on these Strategies.
If you found this useful, please RT the first tweet.
For live trading and stock market related updates, you can join our Telegram Channel⤵️
telegram.me/finquity
If you found this useful, please RT the first tweet.
For live trading and stock market related updates, you can join our Telegram Channel⤵️
telegram.me/finquity
• • •
Missing some Tweet in this thread? You can try to
force a refresh