The freight market bottomed on May 14th. Since then conditions have continued to improve.
The outbound tender rejection index (OTRI) measures the balance of supply/demand in trucking, by measuring the % of truckloads that are rejected.
This data comes from the "tender" messages between shippers and motor carriers. Tender messages are requests for trucks in the contract freight market.
A rejection tells us that a carrier is telling a shipper that they have other options for their trucks.
Higher rejection rates mean that the balance of supply/demand is swinging in favor of trucking fleets.

Tender rejections are also signaling a stronger YoY quarter for motor carriers. Tender rejections are on pace to surpass last year's number and should do so by the end of Q3.
2/
2/

Tender rejections are also signaling that the current market is similar to 2019.
(Orange in this chart is 2019) 3/
(Orange in this chart is 2019) 3/

Who wins?
The Waterfall Theory of Freight suggests the largest carriers are the last to see a slowdown and the first to see the market come back.
The Waterfall Theory of Freight is the foundational theory that tender rejection data is designed to monitor. 4/
The Waterfall Theory of Freight suggests the largest carriers are the last to see a slowdown and the first to see the market come back.
The Waterfall Theory of Freight is the foundational theory that tender rejection data is designed to monitor. 4/
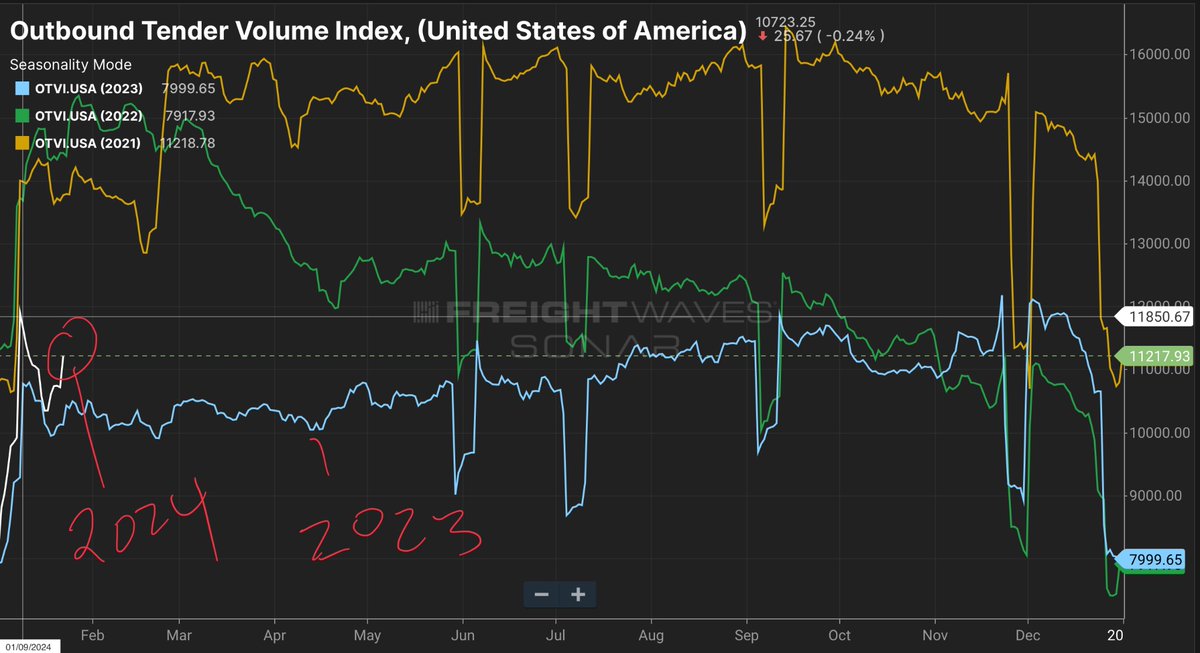
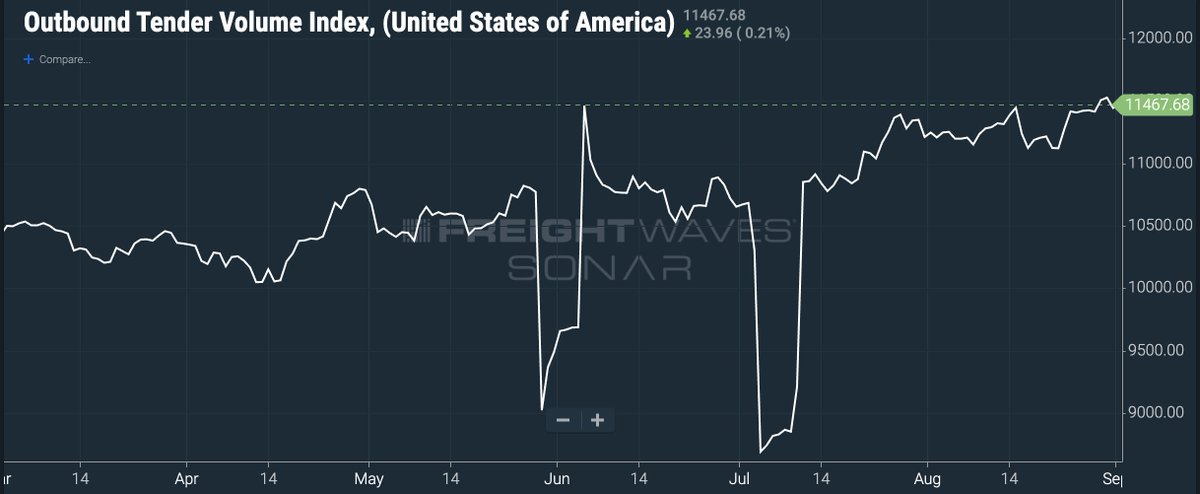
Volumes have continued to strengthen throughout the year. This suggests that the trucking market could see a decent peak season, providing relief for motor carriers. 5/
The balance of supply/demand in trucking is related to the number of trucks available in the market for dispatch vs. the number of loads, at any moment in time. 6/
Who wins?
The Waterfall Theory of Freight suggests the largest carriers are the last to see a slowdown and the first to see the market come back.
The Waterfall Theory of Freight is the foundational theory that tender rejection data is designed to monitor.
7/
The Waterfall Theory of Freight suggests the largest carriers are the last to see a slowdown and the first to see the market come back.
The Waterfall Theory of Freight is the foundational theory that tender rejection data is designed to monitor.
7/
Even though conditions are improving, the capacity situation will continue to correct.
This chart shows the number of net additions of trucking firms in the market (measures revocations vs. newly established firms).
Chart is weekly, green is expansion, red is contraction. 8/
This chart shows the number of net additions of trucking firms in the market (measures revocations vs. newly established firms).
Chart is weekly, green is expansion, red is contraction. 8/

As capacity churns out of the market and volumes continue at robust levels, spot rates will increase.
9/
9/

Contract rates have also likely bottomed. 10/

The next part of the cycle is the worst part for freight brokerages. As shippers have started to prefer asset-based carriers in their routing guides, brokers have lost volume.
But brokers also make their money on the "spread." I.e. the delta between contract and spot. 11/
But brokers also make their money on the "spread." I.e. the delta between contract and spot. 11/
We monitor the spread on SONAR. It is still near record levels. It will come down as spot increases and when it does freight brokers with freight committed in the contract market will get squeezed. 12/

We could see some of the high-growth brokers that financed their growth through debt in zero rate environment fail.
They tied their debt covenants to margins and would be in violation. This could cause some brokerages to fail, as Surge did earlier. 13/ freightwaves.com/news/breaking-…
They tied their debt covenants to margins and would be in violation. This could cause some brokerages to fail, as Surge did earlier. 13/ freightwaves.com/news/breaking-…
Conditions could dramatically improve in Q2 2024, where carriers will have the upper hand.
Shippers should prepare by benchmarking their freight costs against data, locking in contract rates, or using index-linked contracts to manage rate/capacity risk.
14/
Shippers should prepare by benchmarking their freight costs against data, locking in contract rates, or using index-linked contracts to manage rate/capacity risk.
14/
All of the charts presented are available on SONAR.
We also are working with 2 dozen shippers to help them prepare for a tighter 2024 bid season. sonar.freightwaves.com
We also are working with 2 dozen shippers to help them prepare for a tighter 2024 bid season. sonar.freightwaves.com
• • •
Missing some Tweet in this thread? You can try to
force a refresh