Mohit Sharma Profile picture
Sep 8 6 tweets 2 min read Twitter logo Read on Twitter
Don't overcomplicate Trading follows a simple but effective strategy👇

Over 9 EMA + Bearish Pin Bar = Bearish Trade
Under 9 EMA + Hammer Candle= Bullish Trade

A simple strategy that works for you understand with examples🧵
#TCS 15 MIN CHART:-

- TCS is below 9-EMA
- We got a clean Hammer Candle Formation
- Clean 1:5 Risk & Reward Move We Got Image
#NTPC 15 MIN CHART:-

- NTPC is below 9-EMA
- We got a clean Hammer Candle Formation
- Clean 1:7 Risk & Reward Move We Got Image
#NCC 15 MIN CHART:-

- NCC is below 9-EMA
- We got a clean Hammer Candle Formation
- Clean 1:3 Risk & Reward Move We Got Image
#RElLIANCE 15 MIN CHART:-

- RELIANCE is below 9-EMA
- We got a clean Hammer Candle Formation
- Clean 1:3 Risk & Reward Move We Got Image
Follow My Free Telegram Group

✅ Trading Day Intraday Chart

✅ Weekend Swing Trading Chart

✅ Built the Right Mindset for Investing and trading

✅ Weekly Positional Option Trades

✅ Nifty, BankNifty & Stocks S&R Levels

Join II t.me/MohitShrama

• • •

Missing some Tweet in this thread? You can try to force a refresh
 

Keep Current with Mohit Sharma

Mohit Sharma Profile picture

Stay in touch and get notified when new unrolls are available from this author!

Read all threads

This Thread may be Removed Anytime!

PDF

Twitter may remove this content at anytime! Save it as PDF for later use!

Try unrolling a thread yourself!

how to unroll video
  1. Follow @ThreadReaderApp to mention us!

  2. From a Twitter thread mention us with a keyword "unroll"
@threadreaderapp unroll

Practice here first or read more on our help page!

More from @Mohitsharma202

Sep 9
Best Way to Generate 2-4% Extra CAGR in SIP !!

Market % Fall + Money Allocations = S.I.P. Method

A Paid Strategy for FREE🧵
Break it into 7 Phase:-

Phase-1 = Market is on ALL TIME HIGH
Phase-2 = Market is 1-5% down from A.T.H
Phase-3 = Market is 6-10% down
Phase-4 = Market is 11-15% down
Phase-5 = Market is 16-20% down
Phase-6 = Market is 20-25% down
Phase-7 = Market is 26-30% Down
Let's suppose i want to do 20K SIP

Phase 1 = I will invest only 1/4th part of the SIP amount 3/4th part i will invest in Liquid Bees because the market is all-time high

Phase -2 = I will invest only 2/4th part of the SIP amount 2/4th part i will invest in Liquid Bees
Read 8 tweets
Sep 7
If someone starts trading with 1 Lac Capital What Steps you Should follow

10 Steps to grow a Small Account + Intraday Rules-Based Setup With Examples

Here’s how to grow a Small Account 🧵
1. Start With Cash Trading:-

- When you have less capital below 5 lacs start with cash trading

- F&O need some experience spend some time in cash trading & learn about stock & index movements

- Never directly jump in F&O Trading
2. Divide your Capital in 5 Parts:-

- Never trade with full qty on a particular stock

- Divide your capital into 5-6 Parts

- Let's suppose someone has 1 Lac Capital divided into 5 parts so 20K for 1 stock
Read 17 tweets
Sep 4
Nifty Extended Move Swing Trading Setup

Extended Move + Moving Average = Swing Setup

A Complete Strategy Pls Share & Hit Like🧵:
1] 50-Moving Average:-

I have used EMA 50 to identify which direction the price is trying to move in a daily timeframe

For swing trading, the 50-moving average is the best tool to identify the market direction
2] We will wait for an Extended move in one direction which is more than 5%

When the Price & 50-EMA have a 5% gap we will mark that area

Now, Let's see some examples
Read 8 tweets
Aug 29
Sharing Most Advanced Options Trading Strategy Call Ratio Spread for Free

That you can use based on the different market view

A thread 🧵
Call Ratio Spread Example:-

Buy x 1 = 40000 CE
Sell x 2 = 40500 CE Image
Let's decode this above position

Now look at this payoff graph max profit at selling position 40500

If the market expires at 40500 we will gain a max profit of Rs 16000

If the market keeps falling we are at a profit of 1.5-2%
Read 9 tweets
Aug 27
A Complete Master Thread on Top 10 Candlestick Patterns that

Change My Swing Trading Setup Completely

Master Thread... Image
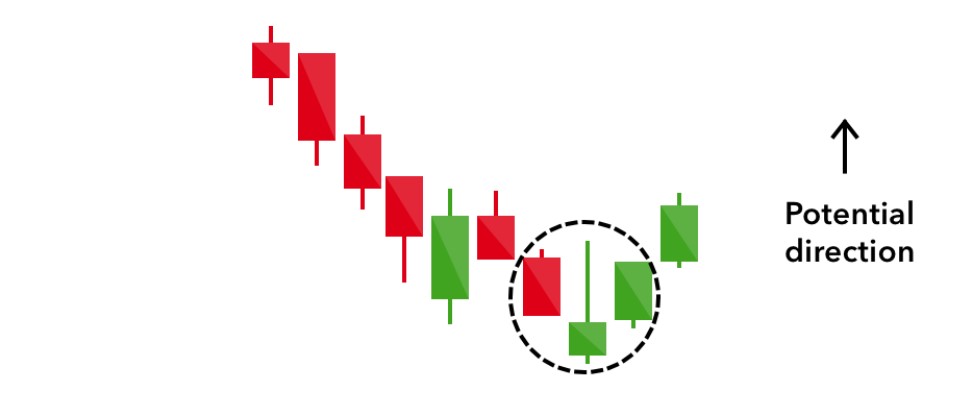
1. Hammer:-

✅ The hammer candlestick pattern is formed of a short body with a long lower wick

✅ Found at the bottom of a downward trend

✅ A hammer shows there were selling pressures during the day & ultimately a strong buying pressure Come Back Image
2. Inverse hammer:-

✅ A similarly bullish pattern is the inverted hammer

✅ The only difference is that the upper wick is long, while the lower wick is short

✅ The inverse hammer suggests that buyers will soon have control of the market Image
Read 12 tweets
Aug 26
If you want to be a successful Trader

Then you need to understand the language of Price Action

Here are 10 Price Action Charts Pattern You Should Master

Mega Thread on Price Action Worth ₹ 50K for FREE🧵
1. Head & Shoulders

What does a Head and Shoulders pattern look like?

The chart pattern has three swing lows & the middle swing low is the lowest

The line connecting the two swing highs is the neckline
For a Bullish Pattern, Buy:

✅ On break-out above the neckline
✅ On pullback to the neckline after the break-out

For a Bearish Pattern, Sell:

✅ On break-out below the neckline
✅ On pullback to the neckline after the break-out Image
Read 18 tweets

Did Thread Reader help you today?

Support us! We are indie developers!


This site is made by just two indie developers on a laptop doing marketing, support and development! Read more about the story.

Become a Premium Member ($3/month or $30/year) and get exclusive features!

Become Premium

Don't want to be a Premium member but still want to support us?

Make a small donation by buying us coffee ($5) or help with server cost ($10)

Donate via Paypal

Or Donate anonymously using crypto!

Ethereum

0xfe58350B80634f60Fa6Dc149a72b4DFbc17D341E copy

Bitcoin

3ATGMxNzCUFzxpMCHL5sWSt4DVtS8UqXpi copy

Thank you for your support!

Follow Us on Twitter!

:(