[THREAD]
We often hear that migration is beneficial for European economies but how true is this claim?
In this thread, I will present a comprehensive breakdown of all the evidence from several studies and analysis from across the continent
🧵🔽
We often hear that migration is beneficial for European economies but how true is this claim?
In this thread, I will present a comprehensive breakdown of all the evidence from several studies and analysis from across the continent
🧵🔽

1/ Let's start with the UK 🇬🇧
A study from 2014 showed that in the period between 1995-2011, migrants cost the UK £114 billion.
• Europeans made a +£4bn contribution
• Non-EEA migrants made -£118bn contribution
cream-migration.org/files/FiscalEJ…
A study from 2014 showed that in the period between 1995-2011, migrants cost the UK £114 billion.
• Europeans made a +£4bn contribution
• Non-EEA migrants made -£118bn contribution
cream-migration.org/files/FiscalEJ…

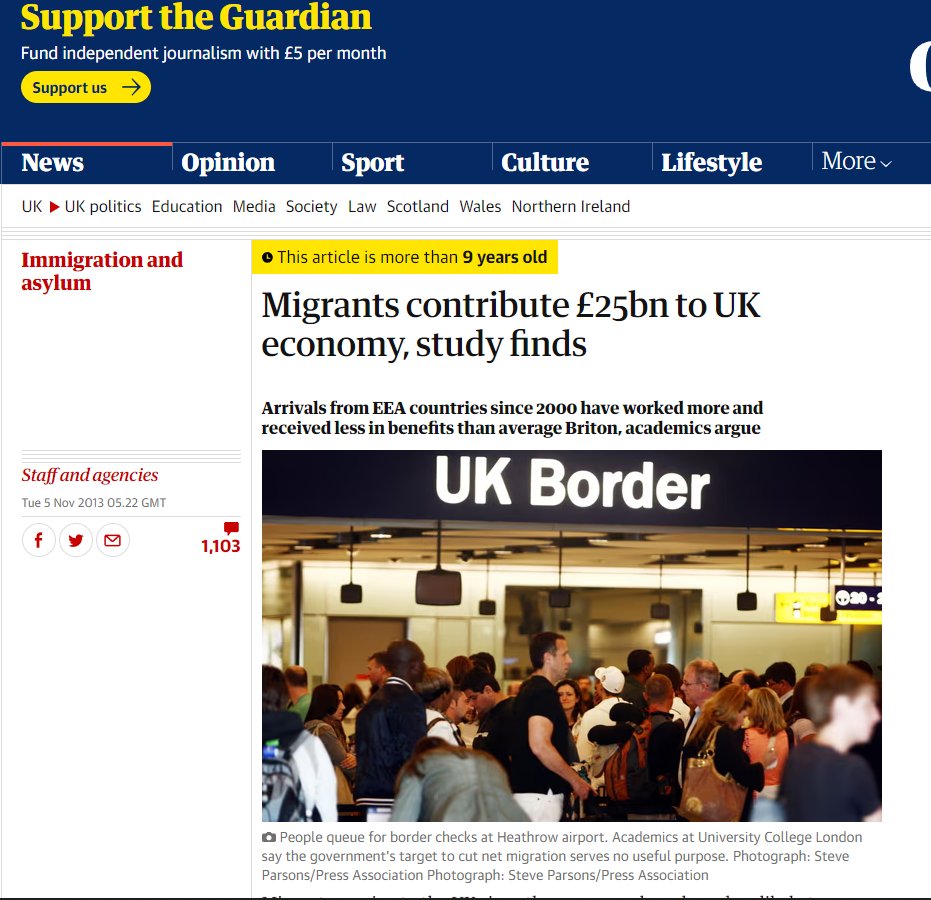
2/ The report also included a Recent Arrivals analysis, indicating positive migrant contributions over a 10-year period (typically ages 27-37)
This is misleading as it doesn't cover future costs. Unsurprisingly, this what the media ran with rather than the -£114bn over 1995-2011
This is misleading as it doesn't cover future costs. Unsurprisingly, this what the media ran with rather than the -£114bn over 1995-2011

3/ Another study used a static & dynamic analysis approach
The static analysis (using current data) showed that while EEA migrants are positive contributors, non-EEA migrants perform significantly worse than natives despite having a far lower average age
oxfordeconomics.com/resource/the-f…
The static analysis (using current data) showed that while EEA migrants are positive contributors, non-EEA migrants perform significantly worse than natives despite having a far lower average age
oxfordeconomics.com/resource/the-f…

4/ The 'dynamic analysis' is a prediction model which counts migrant children as natives and claims 'a large share' will return to their homelands in old age.
Any honest person can understand how this is a hugely misleading way to predict the future impact of migrants
Any honest person can understand how this is a hugely misleading way to predict the future impact of migrants

5/ So which migrants will return to their homelands?
Data from the UK and Norway both show that economically productive migrants are the most likely to return and predictably, the least productive are the least likely to
1:
2: readkong.com/page/large-sca…
cream-migration.org/publ_uploads/C…
Data from the UK and Norway both show that economically productive migrants are the most likely to return and predictably, the least productive are the least likely to
1:
2: readkong.com/page/large-sca…
cream-migration.org/publ_uploads/C…


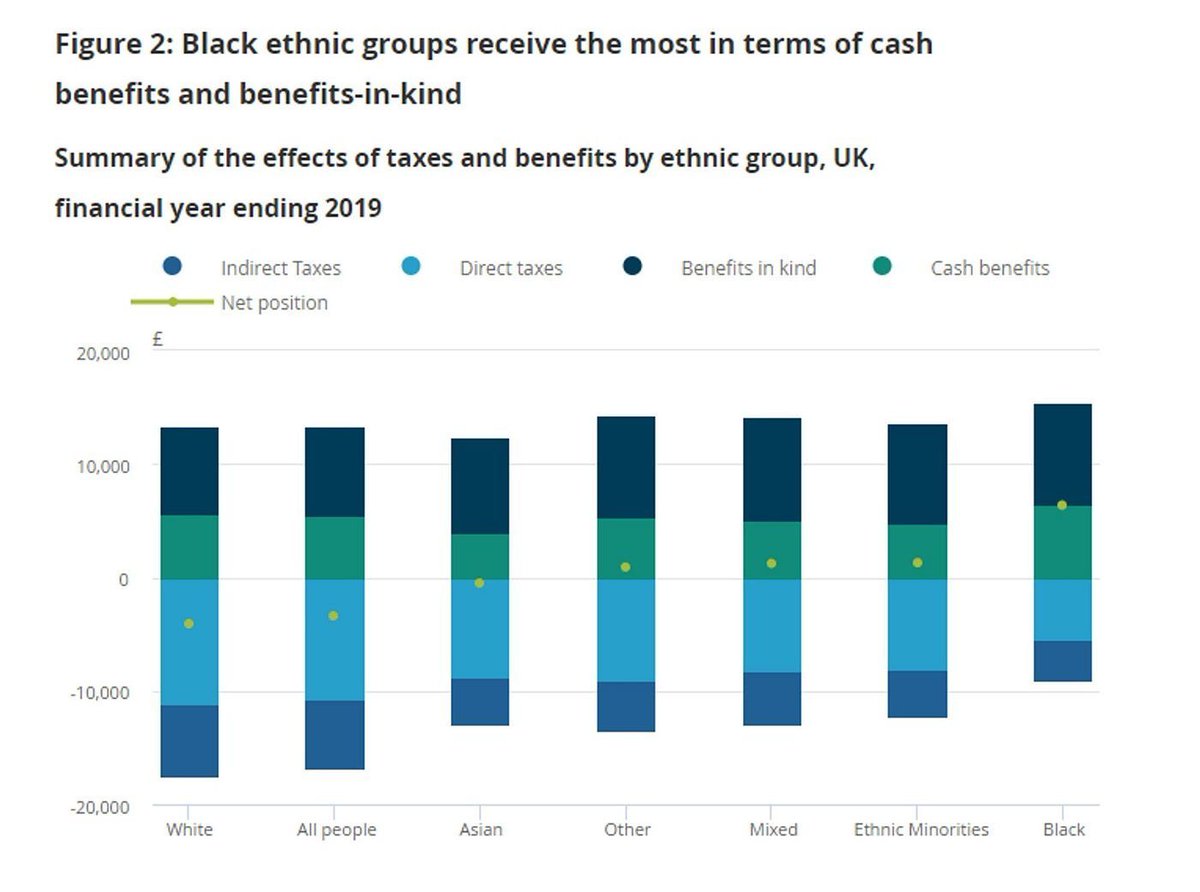
6/ This should be of no surprise.
ONS data shows that overall, all non-white group categories were net beneficiaries in terms of taxes paid and benefits received and migrant groups from these areas have the highest rates of child benefit, disability benefit, and social housing
ONS data shows that overall, all non-white group categories were net beneficiaries in terms of taxes paid and benefits received and migrant groups from these areas have the highest rates of child benefit, disability benefit, and social housing

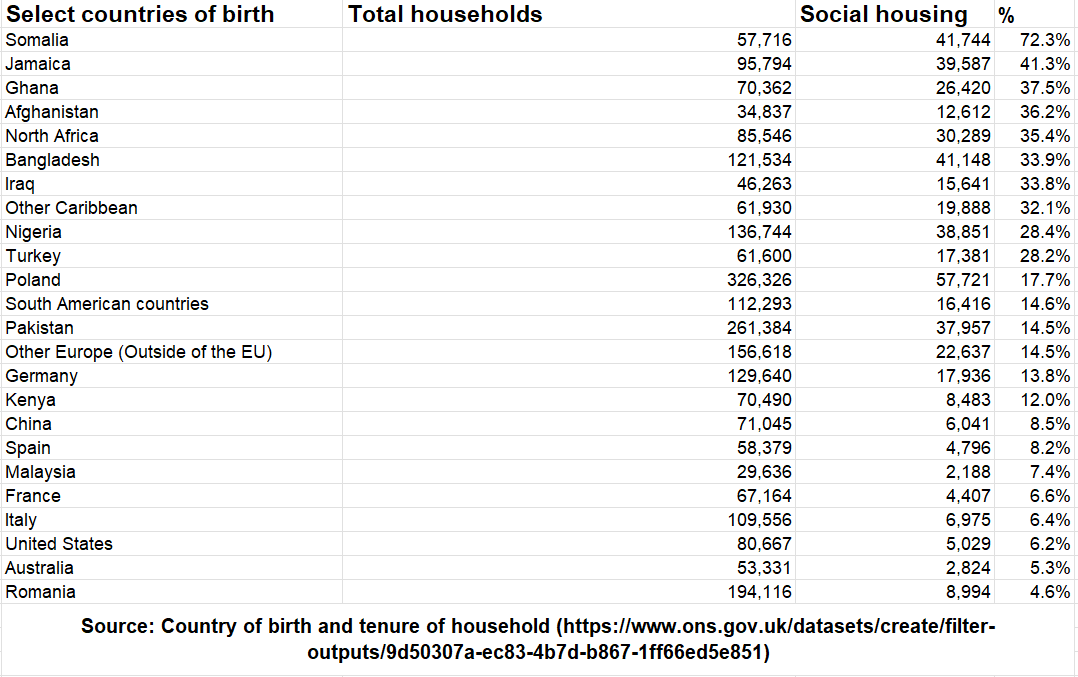
7/ The top 10 migrant nations for social housing are non-EEA, with 72% of Somalians, 41% of Jamaicans & 37% of Ghanaians living in social housing.
In London, a city known for its high real estate prices, 51.7% of the Black population lives in social housing
In London, a city known for its high real estate prices, 51.7% of the Black population lives in social housing

8/ When it comes to employment rates, natives have the joint highest while Pakistani/Bangladeshi score the lowest
Alarmingly, only 19.8% of working age Muslims are in full-time employment.
ethnicity-facts-figures.service.gov.uk/work-pay-and-b…
gov.uk/government/new…
Alarmingly, only 19.8% of working age Muslims are in full-time employment.
ethnicity-facts-figures.service.gov.uk/work-pay-and-b…
gov.uk/government/new…


9/ Migration also impacts wages
In fact, migration is more likely to increase wages at the top of the distribution & reduce wages at the bottom
Migration makes the working-class poorer & the upper class richer
1:
2: assets.publishing.service.gov.uk/government/upl…
readkong.com/page/large-sca…
In fact, migration is more likely to increase wages at the top of the distribution & reduce wages at the bottom
Migration makes the working-class poorer & the upper class richer
1:
2: assets.publishing.service.gov.uk/government/upl…
readkong.com/page/large-sca…


10/ Now let's go to Holland 🇳🇱
Similar to the UK, Western migrants provide a fiscal surplus averaging at +€25,000 while non-Western migrants create a deficit, averaging at -€275,000
Worth noting that asylum seekers cost the Dutch €475,000 per refugee
demo-demo.nl/wp-content/upl…
Similar to the UK, Western migrants provide a fiscal surplus averaging at +€25,000 while non-Western migrants create a deficit, averaging at -€275,000
Worth noting that asylum seekers cost the Dutch €475,000 per refugee
demo-demo.nl/wp-content/upl…

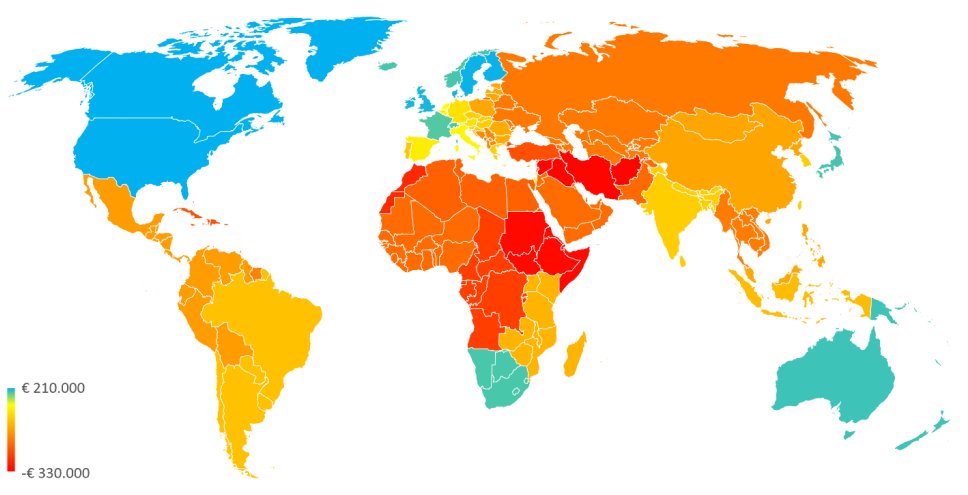
11/ This map shows the net contribution of 1st generation migrants in Holland
The report concludes that the total net costs of immigration averaged €17 billion per year and between 1995–2019, the total costs amounted to €400 billion
The report concludes that the total net costs of immigration averaged €17 billion per year and between 1995–2019, the total costs amounted to €400 billion
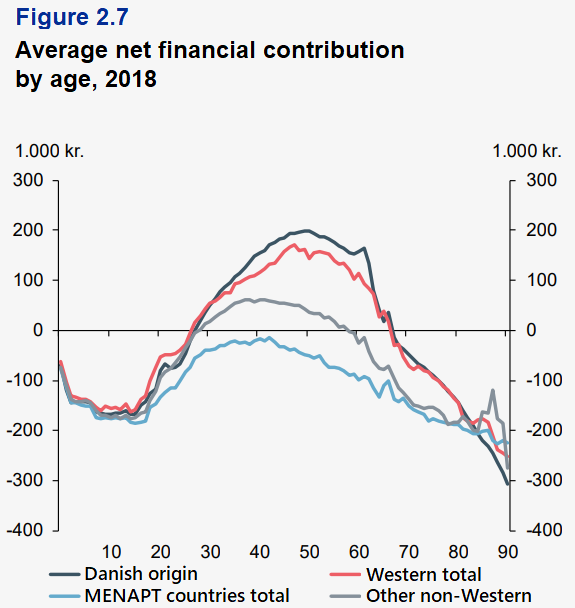
12/ In Denmark, the total net contribution in 2018 by native Danish people was +41 billion DKK. The contribution of immigrants and their descendants was net negative at -24 billion DKK
However, non-Western migrants perform worse by a considerable measure
fm.dk/udgivelser/202…
However, non-Western migrants perform worse by a considerable measure
fm.dk/udgivelser/202…

13/ A study from France showed migration was overall negative for the period between 1979 and 2011 costing 0.5% of its GDP
This was while counting children of migrants as natives, which the authors concede make the results more favourable for migrants
cepii.fr/PDF_PUB/wp/201…
This was while counting children of migrants as natives, which the authors concede make the results more favourable for migrants
cepii.fr/PDF_PUB/wp/201…
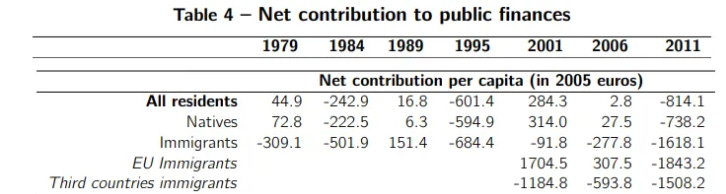
14/ Later in the study they used a household approach which counted children of migrants in the migrant group
With this approach, migration cost France €30 billion in 2011 and was enough of a burden for the French primary deficit of 1984
With this approach, migration cost France €30 billion in 2011 and was enough of a burden for the French primary deficit of 1984

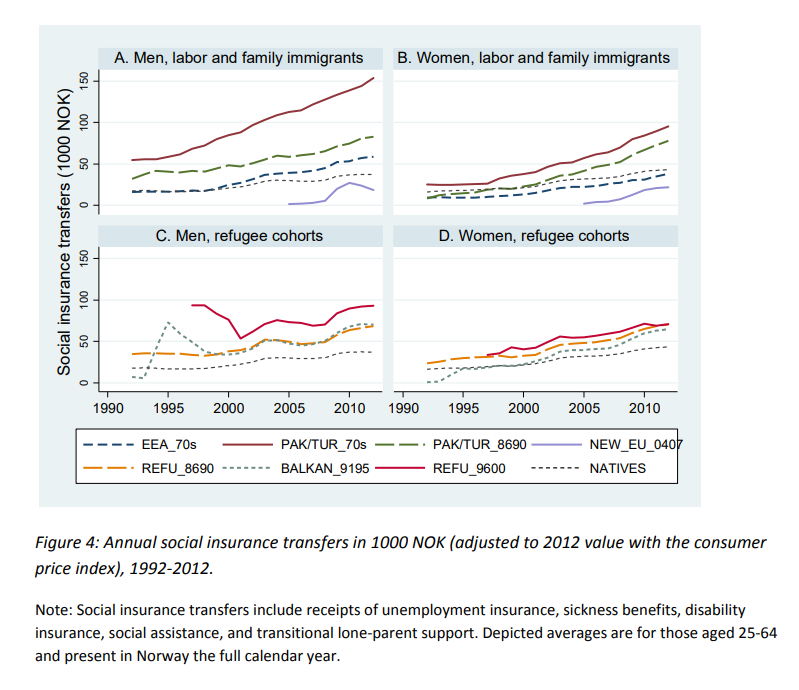
15/ Next we have Norway which examined fiscal contributions from 1970 until 2012.
The charts show similar employment and earnings between EEA and natives while refugees and migrants from Pakistan/Turkey show negative contributions
cream-migration.org/publ_uploads/C…
The charts show similar employment and earnings between EEA and natives while refugees and migrants from Pakistan/Turkey show negative contributions
cream-migration.org/publ_uploads/C…
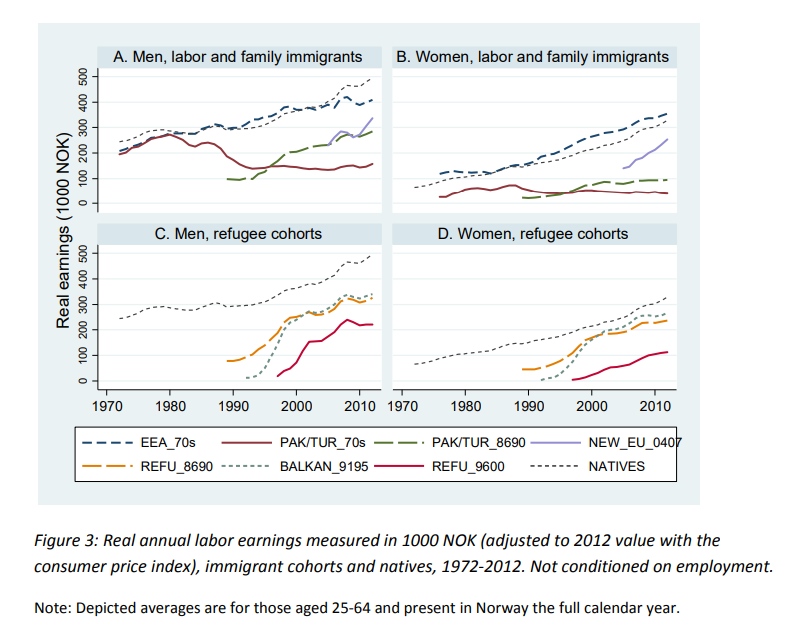

16/ Only 40% of migrants from Pakistan and Turkey are employed and 62.5% of migrants from this region were welfare recipients
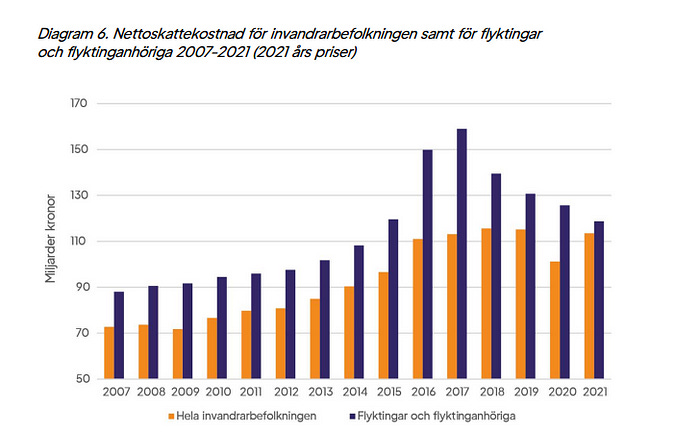
17/ Sweden took in the most refugees per capita during the migrant crisis of 2015.
A report estimated that the net tax cost for migrants and migrants' relatives amounts to an average of $10bn per year.
The net tax cost is on average 2.38% of GDP
via.tt.se/data/attachmen…
A report estimated that the net tax cost for migrants and migrants' relatives amounts to an average of $10bn per year.
The net tax cost is on average 2.38% of GDP
via.tt.se/data/attachmen…
18/ In Finland, the average Iraqi migrant (aged 20-24) costs €844k if they choose to have children, costing €1.27 million more than the average Finnish-born family
Worse still, a single Somali immigrant costs the Finnish state almost €1 million
suomenperusta.fi/content/upload…
Worse still, a single Somali immigrant costs the Finnish state almost €1 million
suomenperusta.fi/content/upload…

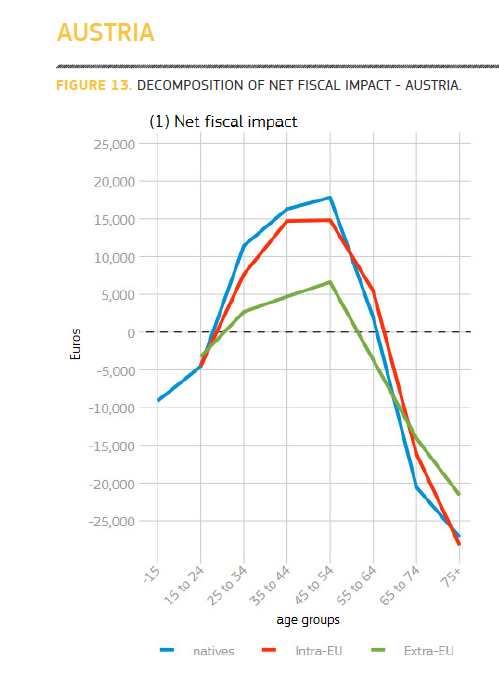
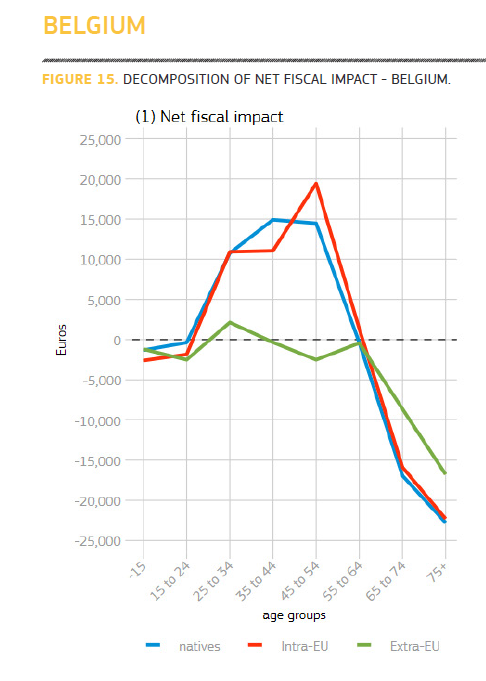
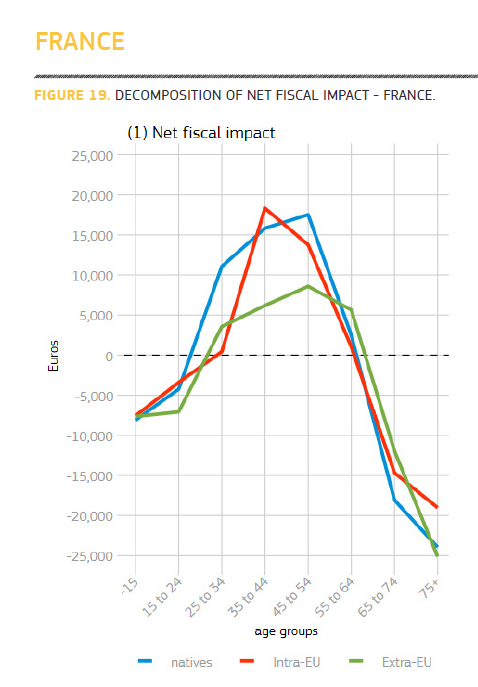
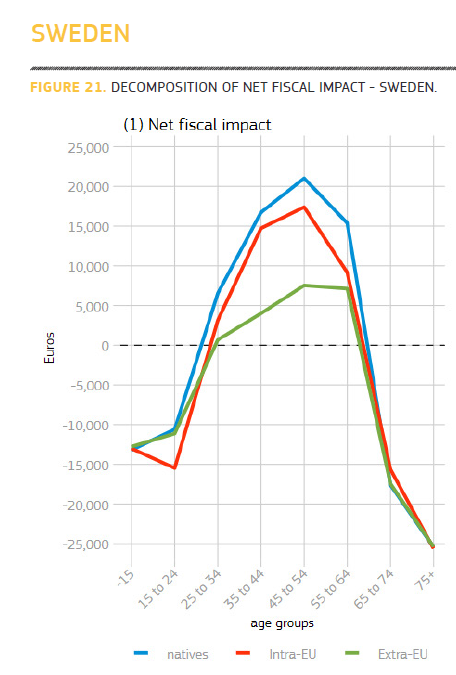
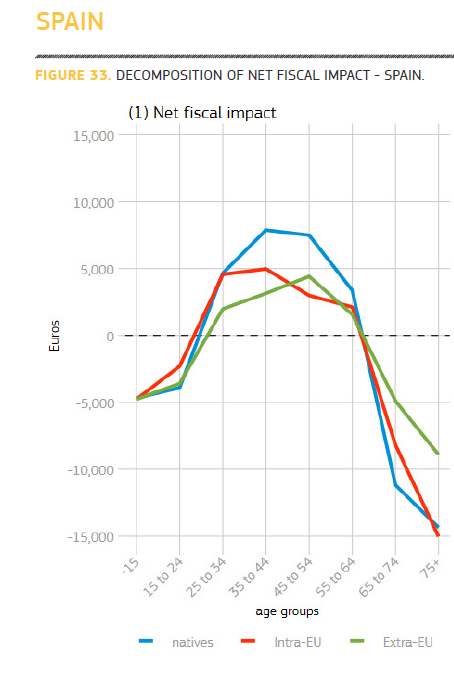
19/ An EU commission report showed the fiscal contribution of native, EEA (intra-EU) and non-EEA (extra-EU) groups.
The same trend continues throughout European countries with large-scale immigration
ec.europa.eu/migrant-integr…
The same trend continues throughout European countries with large-scale immigration
ec.europa.eu/migrant-integr…

20/ Continued...


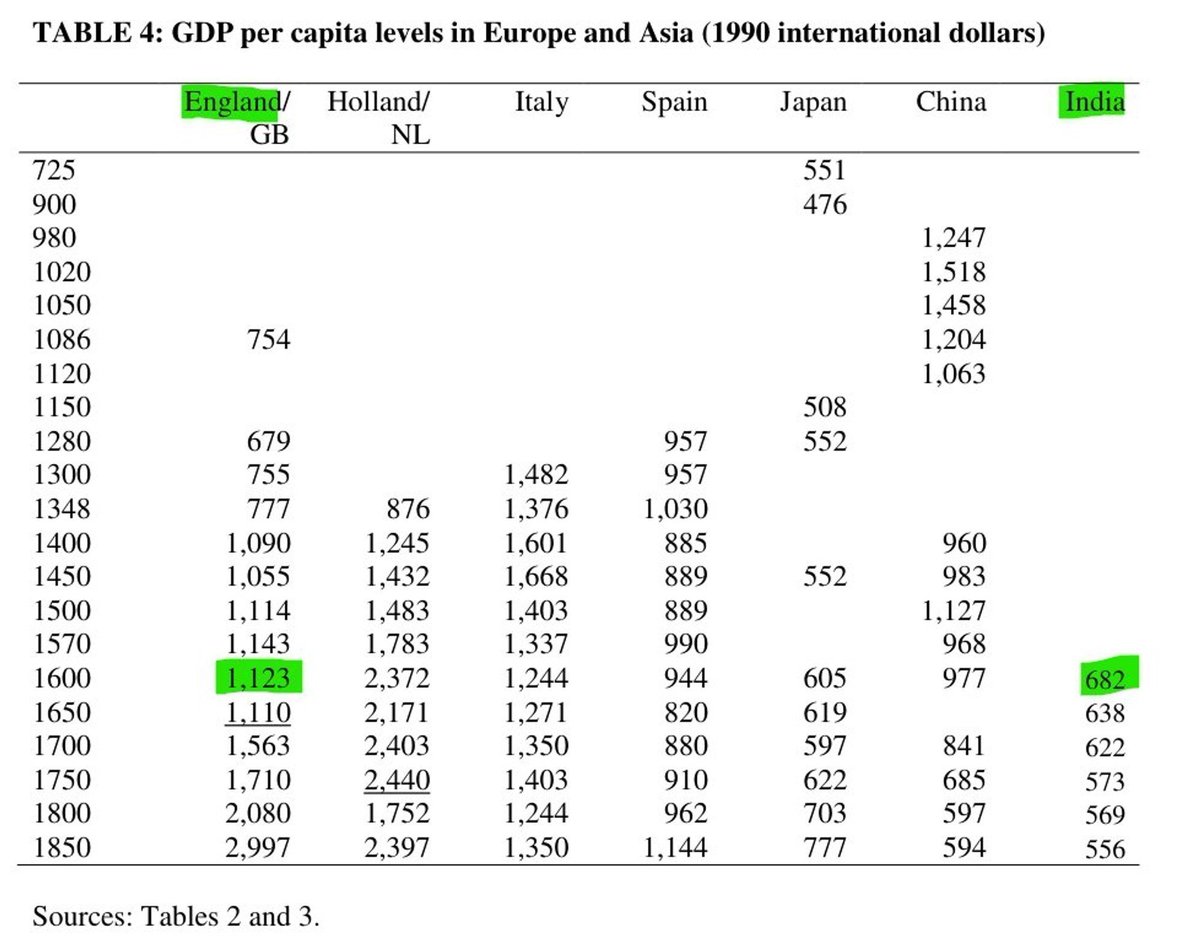
21/ It's worth noting that countries which hitherto have resisted mass immigration are performing fine without foreign labour
Poland is set to be wealthier than the UK by 2030
telegraph.co.uk/business/2023/…
Poland is set to be wealthier than the UK by 2030
telegraph.co.uk/business/2023/…
22/ To conclude, targeted immigration could be economically beneficial, however current immigration policy is evidently a negative for European nations.
For more information, read my Substack article on the topic
thecompositeguy.substack.com/p/has-immigrat…
For more information, read my Substack article on the topic
thecompositeguy.substack.com/p/has-immigrat…
• • •
Missing some Tweet in this thread? You can try to
force a refresh