August 2023 Temperature Update
By far the warmest August since direct measurements began.
Warmest for both land & ocean.
Strengthening El Niño.
Nearly certain 2023 becomes the warmest year directly measured.
May see a +1.5 °C annual excess in 2023.
berkeleyearth.org/august-2023-te…

By far the warmest August since direct measurements began.
Warmest for both land & ocean.
Strengthening El Niño.
Nearly certain 2023 becomes the warmest year directly measured.
May see a +1.5 °C annual excess in 2023.
berkeleyearth.org/august-2023-te…
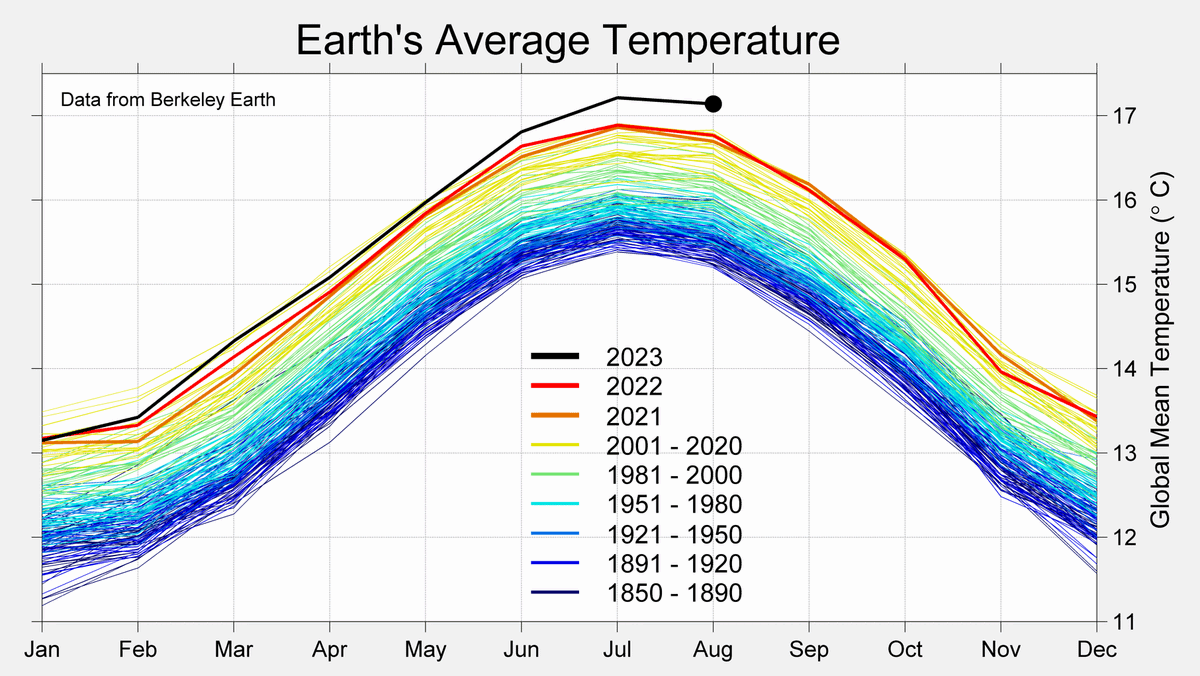
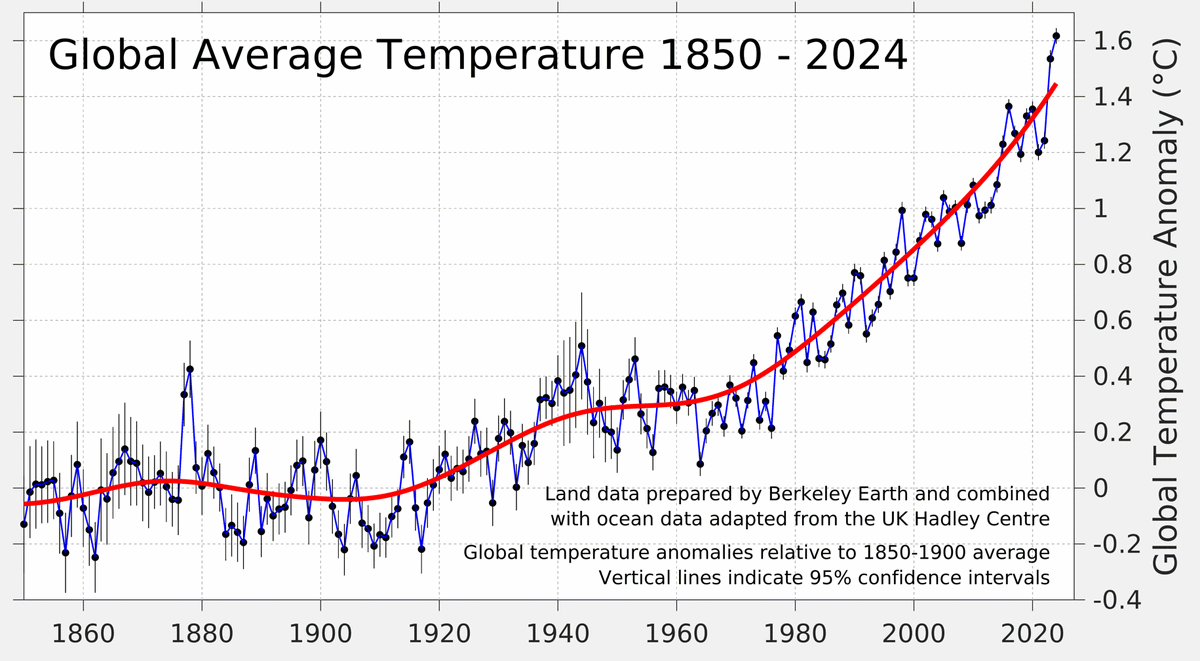
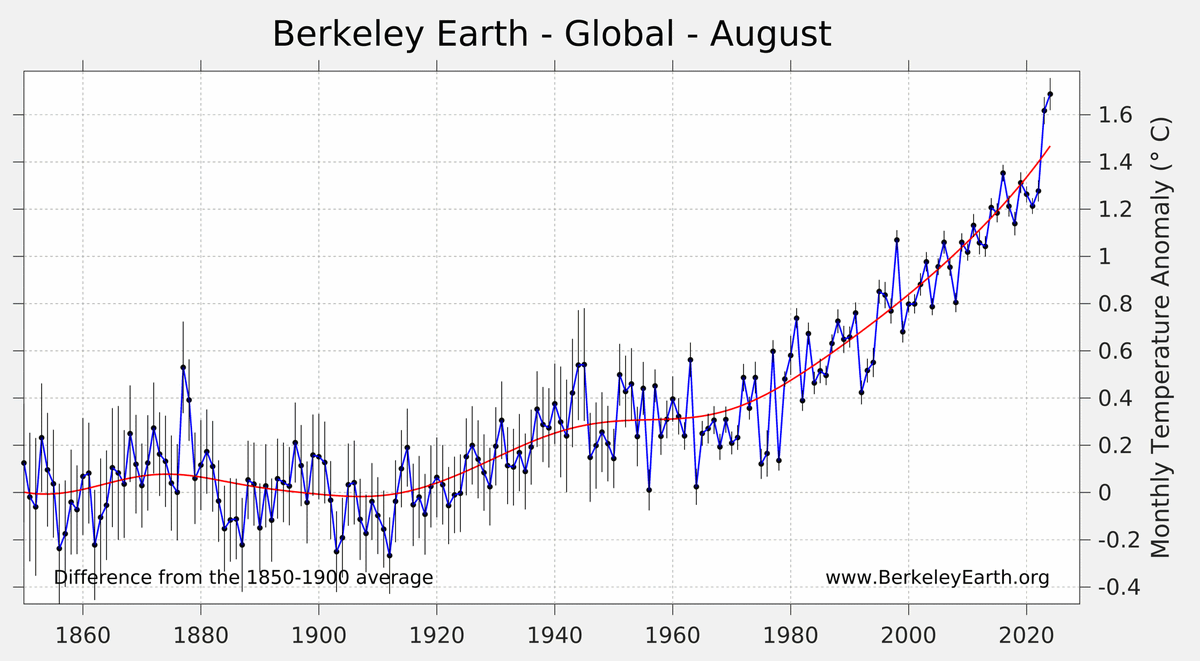
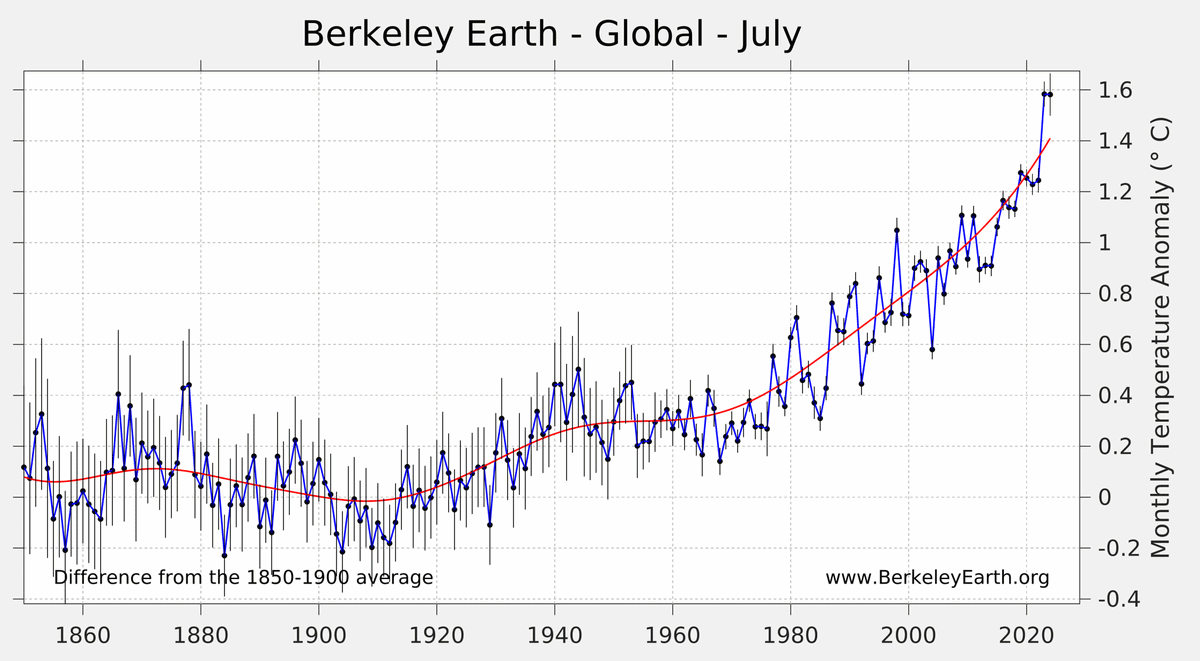
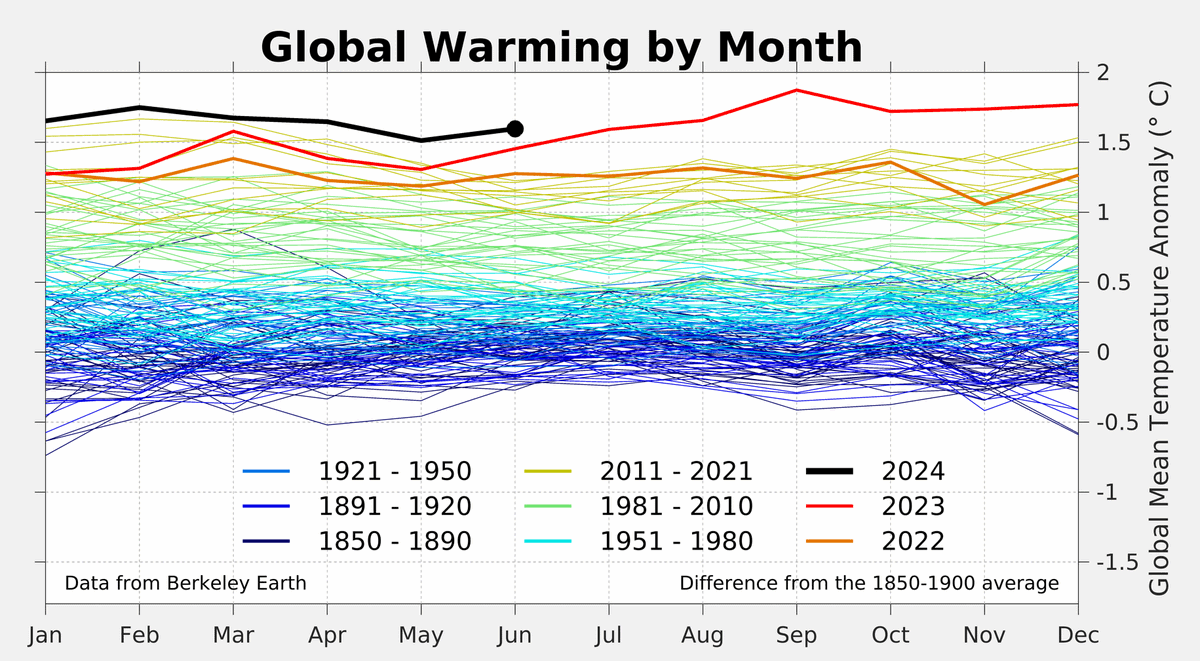
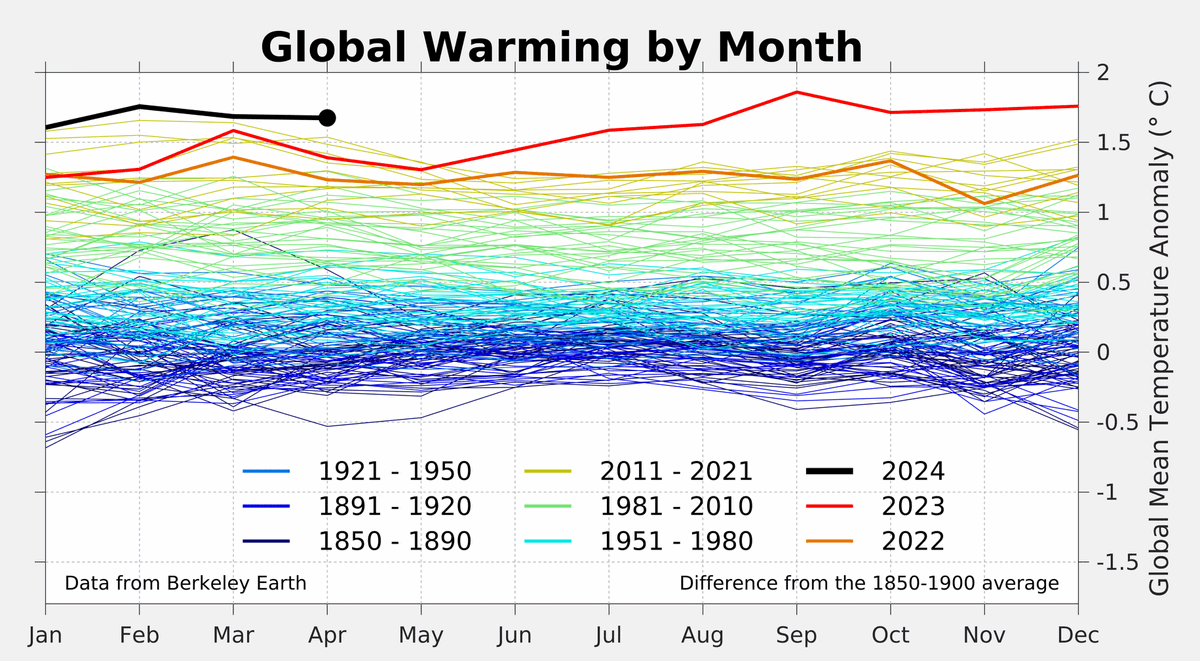
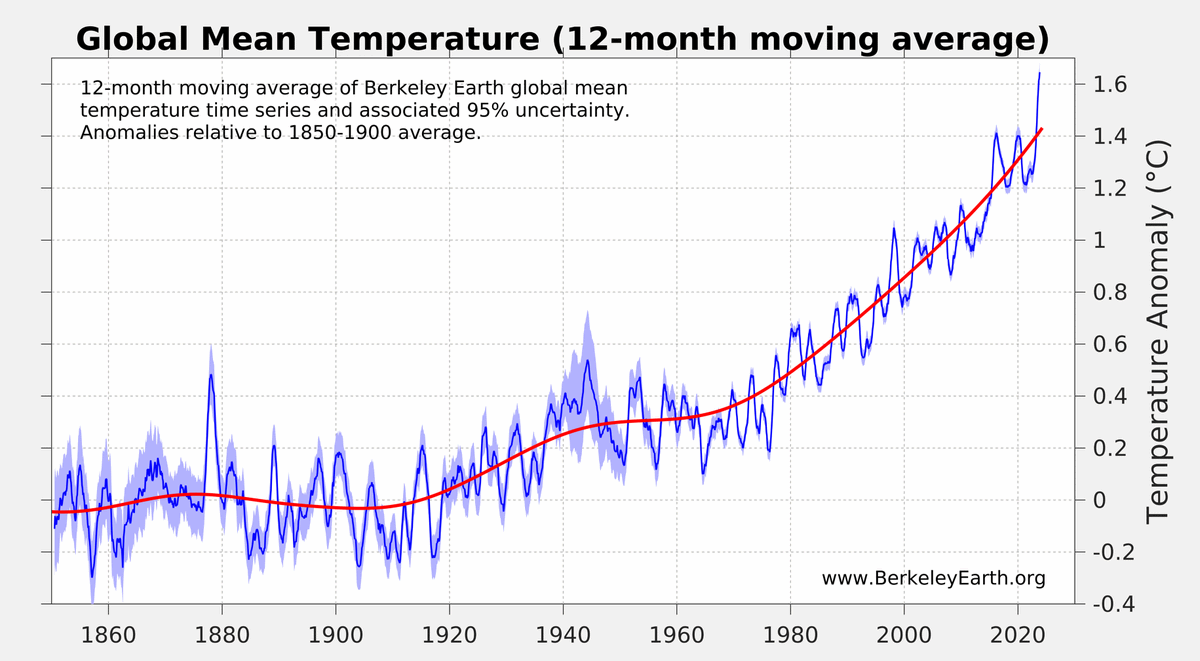
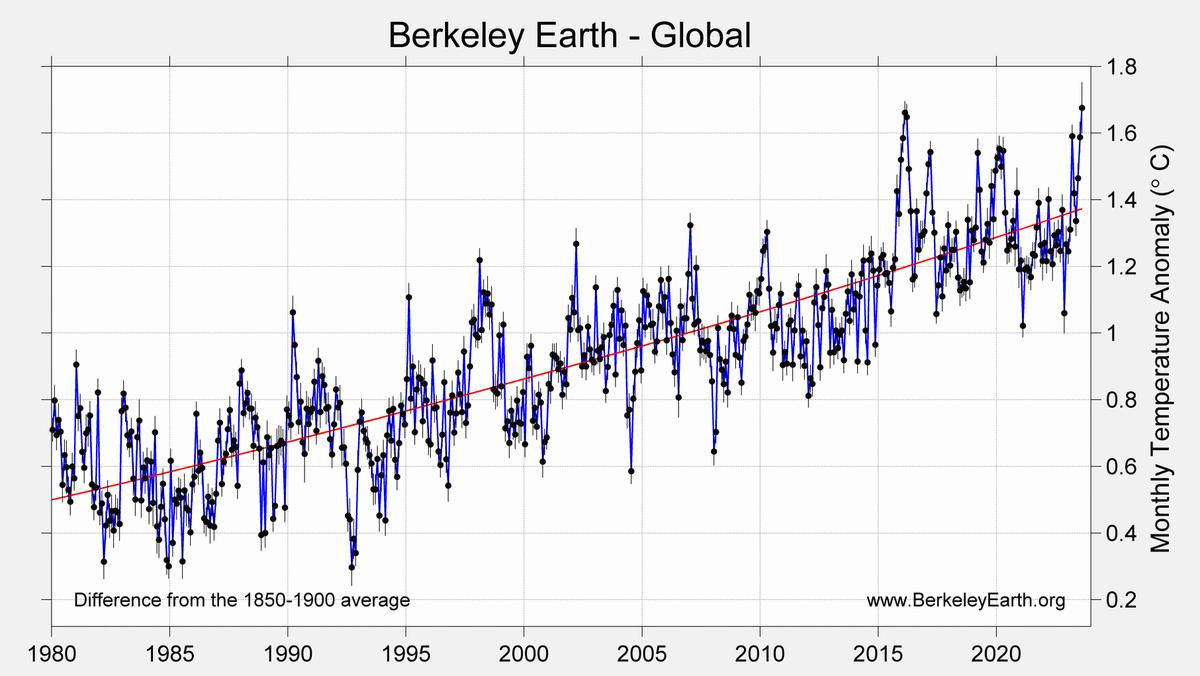
Globally, August 2023 was record-shatteringly warm.
The global average was recorded as 1.68 ± 0.09 °C (3.02 ± 0.16 °F) above the 1850 to 1900 baseline.
This beats the previous record, from August 2016, by 0.31 °C (0.56 °F).
2/
The global average was recorded as 1.68 ± 0.09 °C (3.02 ± 0.16 °F) above the 1850 to 1900 baseline.
This beats the previous record, from August 2016, by 0.31 °C (0.56 °F).
2/
Above average temperatures were widespread in August, with the exception of Antarctica, which saw quite cold conditions in part.
The El Niño, which began in June, continues to strengthen in the equatorial Pacific
3/
The El Niño, which began in June, continues to strengthen in the equatorial Pacific
3/
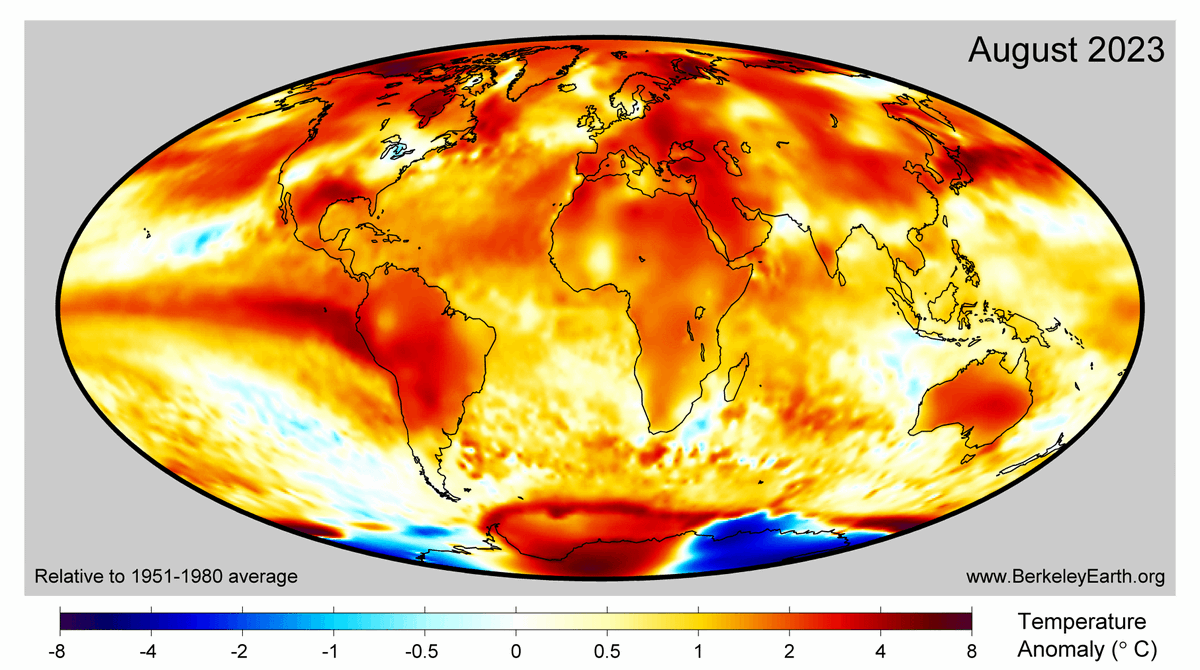
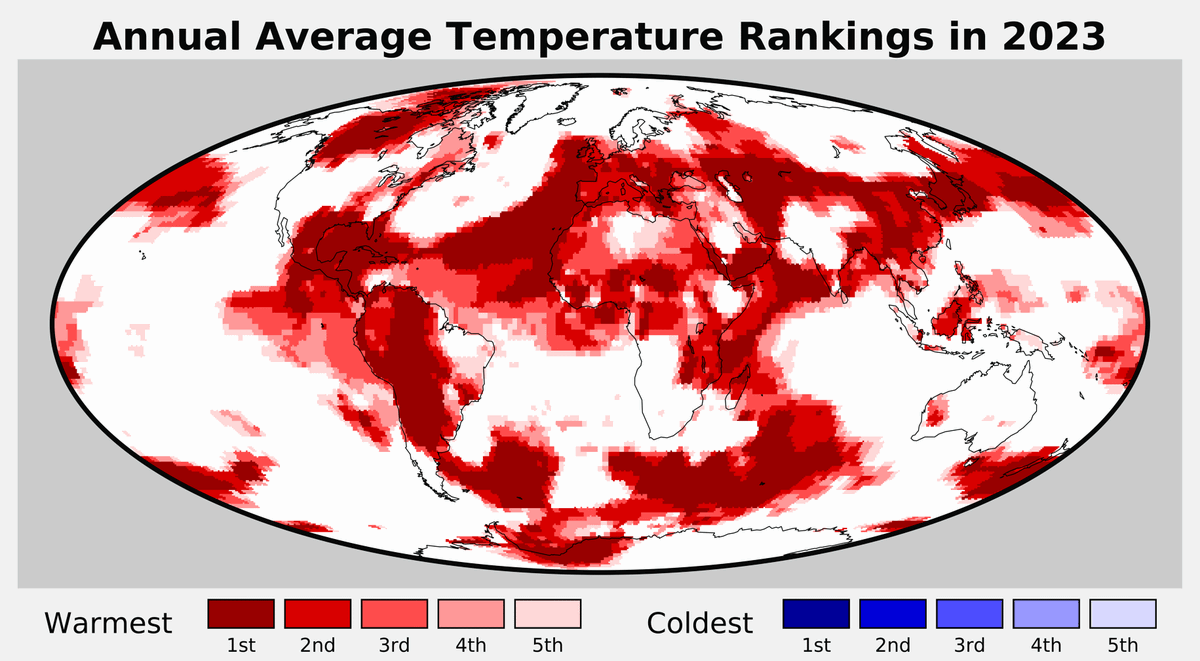
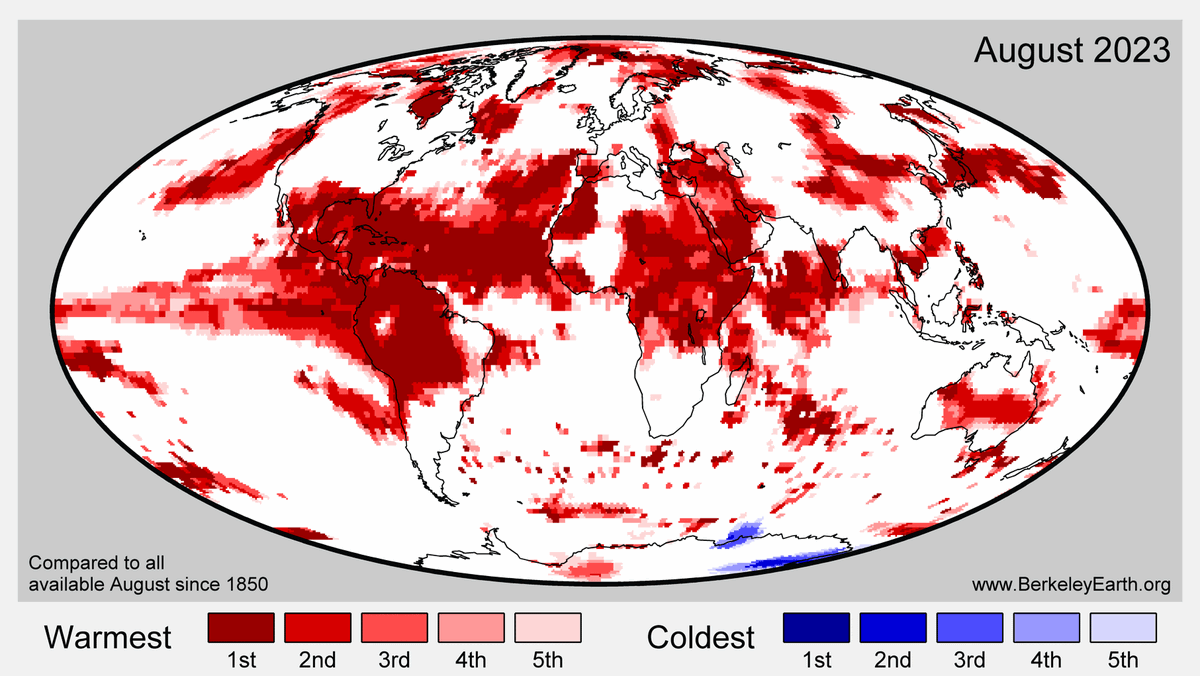
During August, record warmth was particularly prominent in the tropics, as well parts of the Pacific and the North Atlantic.
13% of the Earth's surface was locally record warm in August, and 65 countries (mostly in the tropics) set new national-average records for August.
4/
13% of the Earth's surface was locally record warm in August, and 65 countries (mostly in the tropics) set new national-average records for August.
4/
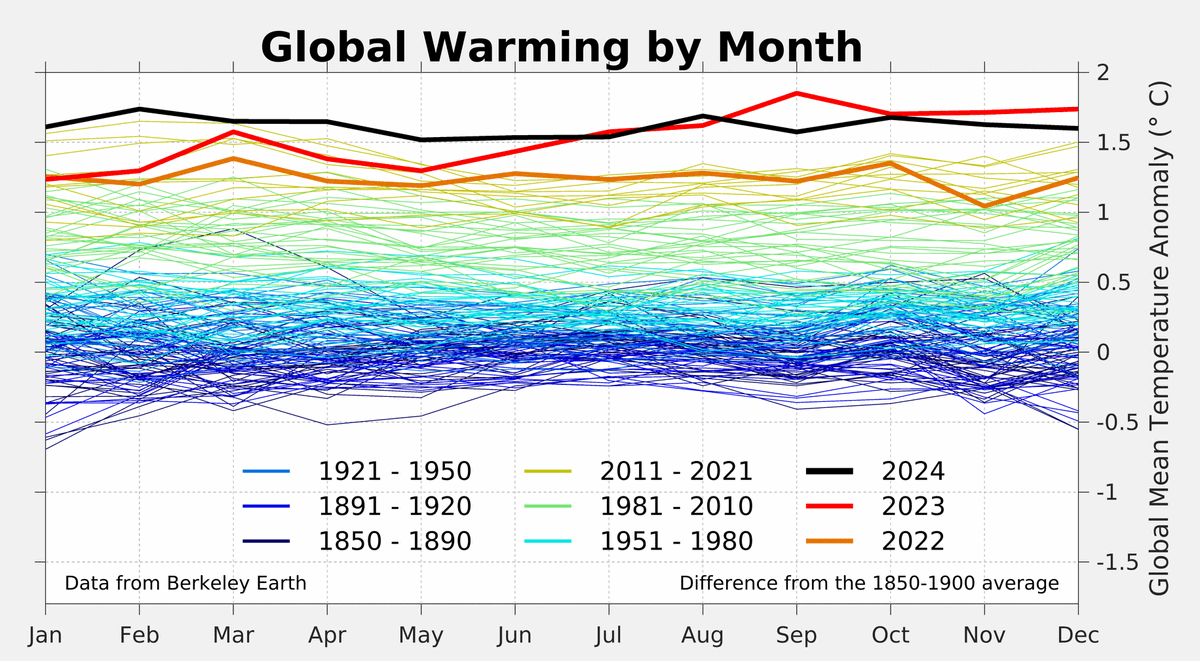
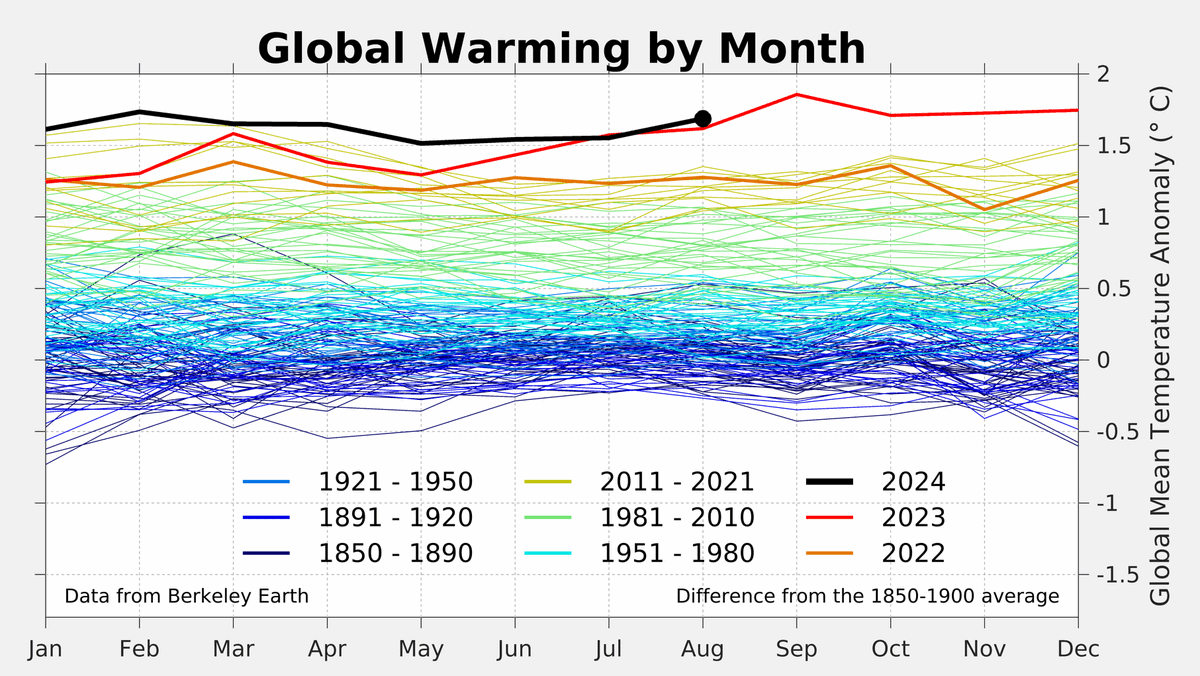
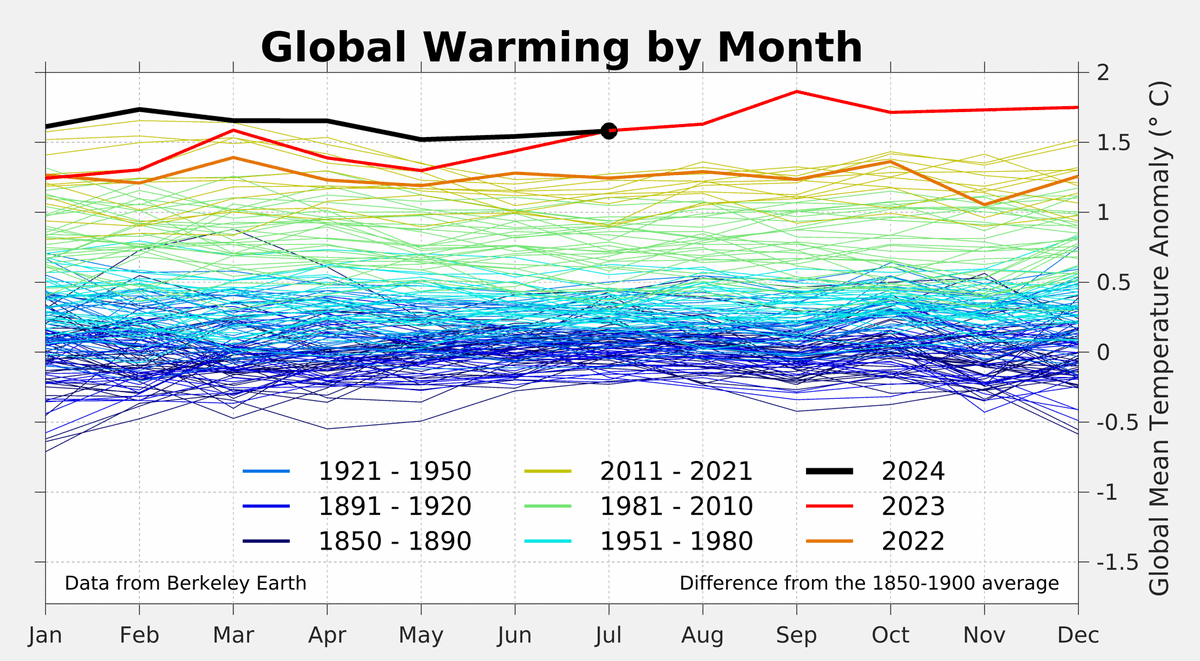
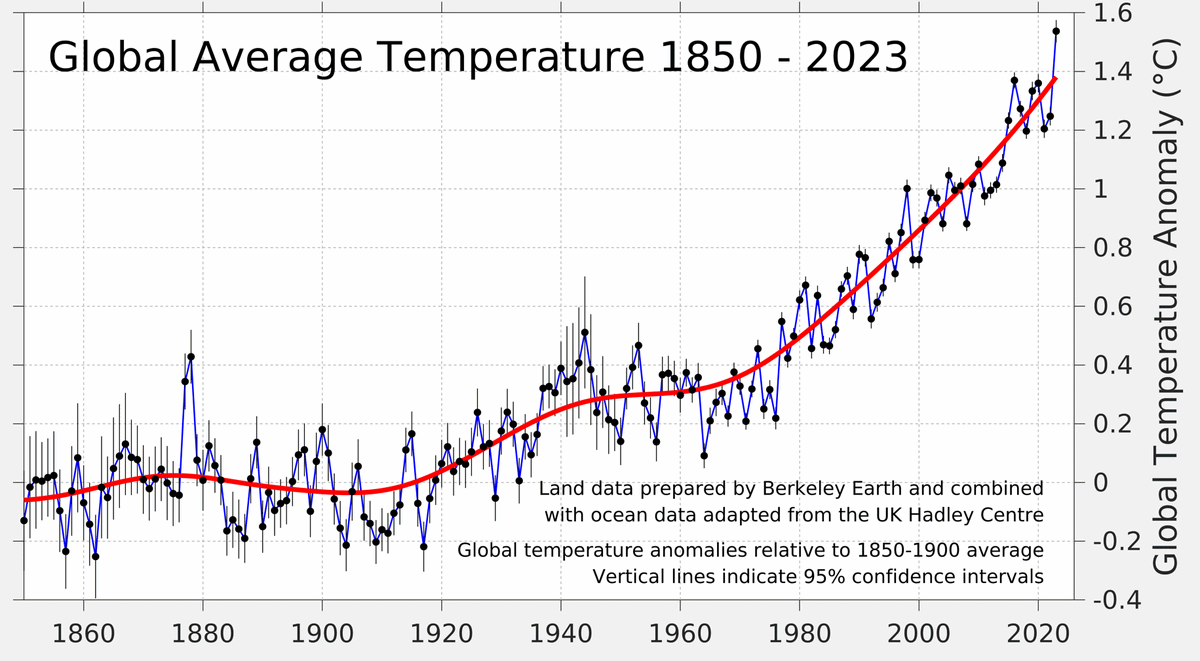
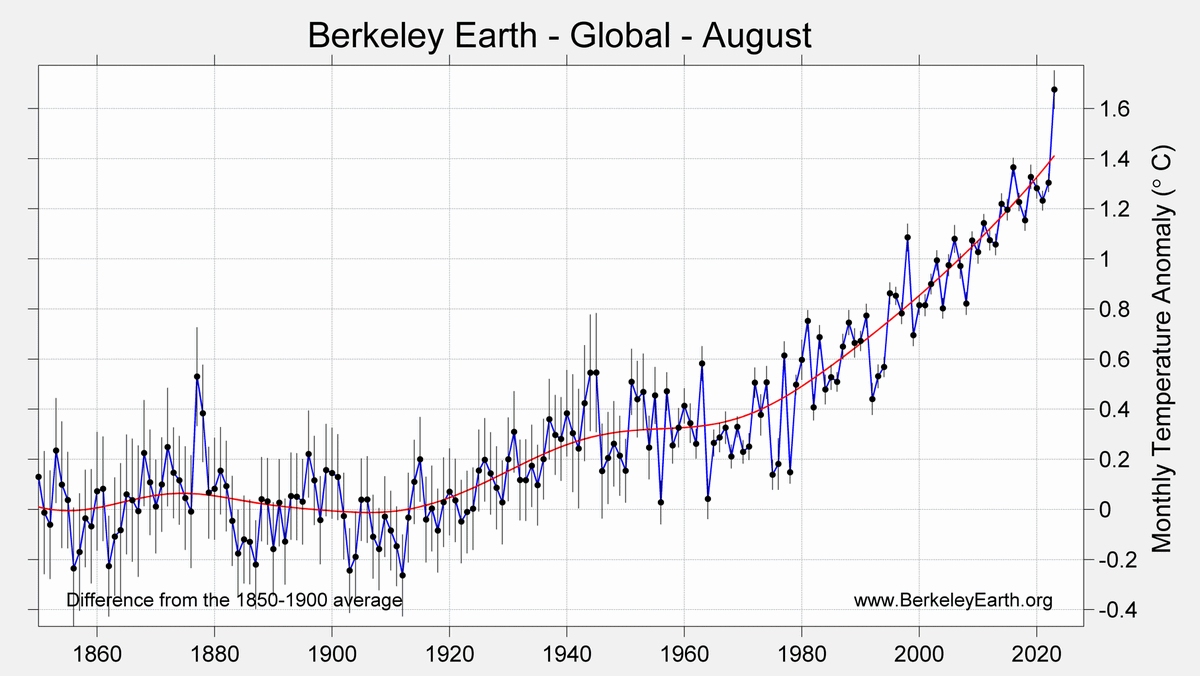
When compared to all other months, the monthly temperature anomaly observed in August 2023 effectively tied February and March 2016 as the largest on record.
5/
5/
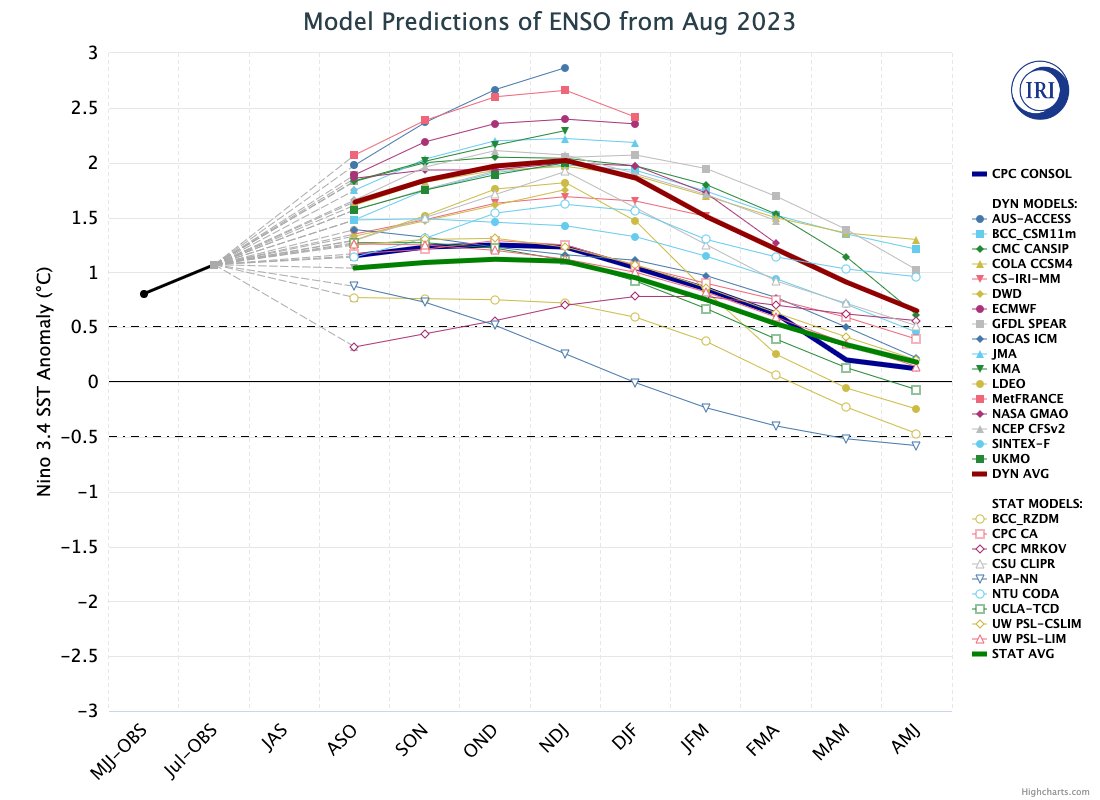
El Niño has continued to strengthen, and is projected to continue well into 2024, which will boost global average temperatures somewhat.
Models remain divided on whether to ultimately expect a moderate, strong, or very strong El Niño.
IRI chart:
6/ iri.columbia.edu/our-expertise/…
Models remain divided on whether to ultimately expect a moderate, strong, or very strong El Niño.
IRI chart:
6/ iri.columbia.edu/our-expertise/…
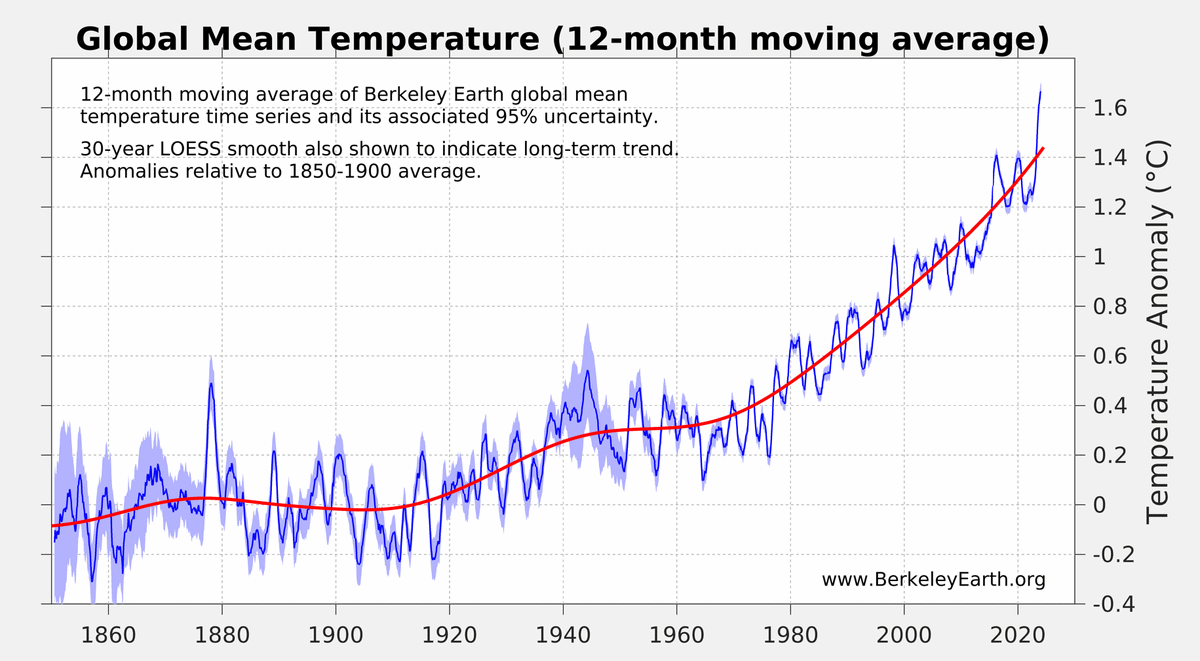
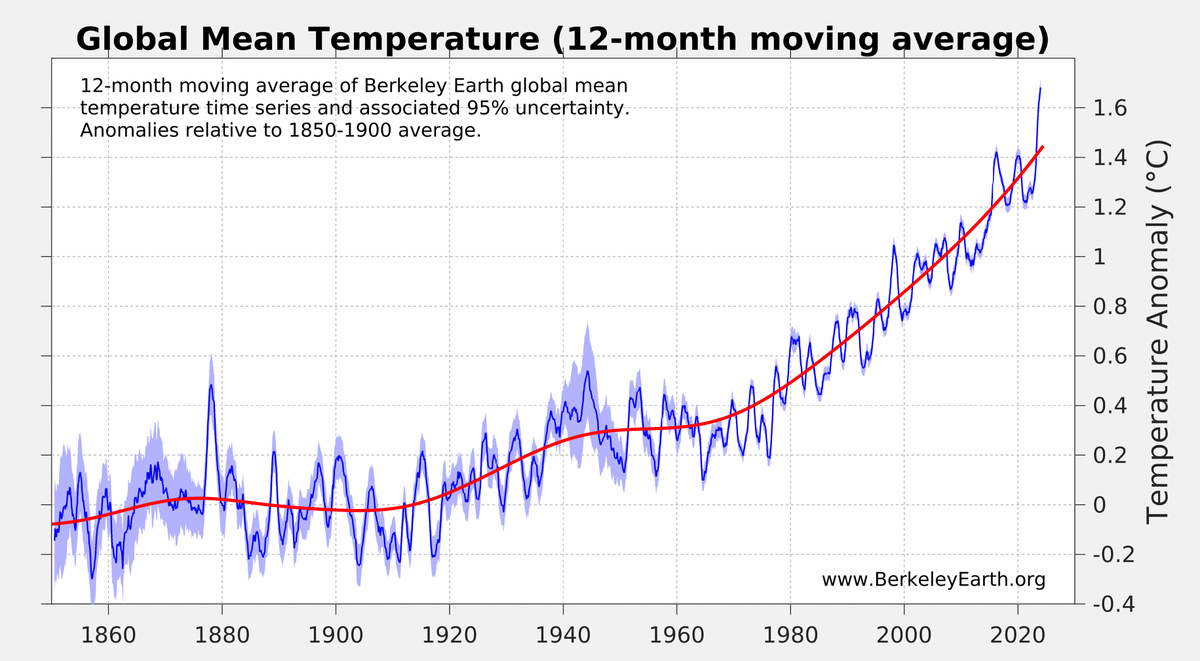
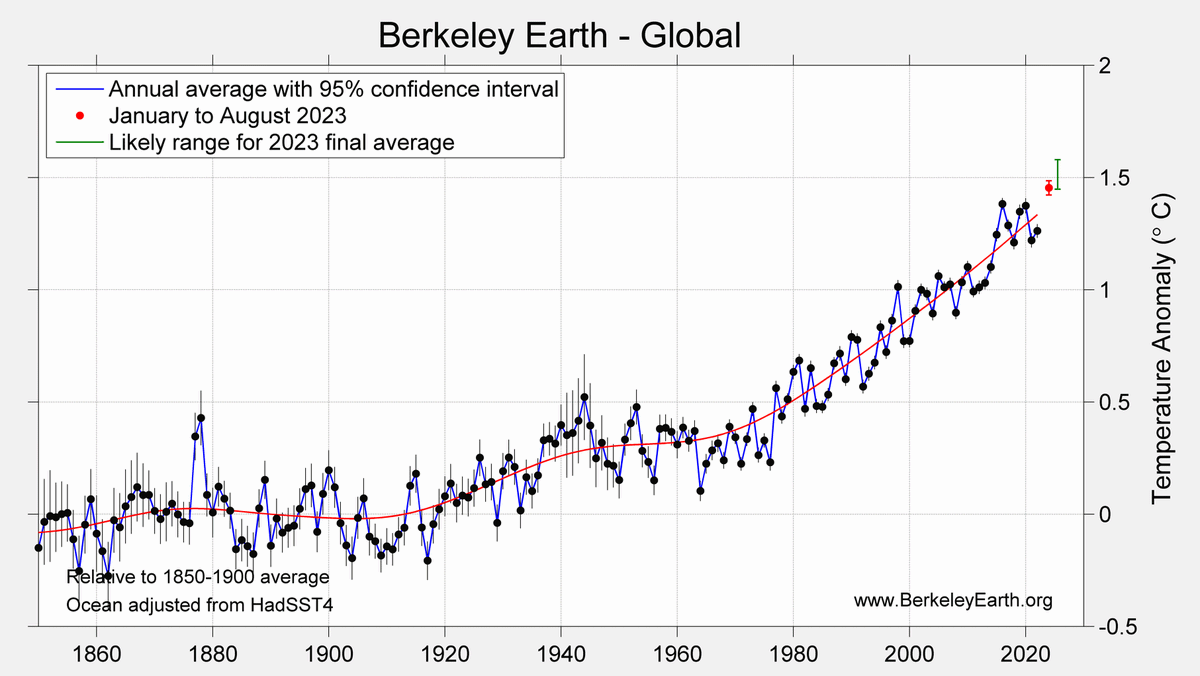
With the strengthening El Niño and June, July, and August all setting new monthly records by large margins, it has become nearly certain that the annual average for 2023 will set a new record high for the instrumental period (>99% likelihood).
7/
7/

The recent extreme conditions have led to another upward revision to our forecast for 2023.
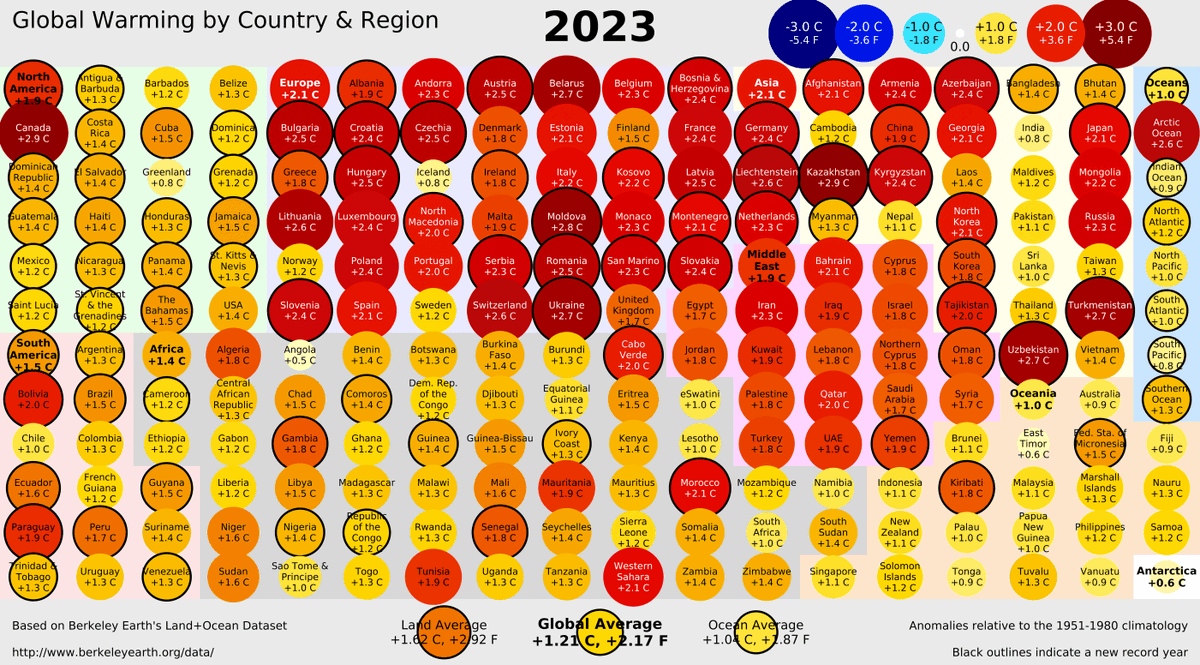
In addition to 2023 almost certainly becoming the warmest directly measured year, we now estimate roughly even odds that 2023 is at least 1.5 °C (2.7 °F) above the 1850-1900 baseline.
8/
In addition to 2023 almost certainly becoming the warmest directly measured year, we now estimate roughly even odds that 2023 is at least 1.5 °C (2.7 °F) above the 1850-1900 baseline.
8/
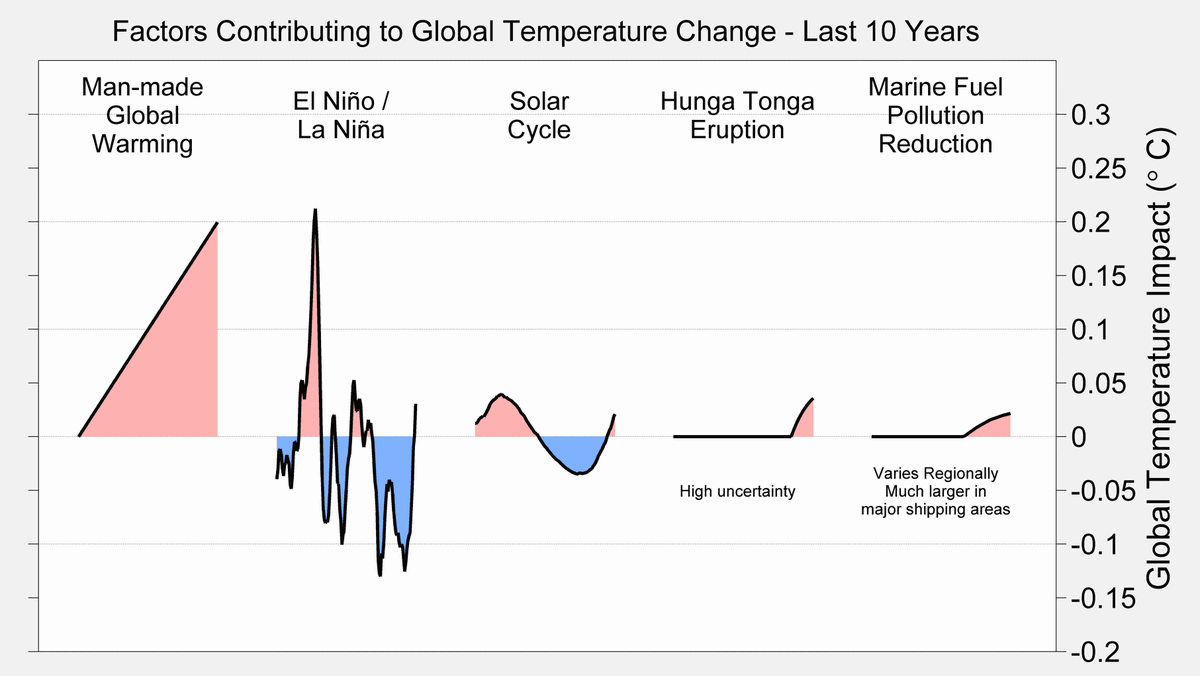
This current period of record warmth is driven by a combination of man-made & natural factors.
The most significant of these are man-made global warming, due to accumulating greenhouse gases, and the natural variability associated with the transition from La Niña to El Niño.
9/
The most significant of these are man-made global warming, due to accumulating greenhouse gases, and the natural variability associated with the transition from La Niña to El Niño.
9/
For more information on temperature patterns during August 2023, please see our monthly temperature report:
10/10berkeleyearth.org/august-2023-te…
10/10berkeleyearth.org/august-2023-te…
• • •
Missing some Tweet in this thread? You can try to
force a refresh