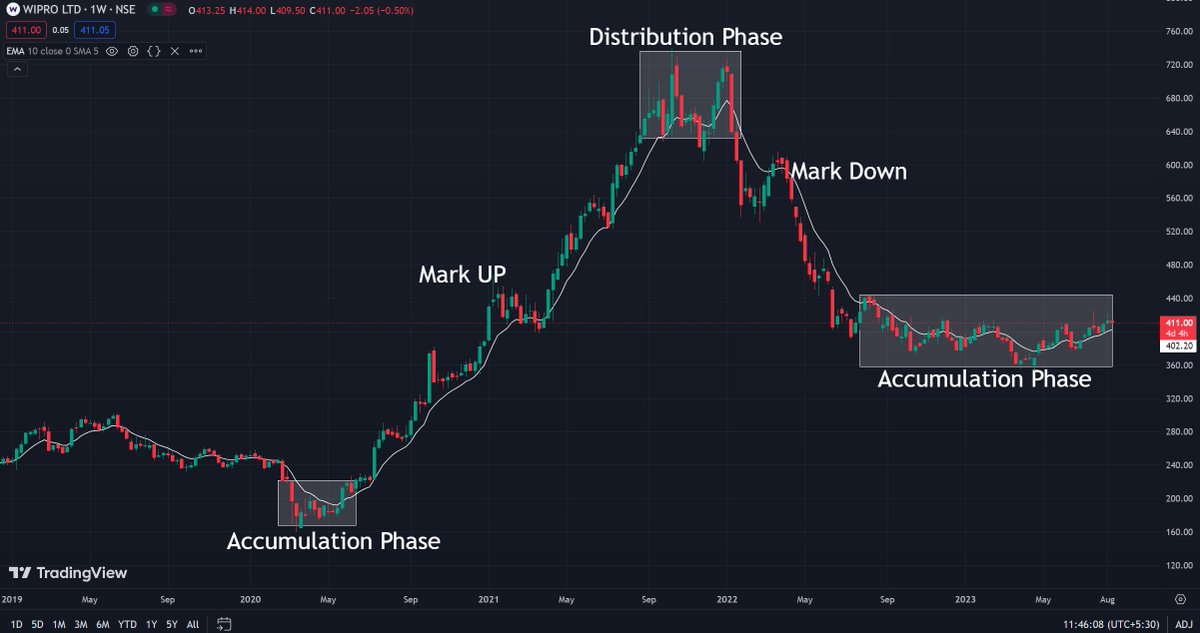
1/9
Everyone uses Support and Resistance but rarely one uses it correctly.
A 🧵to help you master the S&R concept.
#NiftyFifty #NiftyBank #StockMarket
Everyone uses Support and Resistance but rarely one uses it correctly.
A 🧵to help you master the S&R concept.
#NiftyFifty #NiftyBank #StockMarket

2/9
Support: A price level where a security tends to stop falling, indicating strong buying interest.
Resistance: A price level where a security tends to stop rising, indicating strong selling interest.


Support: A price level where a security tends to stop falling, indicating strong buying interest.
Resistance: A price level where a security tends to stop rising, indicating strong selling interest.


3/9
How to draw S/R?
There should be multiple touch points from that level
If that level is round no. like 100/500/800/1000 then it establishes that it is a strong S/R level.


How to draw S/R?
There should be multiple touch points from that level
If that level is round no. like 100/500/800/1000 then it establishes that it is a strong S/R level.


4/9
Historical Relevance:
Prior highs and lows, especially those tested multiple times, often serve as strong support or resistance levels.
Historical Relevance:
Prior highs and lows, especially those tested multiple times, often serve as strong support or resistance levels.

5/9
Trendlines also tend to be very effective S&R especially when the market is trending.
This is bcoz a stock while in trend forms HH &HL/LH &LL and the price respects these levels forming a trendline.
Trendlines also tend to be very effective S&R especially when the market is trending.
This is bcoz a stock while in trend forms HH &HL/LH &LL and the price respects these levels forming a trendline.

6/9
When a support is broken it becomes resitence and vice versa.
This is because of market memory and trader psychology


When a support is broken it becomes resitence and vice versa.
This is because of market memory and trader psychology


7/9
Zones:
Instead of a precise line, consider support and resistance as zones.
Prices might pierce a level slightly before reversing, so give some leeway.


Zones:
Instead of a precise line, consider support and resistance as zones.
Prices might pierce a level slightly before reversing, so give some leeway.


8/9
Time Frame:
S&R levels on longer TF (e.g. daily, weekly) are more effective than those on shorter TF (e.g. 5 mins).
Contd..
Time Frame:
S&R levels on longer TF (e.g. daily, weekly) are more effective than those on shorter TF (e.g. 5 mins).
Contd..
9/9
Please Follow @_AsthaTrade for more such content
Please RT, Like, and share the first tweet.
Comment below with your queries.
We will be happy to help.
Please Follow @_AsthaTrade for more such content
Please RT, Like, and share the first tweet.
Comment below with your queries.
We will be happy to help.
• • •
Missing some Tweet in this thread? You can try to
force a refresh

 Read on Twitter


