Jeremy Glover Profile picture
Sep 17, 2023 6 tweets 3 min read Read on X
I generated a population heat map for Chicago using a cool dataset that places people inside residential building footprints rather than census blocks. This yields a much more realistic view of population density. Lots of interesting things to observe. (1/6) Chicago population heat map for 2020
This pocket of Streeterville ⬇️ has the highest population density in the city, followed by Gold Coast, Lakeshore East, and South Loop. Next after that is a long and narrow strip from Lakeview to Uptown along the lakefront. (2/6) An oblique aerial view of Streeterville. The area roughly bounded by Columbus Ave, Huron Street, Navy Pier, and the Chicago River is highlighted.
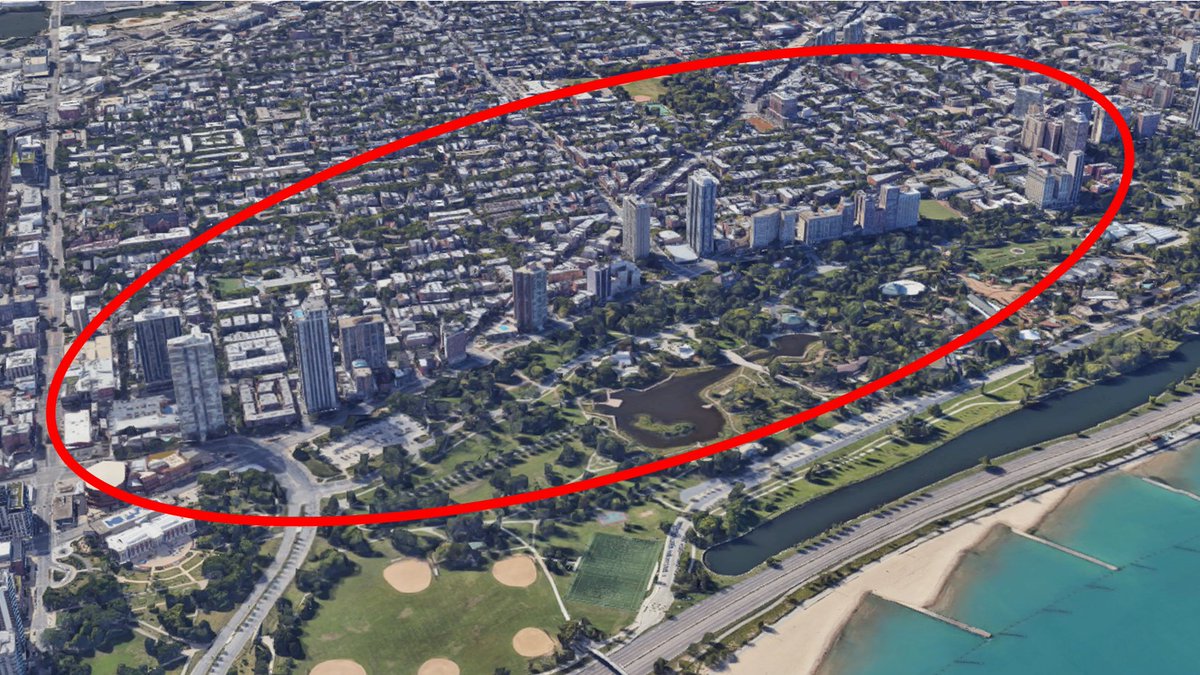
This stretch of the lakefront in Lincoln Park is dramatically underbuilt compared to the rest of the North Side. Not hard to guess why. (3/6) Lincoln Park lakefront, with the area along Clark Street circled.
Some other density hot spots are Little Village, Rogers Park, Devon Street in West Ridge, Albany Park near the Brown line, and the lakefront high rises in Kenwood and Hyde Park.

Also showing up bright: the Pavilion Apartments near O'Hare! I didn't know they existed. (4/6) The Pavilion Apartments in the O'Hare community area
On the flip side, the darker areas are either non-residential, places built at lower densities, and places that have suffered disinvestment. Particularly notable are Englewood and West Englewood. The arrow points to "the area" where Norfolk Southern displaced 400 families. (5/6) A population heat map of Chicago, zoomed in on the Englewood and West Englewood community areas. A red arrow points to an area that was the subject of a 2018 documentary called "The Area."
Credit for the underlying data goes to Forest Gregg, who has departed these shores for the Other Place (fgregg[at]mastodon[dot]social). It's a very neat dataset that you can find at the link below. I used the 5-per-dot version. (6/6)
bunkum.us/chicago-dots/

• • •

Missing some Tweet in this thread? You can try to force a refresh
 

Keep Current with Jeremy Glover

Jeremy Glover Profile picture

Stay in touch and get notified when new unrolls are available from this author!

Read all threads

This Thread may be Removed Anytime!

PDF

Twitter may remove this content at anytime! Save it as PDF for later use!

Try unrolling a thread yourself!

how to unroll video
  1. Follow @ThreadReaderApp to mention us!

  2. From a Twitter thread mention us with a keyword "unroll"
@threadreaderapp unroll

Practice here first or read more on our help page!

More from @JGrantGlover

Jun 17, 2024
🧵Four views of @DivvyBikes ride data, from June 2013 to May 2024. I've always wanted to compile this data, and I finally did it. A number of interesting things pop up.

1) Member rides grew steadily from 2013-2017 before leveling off, but non-member rides were stable from Day 1.


Image
Image
Image
Image
2) After 2017, seasonal patterns stabilized and the 2019 system expansion didn't seem to impact much.
3) COVID upended everything! Member rides plummeted but non-member rides surged.
4) The launch of e-bikes boosted rides across the board.
5) The non-member COVID surge started to taper in 2023, but member rides grew. This suggests that some of the newbies became coverts. You love to see it!
6) We may have reached a new equilibrium where annual rides stabilize. Which begs the question: how do we keep it growing?
Read 4 tweets
Mar 5, 2024
Yesterday was Chicago's 187th birthday. ✶🎂✶

This 1836 plat shows the city's extent around the time of incorporation, and how it was laid out. I overlaid modern streets and shorelines to see how things have changed, and how much they've stayed the same!

Some observations: 🧵 Image
Aside from the highway, the street network for Chicago's historic core has changed remarkably little. There were just two bridges in the vicinity, at Kedzie and Dearborn. Image
Several major changes to the Chicago River can be seen. On the left you can see the original course of the South Branch before it was straightened in 1929. On the right is the North Branch before the canal that created Goose Island was cut. Image
Read 7 tweets
Feb 8, 2024
By my calculations, there were 3,932 parcels in Chicago that were zoned differently in 2023 than 2014. That's 0.64% of all parcels.

Of those, I considered 29.5% to be upzones and 23.2% to be downzones. More than a third of the upzones happened in West Town or Logan Square.

Image
Image
Image
West Town leads the pack for upzones in large part because a four-block stretch of Grand Ave just north of the Kinzie Industrial Corridor was rezoned from light manufacturing to denser business and commercial in 2014. Image
On the flipside, and somewhat surprisingly, the Near West Side leads for downzones. This is due to a large chunk of parcels just west of the IMD that was downzoned from multifamily residential to townhome residential. Image
Read 4 tweets
Nov 30, 2023
Check out this fascinating 1946 map from a never-finished Chicago comprehensive plan. Among other things, it shows proposed expressways and new community area boundaries. Laying those features over a modern map makes for an interesting comparison. 🧵
Image
Image
The vision for the city's expressway network was incredibly expansive. Many were (thankfully) never built, including:
- two crosstown routes, roughly along Cicero and California/Western
- a Stony Island route connecting the Bishop Ford to DLSD
- Extensions on both ends of DLSD
Image
Image
The plan includes 59 community areas that are more aligned with logical boundaries (like railroads and highways) than the current 77 community areas. The text describes them as mini cities containing all the local amenities people need (schools, retail, hospitals, etc). Image
Read 5 tweets

Did Thread Reader help you today?

Support us! We are indie developers!


This site is made by just two indie developers on a laptop doing marketing, support and development! Read more about the story.

Become a Premium Member ($3/month or $30/year) and get exclusive features!

Become Premium

Don't want to be a Premium member but still want to support us?

Make a small donation by buying us coffee ($5) or help with server cost ($10)

Donate via Paypal

Or Donate anonymously using crypto!

Ethereum

0xfe58350B80634f60Fa6Dc149a72b4DFbc17D341E copy

Bitcoin

3ATGMxNzCUFzxpMCHL5sWSt4DVtS8UqXpi copy

Thank you for your support!

Follow Us!

:(