Christoph Molnar Profile picture
Oct 2 10 tweets 3 min read Twitter logo Read on Twitter
Which one is the better machine learning interpretation method?

LIME or SHAP?

Despite the gold rush in interpretability research, both methods are still OGs when it comes to explaining predictions.

Let's compare the giants.
Both LIME and SHAP have the goal of explaining a prediction by attributing it to the individual features. Meaning each feature gets a value.

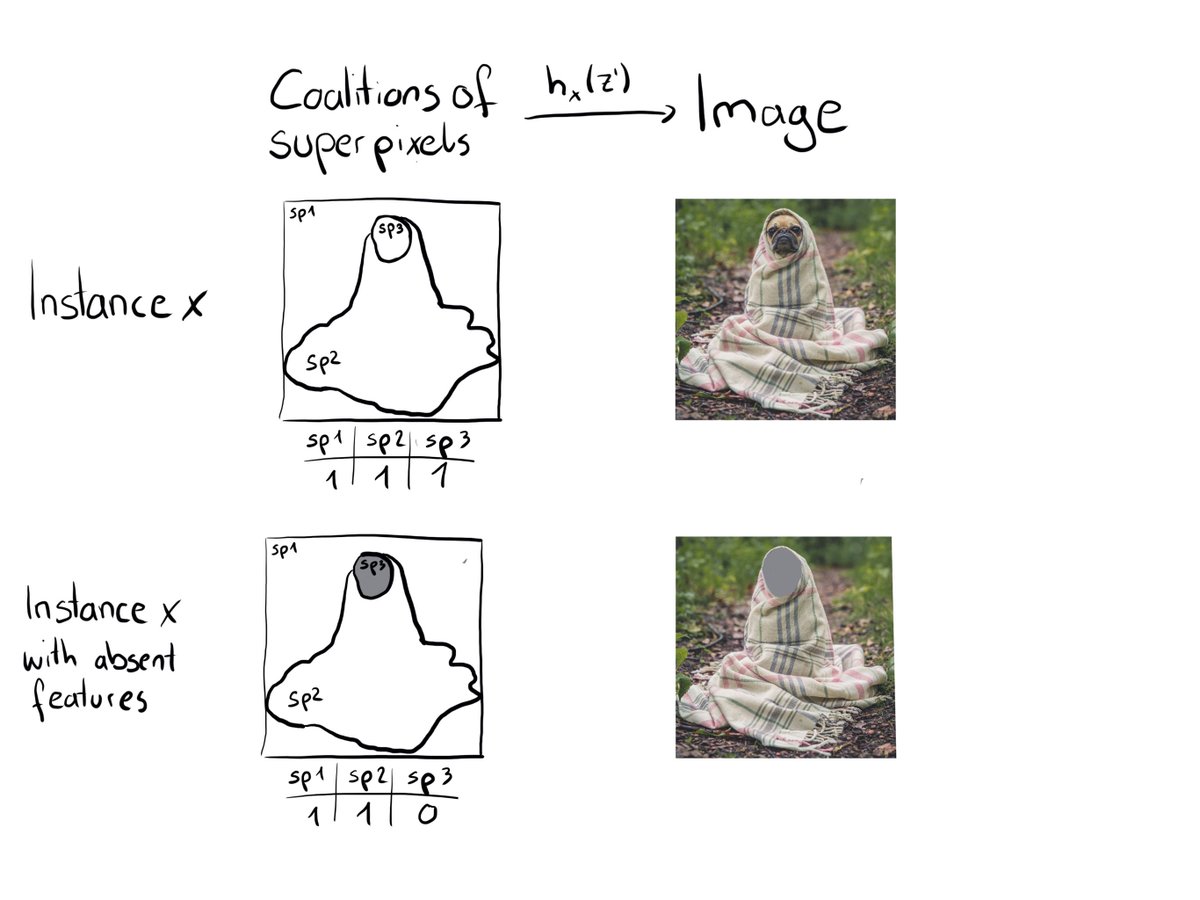
Both are model-agnostic and work for tabular, image, and text data.

However the philosophies of how to make these attributions differ. Image
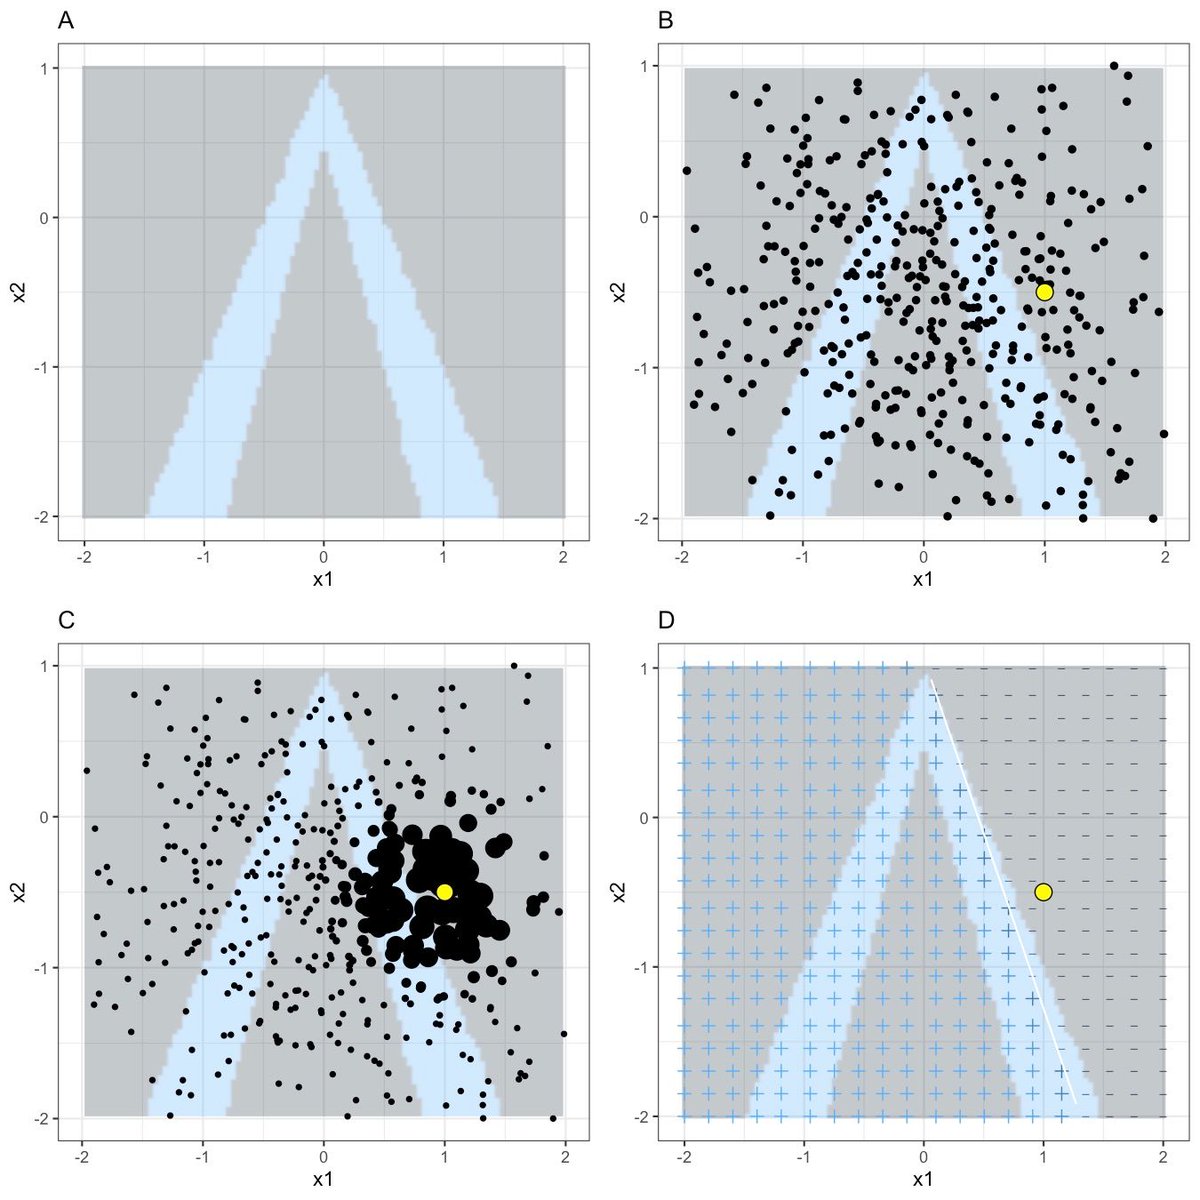
LIME (Local Interpretable Model-agnostic Explanations ) is a local surrogate model. Motivation: The prediction function is complex, but locally it might be nicely explained by, for example, a linear model.

LIME works by sampling data and fitting such a locally weighted model. Image
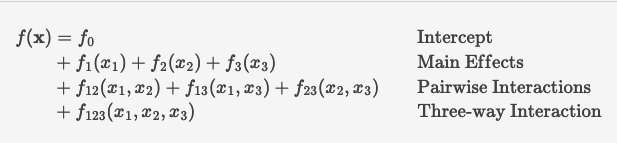
SHAP (SHapley Additive exPlanations ) is rooted in cooperative game theory: Each feature is seen as a team player and the prediction is the payout of a game. By simulating each player's contribution to different team constellations a "fair" distribution of the prediction. Image
SHAP and LIME have implementations in R and Python and lively communities. For both, you'll find tons of extensions in the forms of research papers and sometimes code.
But in the end, I'd pick SHAP over LIME.

Here are my 3 reasons:

- Neighborhood problem in LIME
- SHAP's firmer theoretic grounding
- SHAP's vast ecosystem
Both SHAP and LIME have their problems. But LIME has a problem that's a deal-breaker for me:

LIME requires local weighting with a kernel. The width of the kernel steers how local the model is. But there's no definite guide for how local the linear model should be. It's arbitrary Image
For SHAP, in contrast, it's clearly defined what the target to be estimated is: It's Shapley values from game theory. You may agree or disagree with using Shapley values for explaining predictions, but at least we know what we are dealing with.
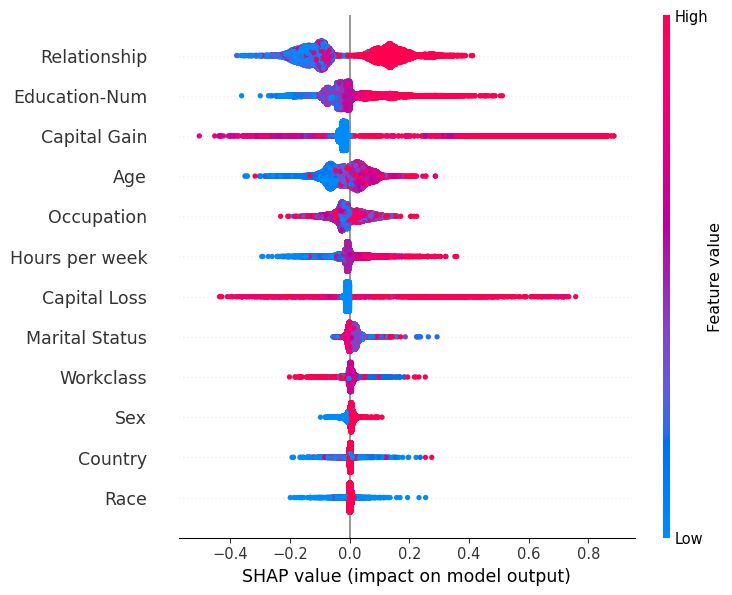
SHAP also allows for global interpretations by aggregating the SHAP values across data points to estimate feature importances and effects, study interactions, and cluster data. In theory, you could do the same with LIME, but it's just perfectly implemented by the shap library. Image
Summary: SHAP wins. LIME's neighborhood choice is too problematic. SHAP shines thanks to a vast ecosystem, global explanations, and firmer theoretical groundwork.

That's why I wrote the book Interpreting Machine Learning Models With SHAP and not with LIME.

• • •

Missing some Tweet in this thread? You can try to force a refresh
 

Keep Current with Christoph Molnar

Christoph Molnar Profile picture

Stay in touch and get notified when new unrolls are available from this author!

Read all threads

This Thread may be Removed Anytime!

PDF

Twitter may remove this content at anytime! Save it as PDF for later use!

Try unrolling a thread yourself!

how to unroll video
  1. Follow @ThreadReaderApp to mention us!

  2. From a Twitter thread mention us with a keyword "unroll"
@threadreaderapp unroll

Practice here first or read more on our help page!

More from @ChristophMolnar

Sep 26
Machine learning interpretability from first principles:

• A model is just a mathematical function
• The function can be broken down into simpler parts
• Interpretation methods address the behavior of these parts

Let's dive in. Image
A machine learning model is a mathematical function. It takes a feature vector and produces a prediction.

But writing down the function isn't practical, especially for complex models like neural networks or random forests. Even if you could, the formula isn't interpretable
But we don't have to deal with the original formula that is induced by the machine learning algorithm.

Any mathematical function can be broken down into simpler parts, such as main effects and interactions. This is known as functional decomposition. Image
Read 9 tweets
Jul 25
My favorite analogy to explain SHAP from explainable AI.

We start with a one-dimensional universe. Objects can move up or down. For better display, we move them left (=down) or right (=up).

There are only two objects in this simplified universe

A center of gravity
A planet Image
The center of gravity is the expected prediction for our data E(f(X)). It’s the center of gravity in the sense that it’s a “default” prediction, meaning if we know nothing about a data point, this might be where we expect the planet (=the prediction for a data point) to be. Image
The planet can only move away from the center of gravity if forces act upon it. The forces are the feature values. Let’s say we know x1=4.1 and this acts upon the prediction and pushes the planet downwards.

This force is what we aim to quantify with SHAP values. Image
Read 7 tweets
May 9
Bayesian modeling from first principle and memes.

Let's go.
The principle from which you can understand a lot of the basics in Bayesian modeling:

In Bayesian statistics, model parameters are random variables.
Therefore, modeling means estimating P(θ|X), the parameter distribution for θ given the data X. Image
Read 12 tweets
May 2
It took me a long time to understand Bayesian statistics.

So many angles from which to approach it: the Bayes' Theorem, probability as a degree of belief, Bayesian updating, priors and posteriors, ...

But my favorite angle is the following first principle :
> In Bayesian statistics, model parameters are random variables.

The "model" here can be a simple distribution.

The mean of a distribution, the coefficient in logistic regression, the correlation coefficient – all these parameters are variables with a distribution.
Let's follow the implications of the parameters-are-variables premise to its full conclusion:

• Parameters are variables.
• Therefore, modeling means estimating the parameter distribution given the data. P(θ|X)
• But there is a problem.
Read 9 tweets
May 1
Modeling Mindsets summarized

Statistical Modeling – Reason Under Uncertainty
Frequentism - Infer "True" Parameters
Bayesianism – Update Parameter Distributions
Likelihoodism – Likelihood As Evidence
Causal Inference – Identify And Estimate Causes
Machine Learning – Learn Algorithms From Data
Supervised Learning – Predict New Data
Unsupervised Learning – Find Hidden Patterns
Reinforcement Learning – Learn To Interact
Deep Learning - Learn End-To-End Networks
These are actually the chapter titles of my book Modeling Mindsets.

Which mindsets would you add? Image
Read 4 tweets
Apr 24
I make a living writing technical books about machine learning.

Naturally, I constantly ask myself what ChatGPT means for my job and how it can make my life easier.

Today I finally tried out GPT-4 to help me with a book draft.

A non-hype, real-world application of ChatGPT.
Context: I write a book about SHAP, a technique for explainable machine learning.

I have code examples, all the materials, and references, and a "bad draft" of the book exists.

It's already readable end-to-end, but it's a very sloppy draft with lots of errors and clutter.
The next step is to go through the bad draft and turn it into a good draft.

This includes removing clutter, fixing errors, improving the reading flow, etc.

It's tedious work that I don't always enjoy.

I've tried ChatGPT with GPT3.5 before to help me out, but I wasn't happy.
Read 12 tweets

Did Thread Reader help you today?

Support us! We are indie developers!


This site is made by just two indie developers on a laptop doing marketing, support and development! Read more about the story.

Become a Premium Member ($3/month or $30/year) and get exclusive features!

Become Premium

Don't want to be a Premium member but still want to support us?

Make a small donation by buying us coffee ($5) or help with server cost ($10)

Donate via Paypal

Or Donate anonymously using crypto!

Ethereum

0xfe58350B80634f60Fa6Dc149a72b4DFbc17D341E copy

Bitcoin

3ATGMxNzCUFzxpMCHL5sWSt4DVtS8UqXpi copy

Thank you for your support!

Follow Us on Twitter!

:(