How to describe distribution?
Skewness 🧵
Skewness 🧵
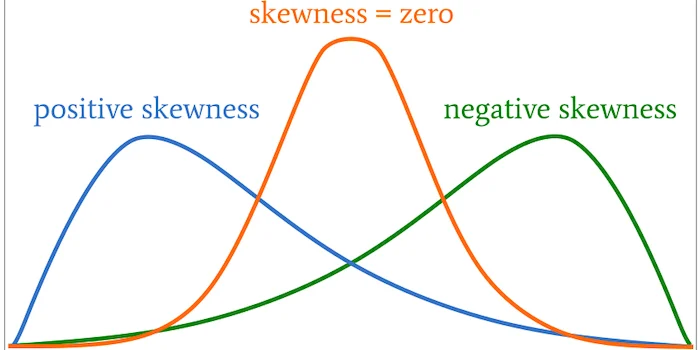
Skewness is a measure of the asymmetry of a distribution.
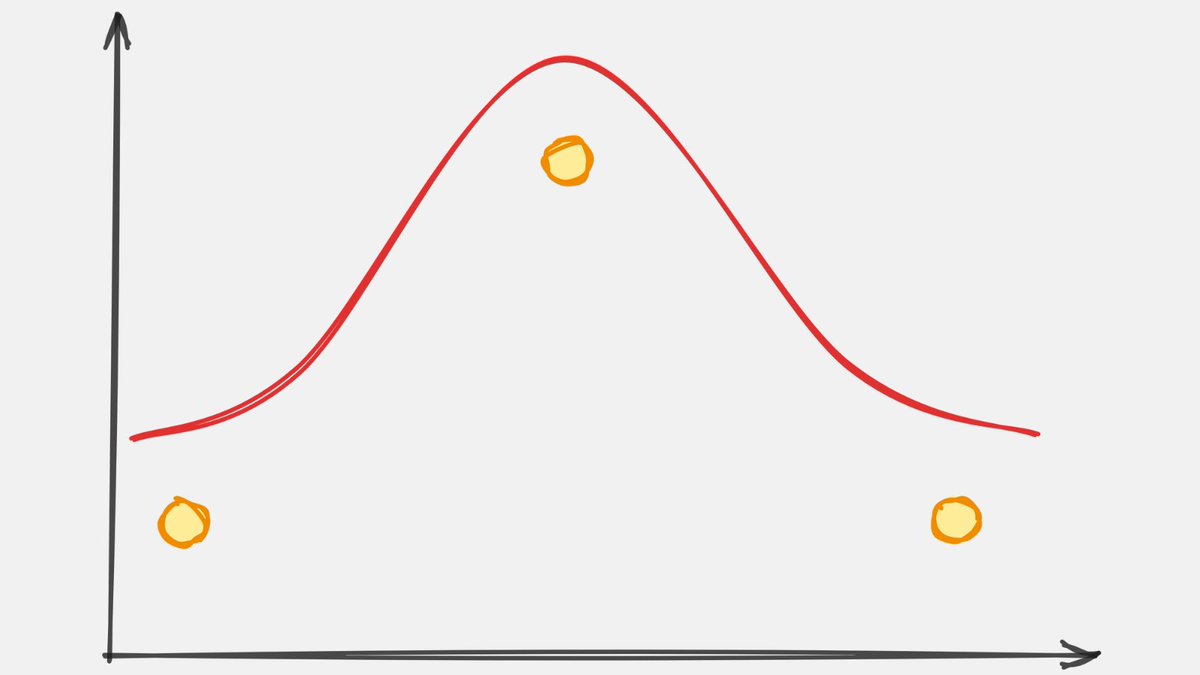
Distribution is symmetric if it looks the same to the left and right of the center point.
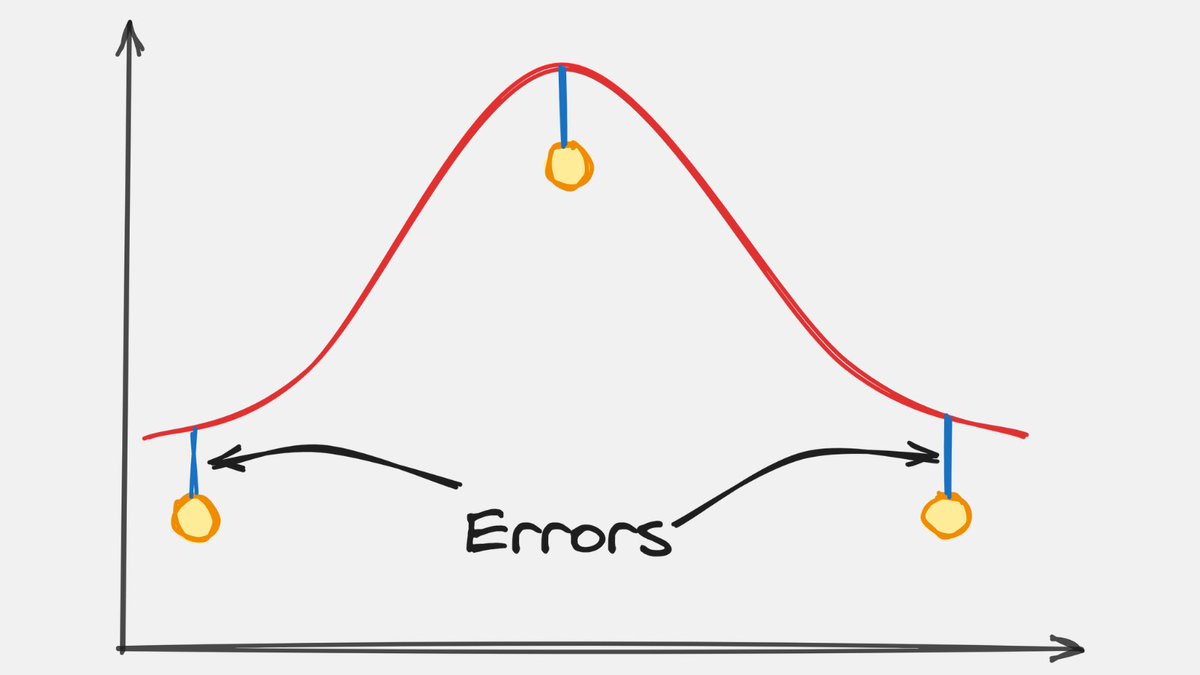
Skewness differentiates extreme values in one versus the other tail.
1/8
Distribution is symmetric if it looks the same to the left and right of the center point.
Skewness differentiates extreme values in one versus the other tail.
1/8
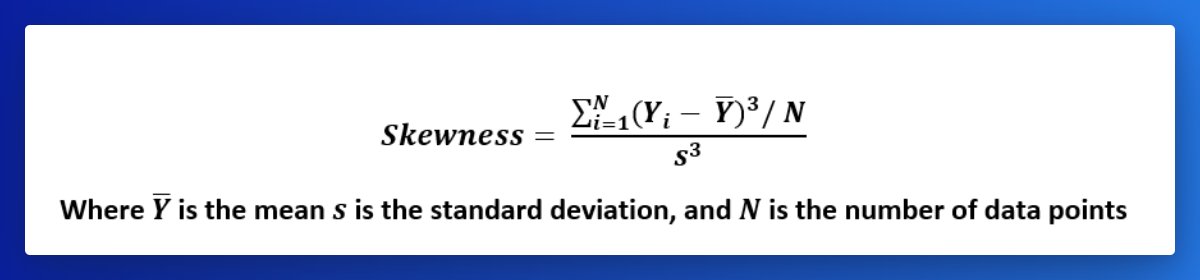
The formula to get the skewness:
2/8
2/8
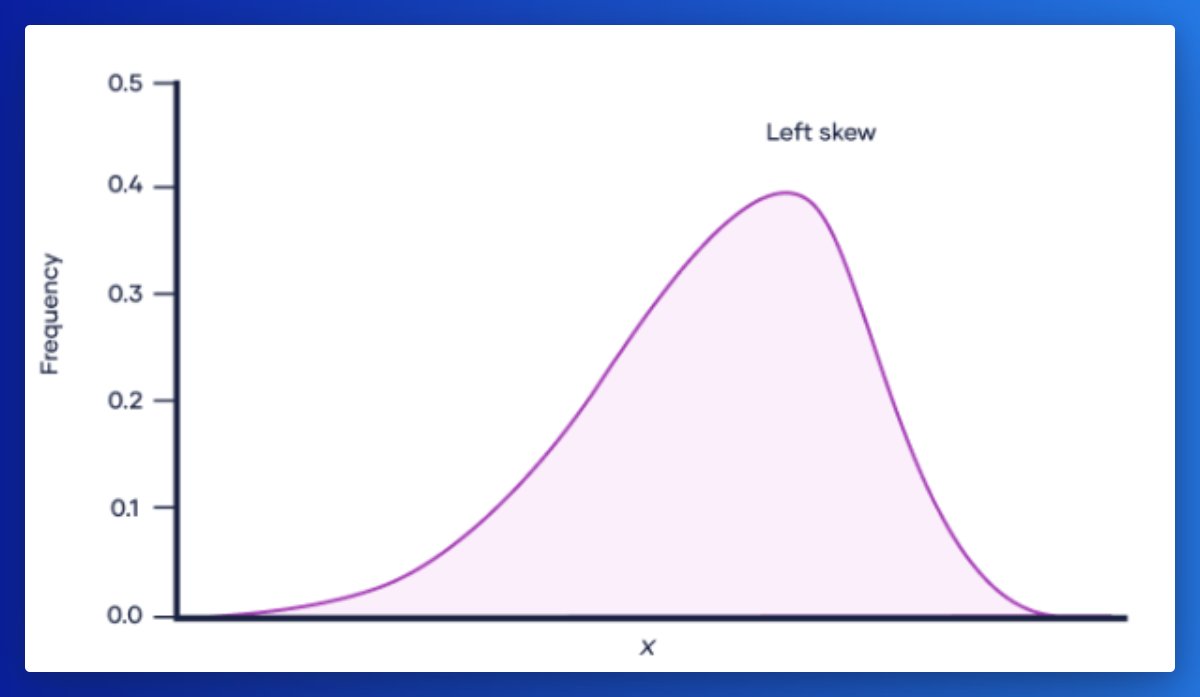
Left skew / Negative skew:
Negative values for the skewness indicate data that are skewed left - the left tail is long relative to the right tail.
The mean of a left-skewed distribution is almost always less than its median.
3/8
Negative values for the skewness indicate data that are skewed left - the left tail is long relative to the right tail.
The mean of a left-skewed distribution is almost always less than its median.
3/8
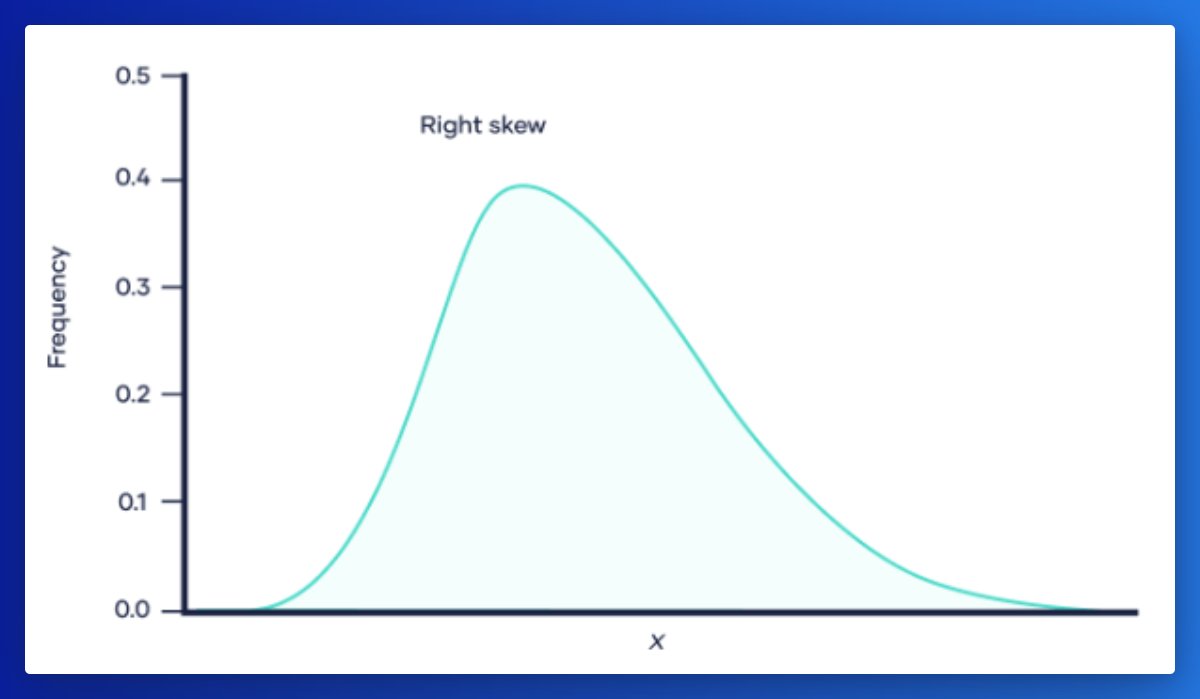
Right skew / Positive skew:
Positive values for the skewness indicate data that are skewed right - the right tail is long relative to the left tail.
Here the mean is almost always greater than the median.
Because extreme values affect the mean more than the median.
4/8
Positive values for the skewness indicate data that are skewed right - the right tail is long relative to the left tail.
Here the mean is almost always greater than the median.
Because extreme values affect the mean more than the median.
4/8
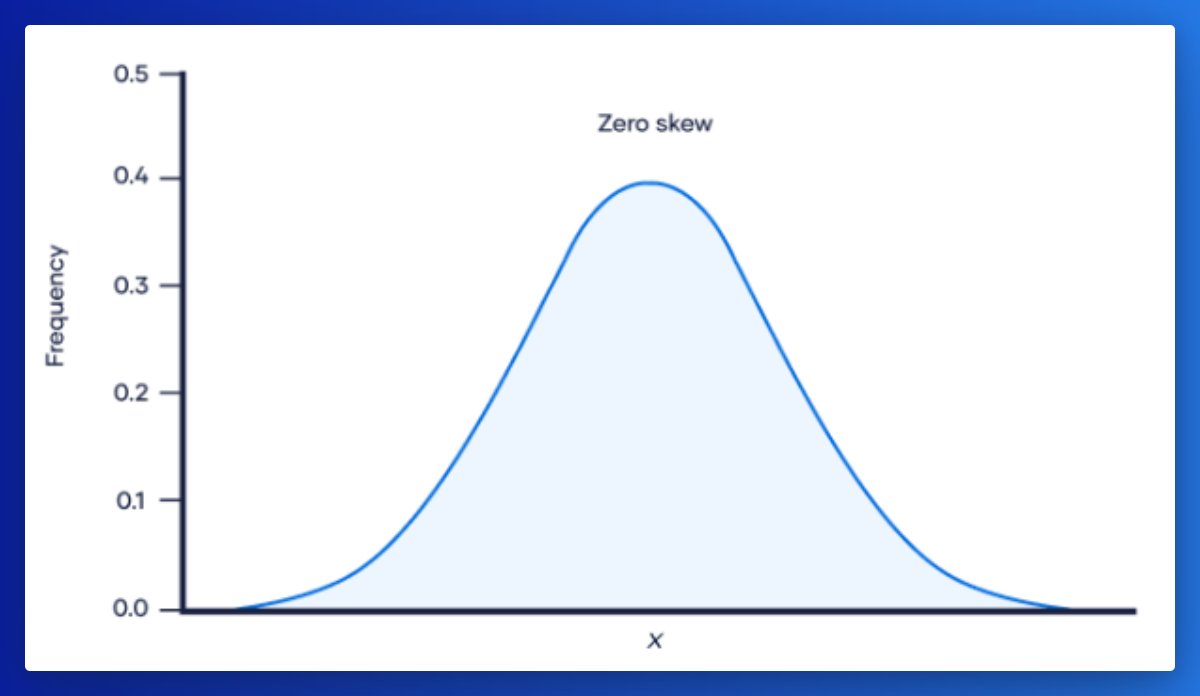
Zero skew:
When a distribution has zero skew, it is symmetrical. Its left and right sides are mirror images.
The skewness for a normal distribution is zero.
The mean = median
5/8
When a distribution has zero skew, it is symmetrical. Its left and right sides are mirror images.
The skewness for a normal distribution is zero.
The mean = median
5/8
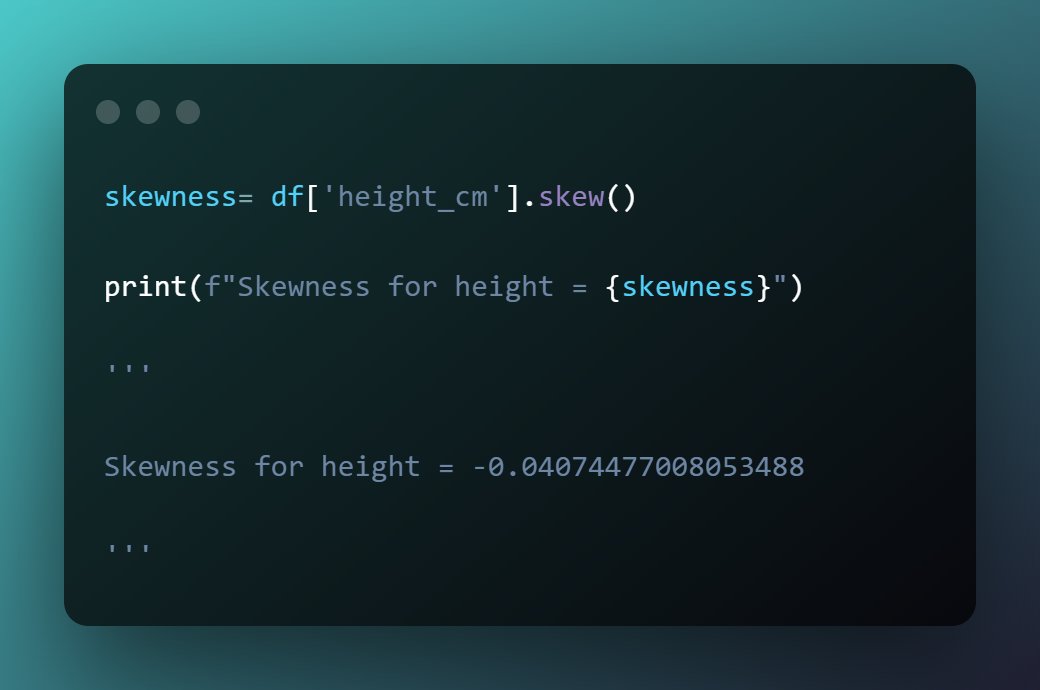
Pandas has a built-in method to calculate the skewness of the data.
Since the value is negative, the data is skewed to the left - the left tail is slightly longer than the right tail.
6/8
Since the value is negative, the data is skewed to the left - the left tail is slightly longer than the right tail.
6/8
That's it for today.
I hope you've found this thread helpful.
Follow me @levikul09 for more.
Like/Retweet the first tweet below for support, Thanks 😉
7/8
I hope you've found this thread helpful.
Follow me @levikul09 for more.
Like/Retweet the first tweet below for support, Thanks 😉
7/8
https://twitter.com/levikul09/status/1715671552254189727
If you haven't already, join our newsletter DSBoost.
We share:
• Interviews
• Podcast notes
• Learning resources
• Interesting collections of content
8/8dsboost.dev
We share:
• Interviews
• Podcast notes
• Learning resources
• Interesting collections of content
8/8dsboost.dev
• • •
Missing some Tweet in this thread? You can try to
force a refresh