I've been contacted by people working at YouTube for feedback on the analytics. (cc @hitsman & @BaerJustus)
So here is how some metrics in the analytics push creators to make huge mistakes:
So here is how some metrics in the analytics push creators to make huge mistakes:

Before I start, it's important to explain 2 notions I'll be using:
Signal: Important/meaningful information (what we're looking for)
Noise: Random/misleading information that hides the signal. (What we want to avoid)
Let's talk about a rampant issue in analytics: the average.
Signal: Important/meaningful information (what we're looking for)
Noise: Random/misleading information that hides the signal. (What we want to avoid)
Let's talk about a rampant issue in analytics: the average.

"My video has a higher CTR than usual but I have less views"
"My CTR & AVD are bad yet the video went viral"
"My AVD is great, but views aren't coming"
...
Sounds familiar?
If a metric causes more confusion than it provides clarity, it's a noisy metric.
"My CTR & AVD are bad yet the video went viral"
"My AVD is great, but views aren't coming"
...
Sounds familiar?
If a metric causes more confusion than it provides clarity, it's a noisy metric.
In this thread, I'll focus on 3 major metrics that are affected by the average problem:
- CTR
- AVD
- The retention graph
- CTR
- AVD
- The retention graph
To understand the whole process, this thread will be split into 2 sections:
I- Identifying problems
II- The solution
I- Identifying problems
II- The solution
I- Identifying problems
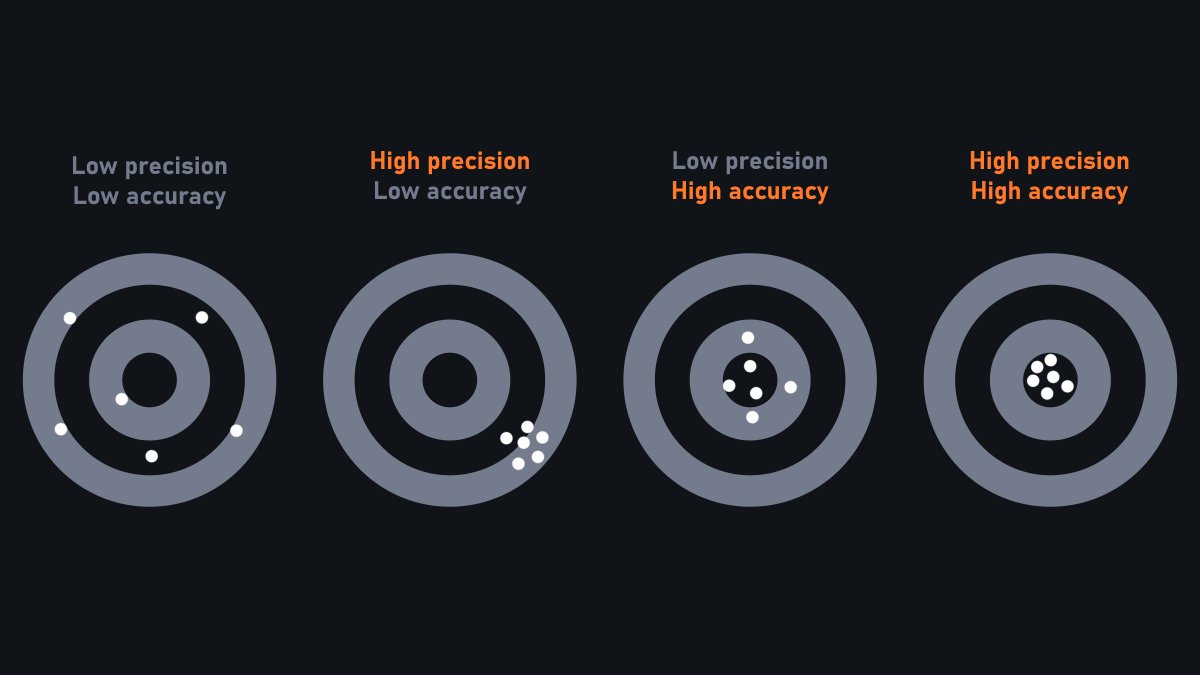
The human brain has a ton of biases, and unless extremely well designed, data and metrics tend to emphasize these biases even more.
This creates a huge problem: making one think they made an informed decision when in fact, it's the complete opposite.
The human brain has a ton of biases, and unless extremely well designed, data and metrics tend to emphasize these biases even more.
This creates a huge problem: making one think they made an informed decision when in fact, it's the complete opposite.
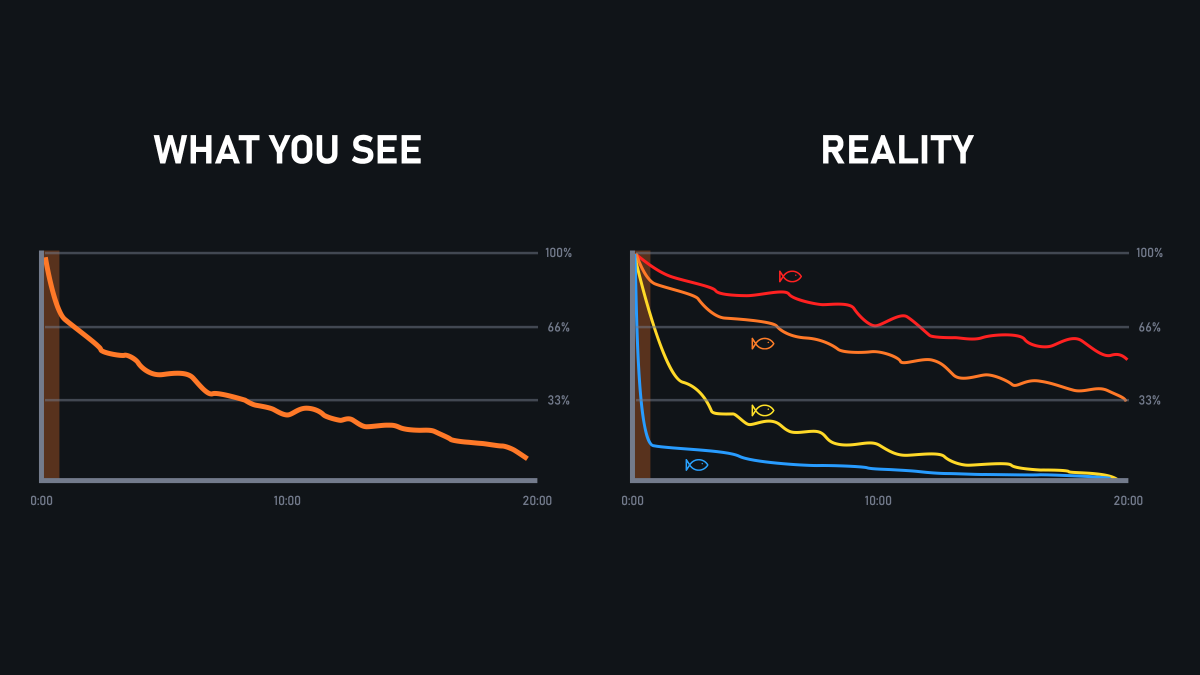
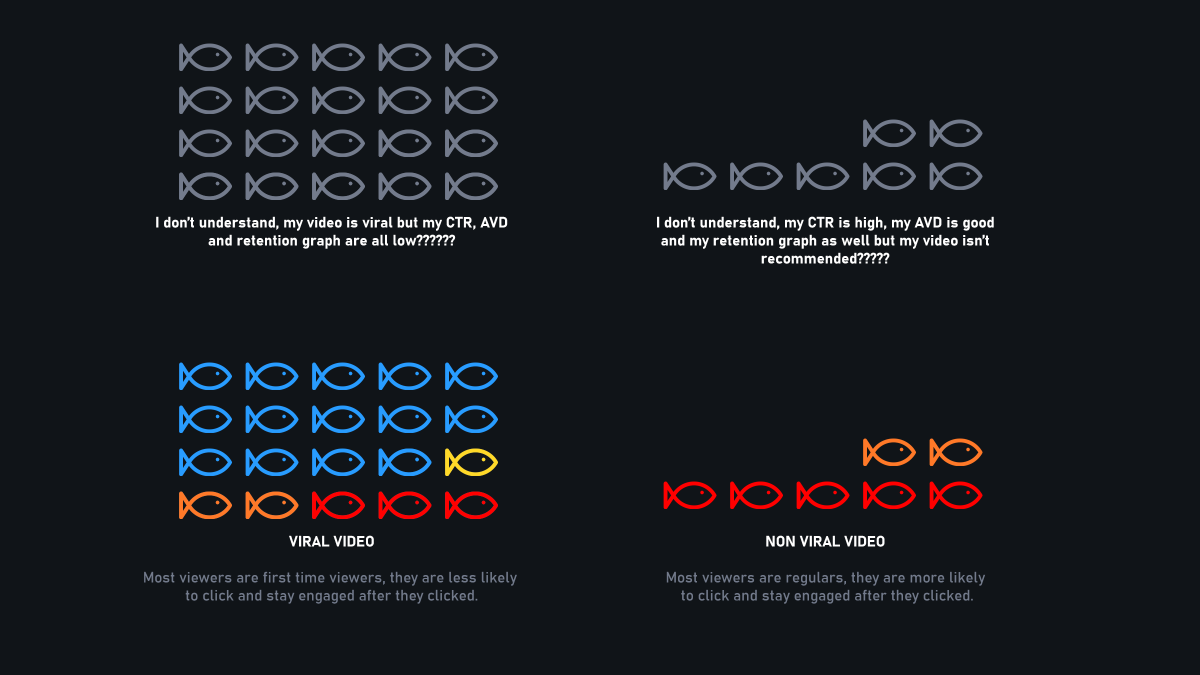
To me, there are 4 important categories of viewers (illustrated as fish):
Blue, yellow, orange, and red.
Depending on how you feed a blue viewer (with your content), it will evolve (or not) into a bigger "fish".
Blue, yellow, orange, and red.
Depending on how you feed a blue viewer (with your content), it will evolve (or not) into a bigger "fish".
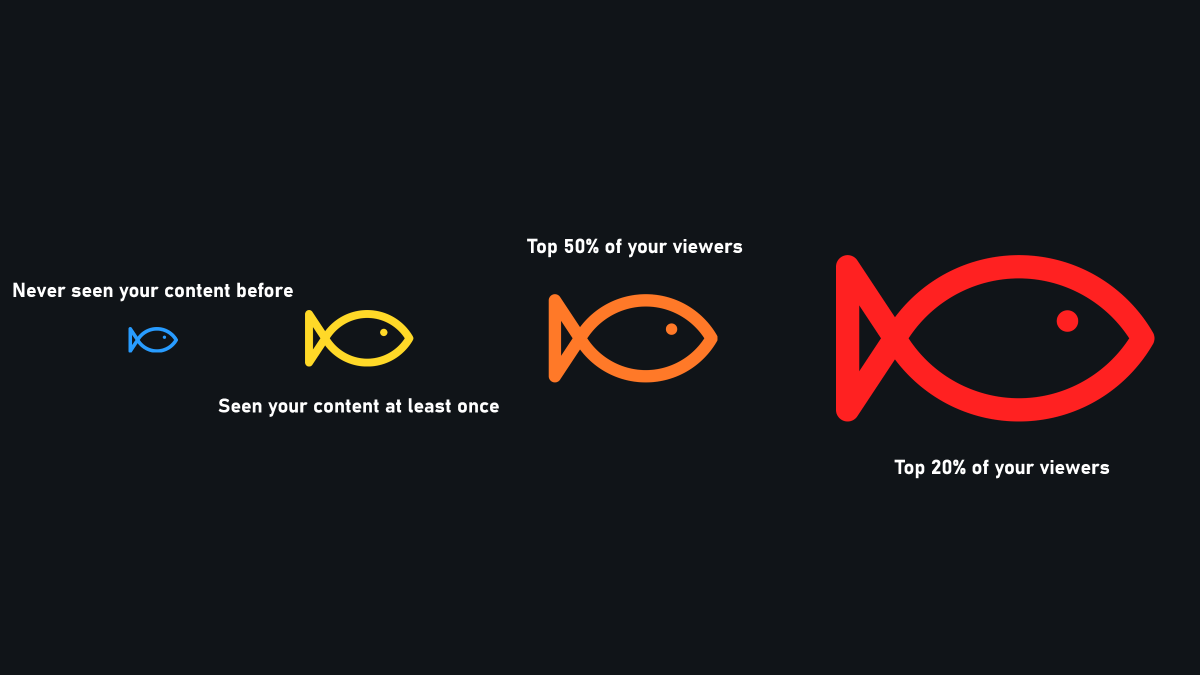
Keep that in mind; we're getting back to it later.
Now, let's talk about the 2 main problems of metrics using an average such as CTR & AVD that most people don't understand.
1) The average problem
2) The Simpson's paradox
Now, let's talk about the 2 main problems of metrics using an average such as CTR & AVD that most people don't understand.
1) The average problem
2) The Simpson's paradox
1) The average problem
Imagine you're a fisherman (content creator).
Every time you go out fishing (upload a video), you are using a bait (thumbnail + title).
At the end of the fishing session, you count how many fish (views) you caught.
Easy right?
Imagine you're a fisherman (content creator).
Every time you go out fishing (upload a video), you are using a bait (thumbnail + title).
At the end of the fishing session, you count how many fish (views) you caught.
Easy right?
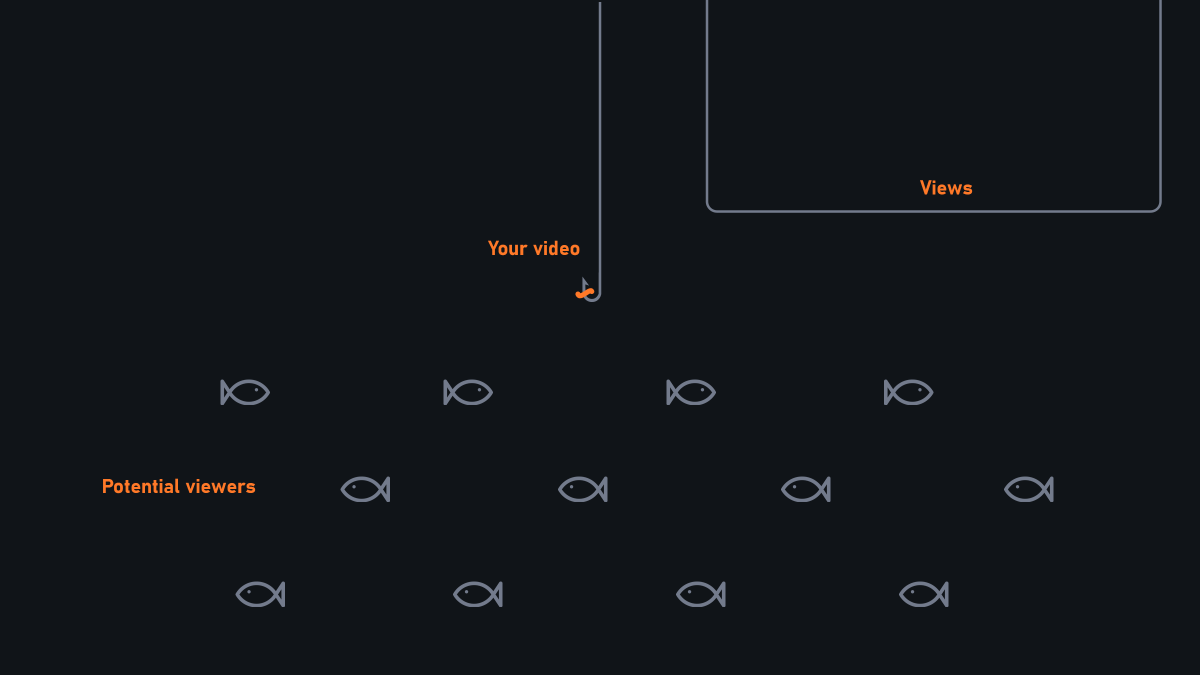
Here's CTR right now:
100 fish saw your bait (impressions), and 5 bite it (views).
-> 5% CTR
This is visually the information CTR gives you right now:
100 fish saw your bait (impressions), and 5 bite it (views).
-> 5% CTR
This is visually the information CTR gives you right now:

What's the problem? You might think.
Well, the problem is that there's no distinction made between the viewers, 1 view = 1 view.
Here's how it should be instead:
Well, the problem is that there's no distinction made between the viewers, 1 view = 1 view.
Here's how it should be instead:

Because it's an average of all viewers who clicked, YouTube right now is indirectly implying all viewer's attention is equal.
That's why so many creators are confused, they look at noise and think it's signal.
That's why so many creators are confused, they look at noise and think it's signal.
There are distinct subgroups of viewers that don't weigh the same (attention-wise) depending on what you're looking for.
If you could separate your loyal viewers from new viewers into subgroups, you could draw the right conclusions.
But the average of both? Pure noise.
If you could separate your loyal viewers from new viewers into subgroups, you could draw the right conclusions.
But the average of both? Pure noise.
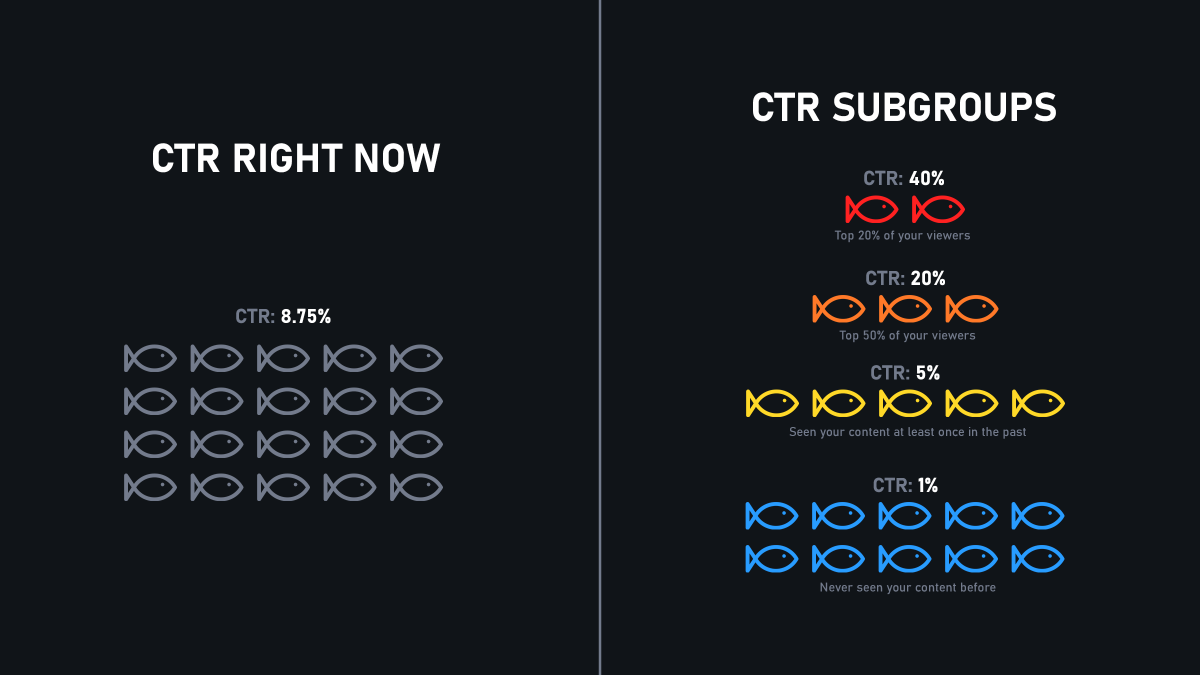
That's what I mean by "the signal is hidden behind an average."
The average of subgroups merged into one single group in that context doesn't make sense, it's pure noise.
The problem is exactly the same for other metrics, such as AVD or the retention graph.
The average of subgroups merged into one single group in that context doesn't make sense, it's pure noise.
The problem is exactly the same for other metrics, such as AVD or the retention graph.
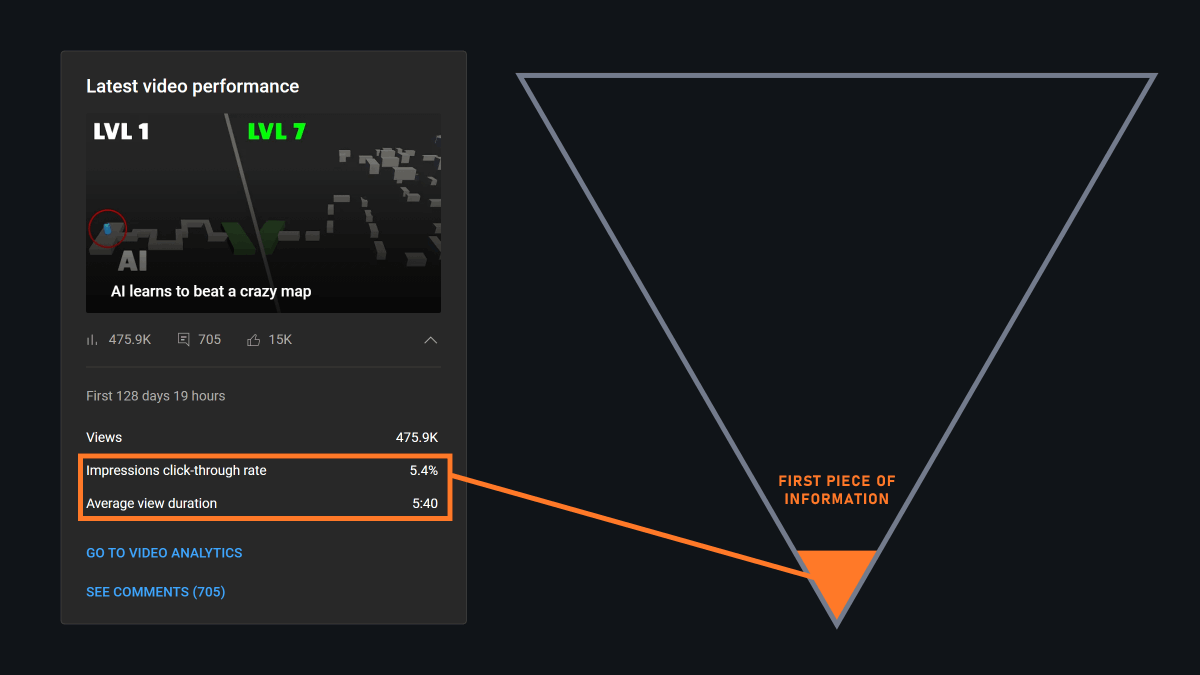
Speaking of subgroups, it makes the perfect transition for:
II - The Simpson's Paradox
When analyzing groups separately, data shows one trend, but when combined, an opposite trend emerges due to the groups' composition.
Here's a concrete example (from Wikipedia):
When analyzing groups separately, data shows one trend, but when combined, an opposite trend emerges due to the groups' composition.
Here's a concrete example (from Wikipedia):
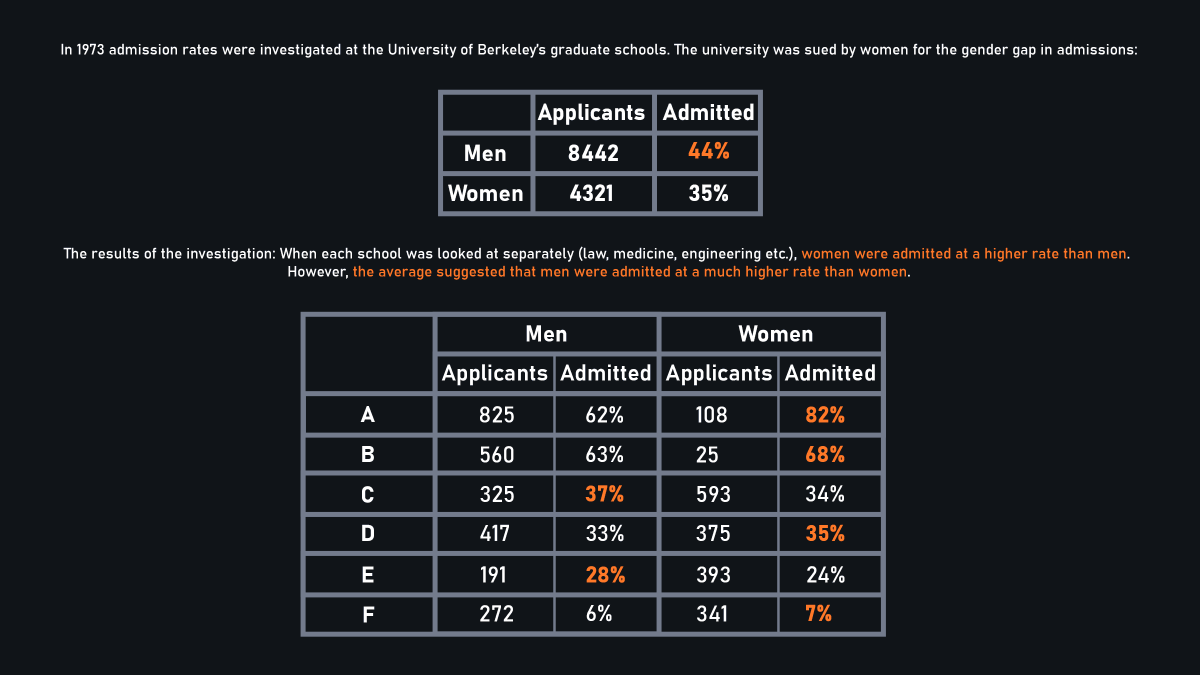
When the signal is hidden behind an average:
➙ men admitted rate > women admitted rate
When the signal is clear (subgroups):
➙ men admitted rate < women admitted rate
The literal opposite.
➙ men admitted rate > women admitted rate
When the signal is clear (subgroups):
➙ men admitted rate < women admitted rate
The literal opposite.
On YouTube, not only CTR/AVD are prone to the Simpson's Paradox, but they are also highlighted in the UX.
That's a major mistake YouTube made here.
It pushes creators not only to think these metrics are important but also becomes an integral part of their logic.
That's a major mistake YouTube made here.
It pushes creators not only to think these metrics are important but also becomes an integral part of their logic.
While the idea of getting people to click and make them watch until the end is valid, the moment one starts associating:
- "get people to click" with CTR
- "watch til the end" with AVD
That's where the corruption begins because again, subgroups are missing.
- "get people to click" with CTR
- "watch til the end" with AVD
That's where the corruption begins because again, subgroups are missing.
Hiding subgroups behind an average not only hides the signal behind noise, but also leads to reading an opposite conclusion.
Think of how disastrous it is when these uninformed decisions compound over time.
Think of how disastrous it is when these uninformed decisions compound over time.
I launched 2 channels this year, and on both the 1st video went viral.
They both have a low CTR/AVD/Retention.
Why? Because the channels had no prior audience (cold, blue viewers).
There are no red viewers (who watch longer since they trust the content) to lift the average up.
They both have a low CTR/AVD/Retention.
Why? Because the channels had no prior audience (cold, blue viewers).
There are no red viewers (who watch longer since they trust the content) to lift the average up.
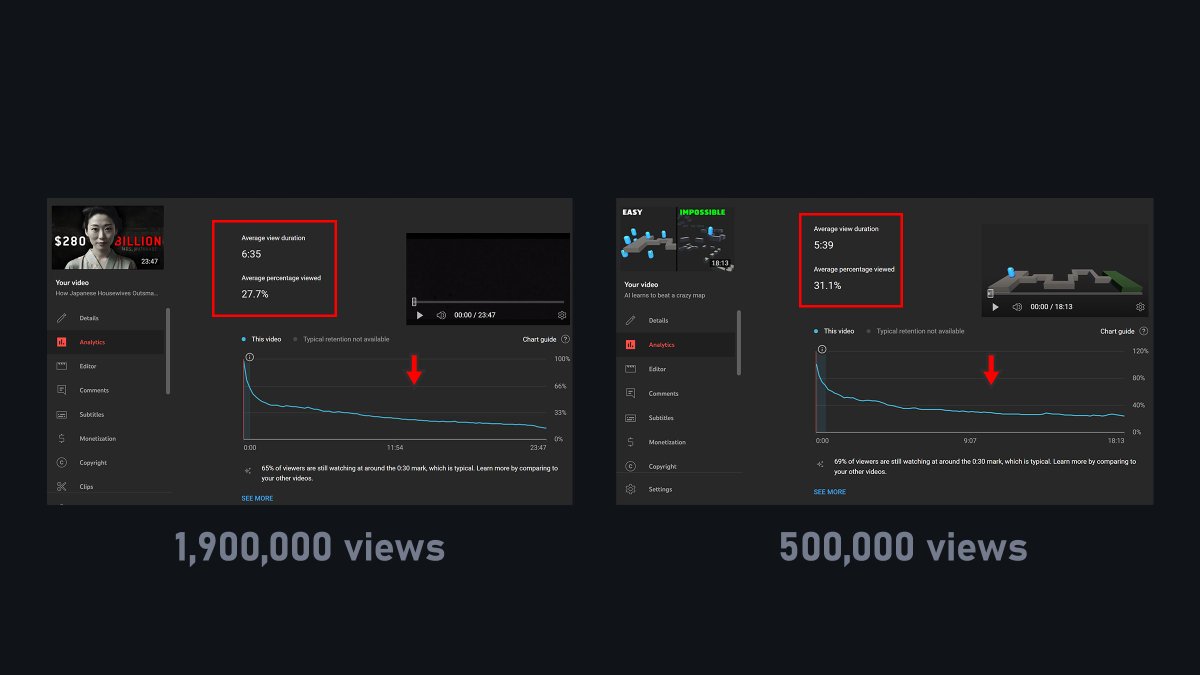
And from day 1, as you can see, the CTR on both videos has never been "good".
And both videos went viral.
And both videos went viral.
That's why when a video goes viral, CTR drops because the number of blue viewers (cold) increases drastically compared to red viewers.
Instead of increasing (more people choose to click), the CTR drops (more impressions but fewer clicks per 1k impressions) = Simpsons Paradox.
Instead of increasing (more people choose to click), the CTR drops (more impressions but fewer clicks per 1k impressions) = Simpsons Paradox.
II - The solution
It's simple: remove the average and work on designing relevant subgroups so we can compare apples with apples, not with bananas.
If we could compare only blue viewers' CTR across our videos for example, it would be a good starting point to look for patterns.
It's simple: remove the average and work on designing relevant subgroups so we can compare apples with apples, not with bananas.
If we could compare only blue viewers' CTR across our videos for example, it would be a good starting point to look for patterns.
But an average of so many subgroups without being able to check them independently is nothing but noise.
Thanks for coming to my Ted Talk.
Thanks for coming to my Ted Talk.
If you want to learn YouTube with me, 2 places:
Private (but free) newsletter:
Discord community (not free): forms.gle/pHLoE8Jjci2dFP…
web.wonoccino.com
Private (but free) newsletter:
Discord community (not free): forms.gle/pHLoE8Jjci2dFP…
web.wonoccino.com
• • •
Missing some Tweet in this thread? You can try to
force a refresh