Volume Price Analysis (VPA) For Beginners
🧵👇
🧵👇
Before we start, I need to shout out VPA by Anna Coulling
This book gave me the foundation to understand volume & create my volume analysis system
Some of the info in this thread is based on her book
This book gave me the foundation to understand volume & create my volume analysis system
Some of the info in this thread is based on her book
Volume Price Analysis Definition
VPA is the process of using both volume and price action to make inferences about the future price
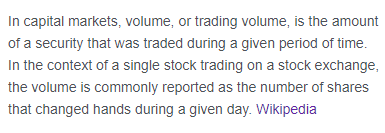
Volume is the number of shares traded in a certain timeframe
Price action is simply the movement of a stocks current price
VPA is the process of using both volume and price action to make inferences about the future price
Volume is the number of shares traded in a certain timeframe
Price action is simply the movement of a stocks current price
VPA is a system used to find high probability trades. There are hundreds of different VPA setups, but I want to focus on the basics today
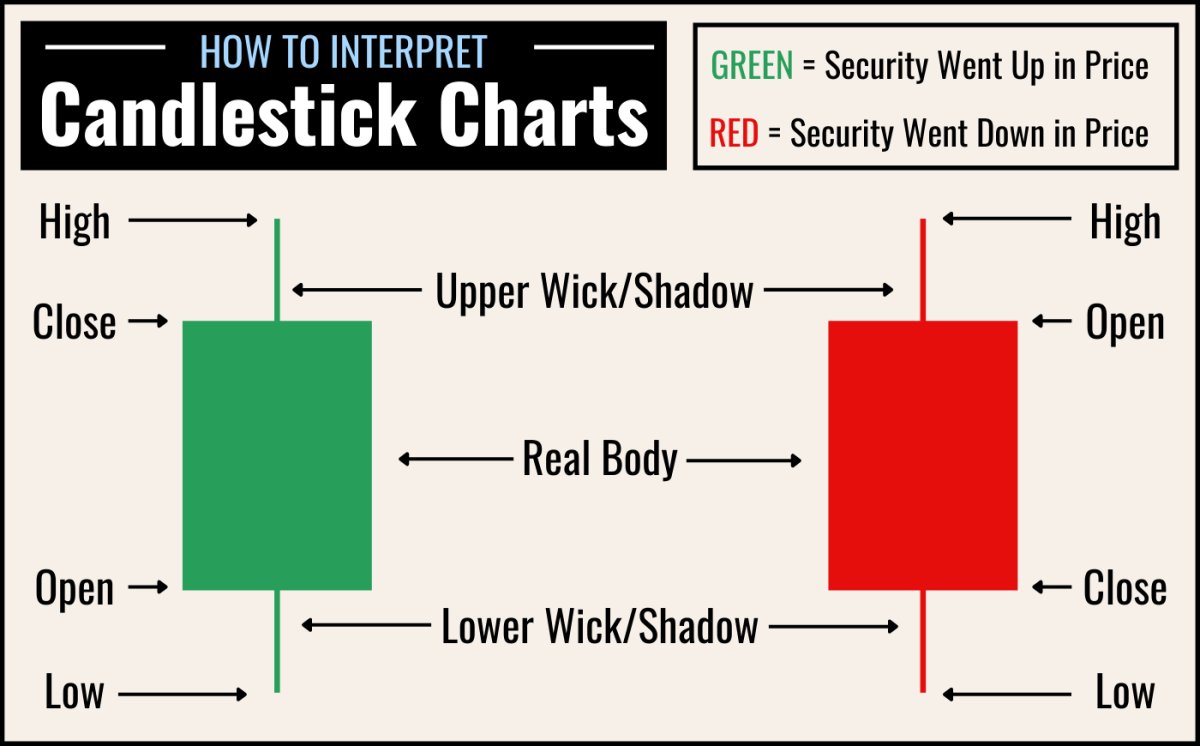
Candle Anatomy
Make sure you understand what wicks and bodies are. We will discuss them a lot in this thread
Make sure you understand what wicks and bodies are. We will discuss them a lot in this thread
Before we dive off the deep end, LIKE ALL THE TWEETS IN THIS THREAD
Show some love, these mfers take a long time to make
Show some love, these mfers take a long time to make
1) Large Body + No Wicks
High volume + Green = Strong Bullish move
High volume + Red = Strong Bearish move
Low volume + Green = Weak Bullish Move
Low Volume + Red = Weak Bearish Move
High volume + Green = Strong Bullish move
High volume + Red = Strong Bearish move
Low volume + Green = Weak Bullish Move
Low Volume + Red = Weak Bearish Move
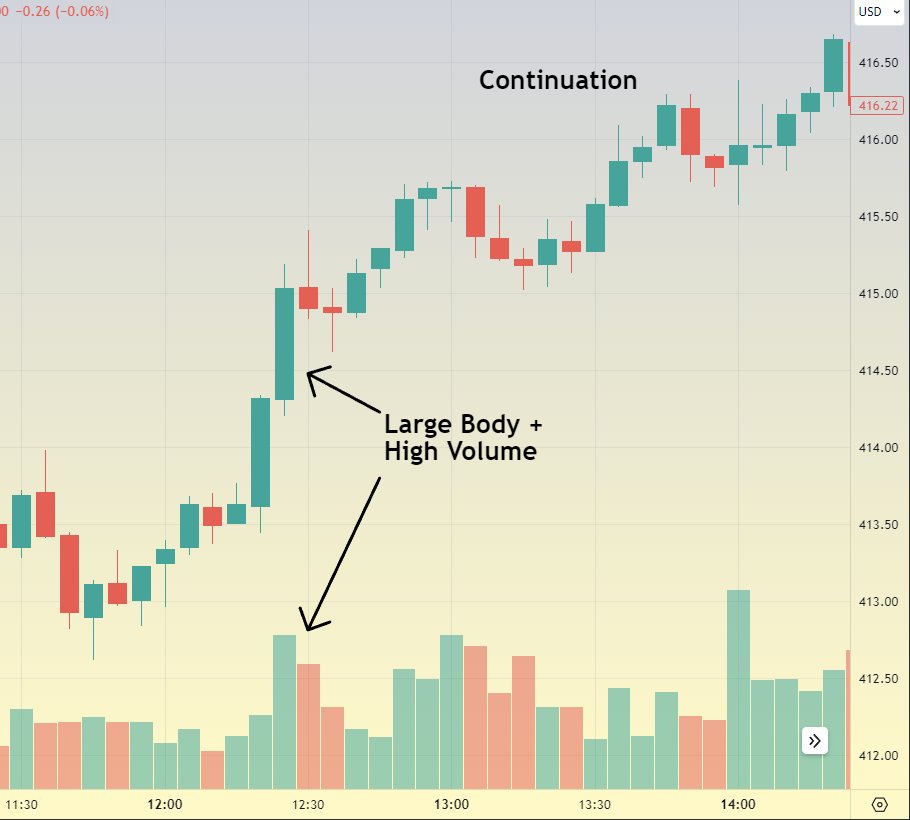
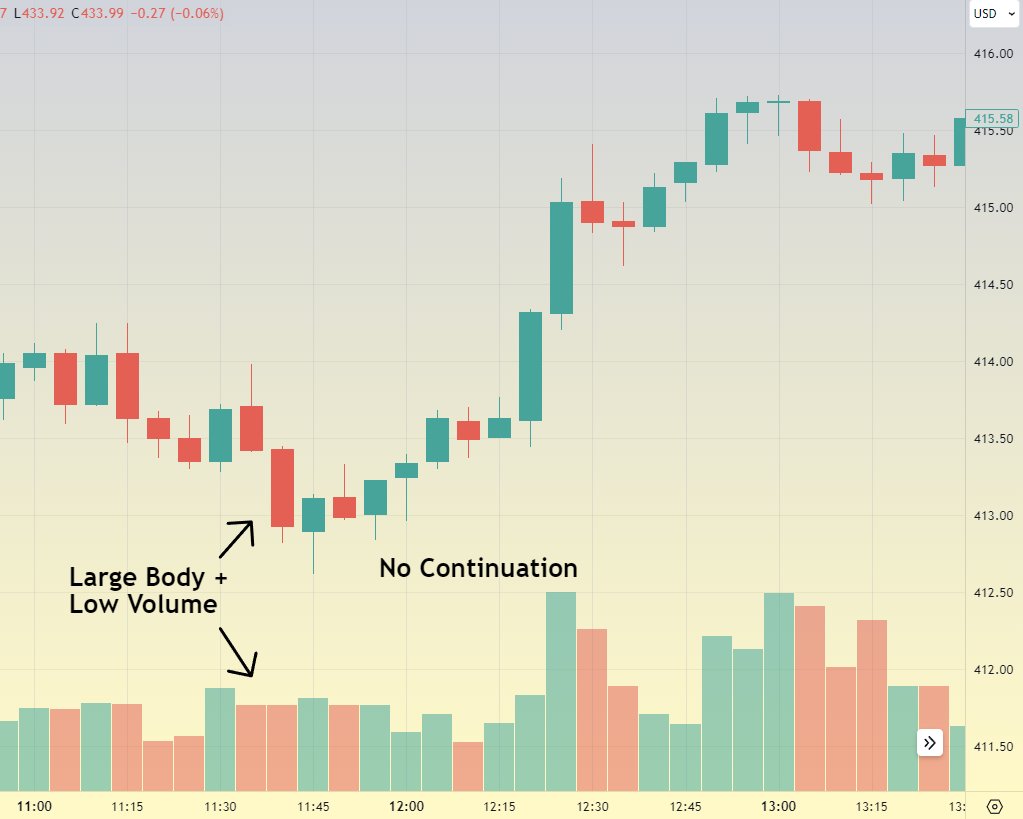
The main function of number 1 is to determine whether a move is worth following/using as a trend
We want to ride strong waves, not weak ones
We want to ride strong waves, not weak ones
2) Small Body + Large Wick
High Volume + Lower Wick = Buyers stepping in
Low Volume + Lower Wick = No significant buyers
High Volume + Upper Wick = Sellers stepping in
Low Volume + upper Wick = No significant sellers
High Volume + Lower Wick = Buyers stepping in
Low Volume + Lower Wick = No significant buyers
High Volume + Upper Wick = Sellers stepping in
Low Volume + upper Wick = No significant sellers
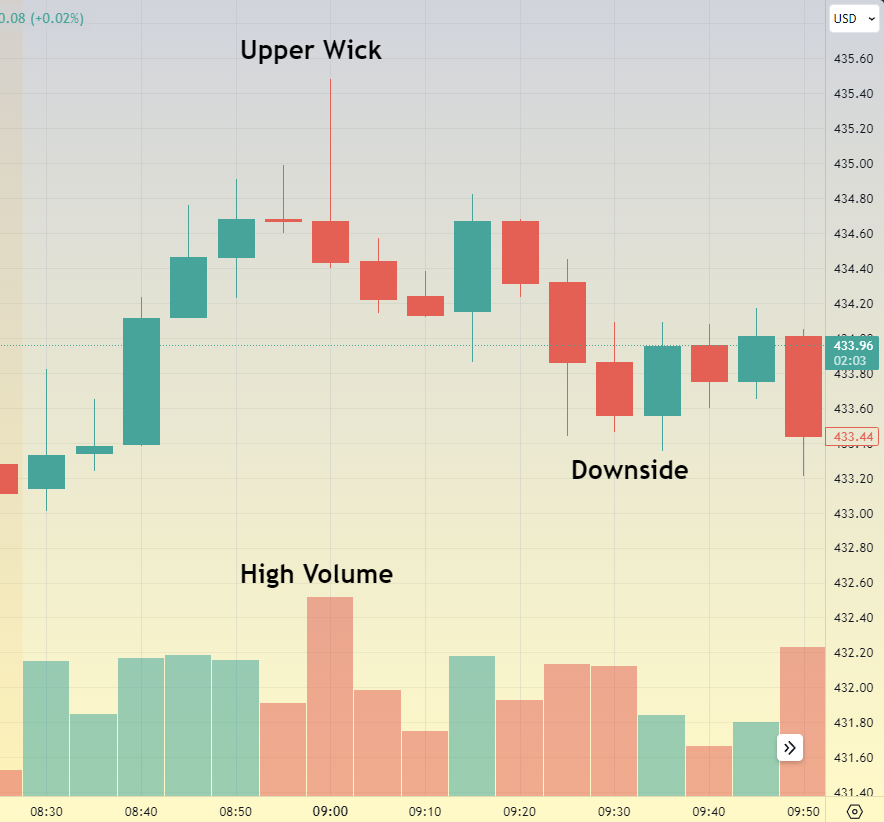
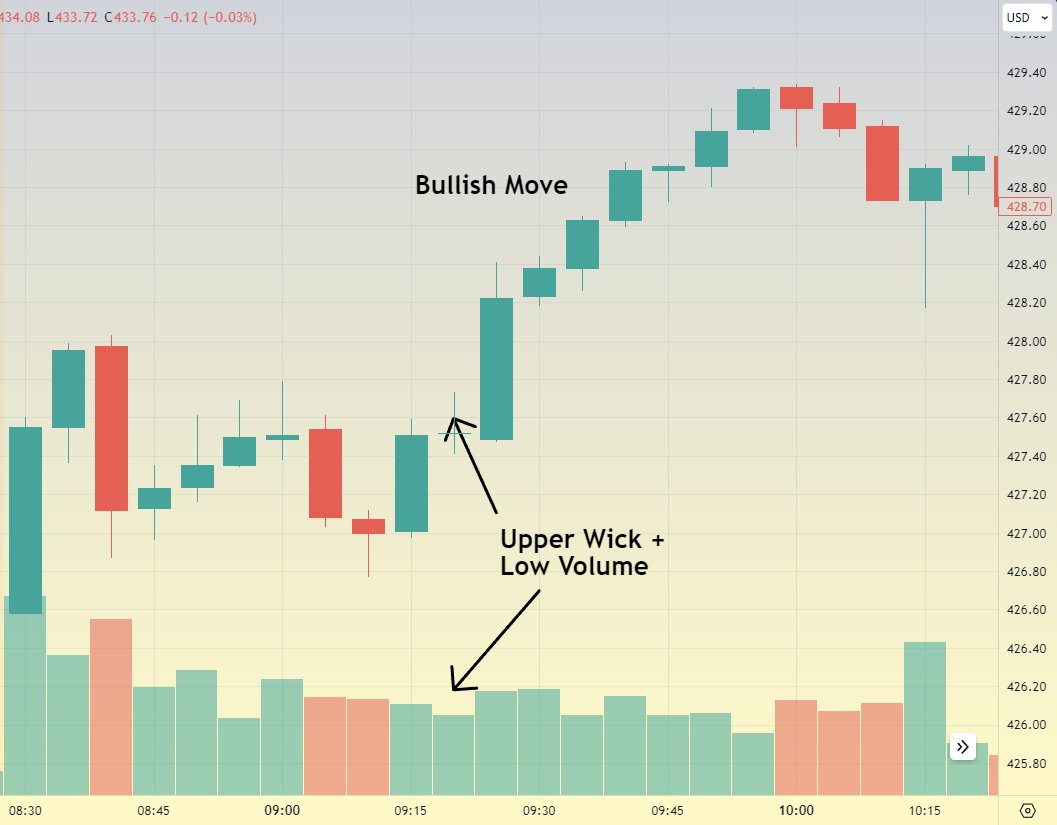
The main function of number 2 is to inform you when sellers or buyers are stepping in to create a new trend
High volume wicks are one of my favorite setups
High volume wicks are one of my favorite setups
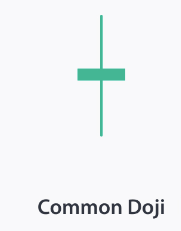
3) Small Body + 2 Wicks (doji candle)
High Volume + Doji = Important battle zone
Trend + High Volume + Doji = Trend is weak
Low Volume + doji = No significant information
High Volume + Doji = Important battle zone
Trend + High Volume + Doji = Trend is weak
Low Volume + doji = No significant information
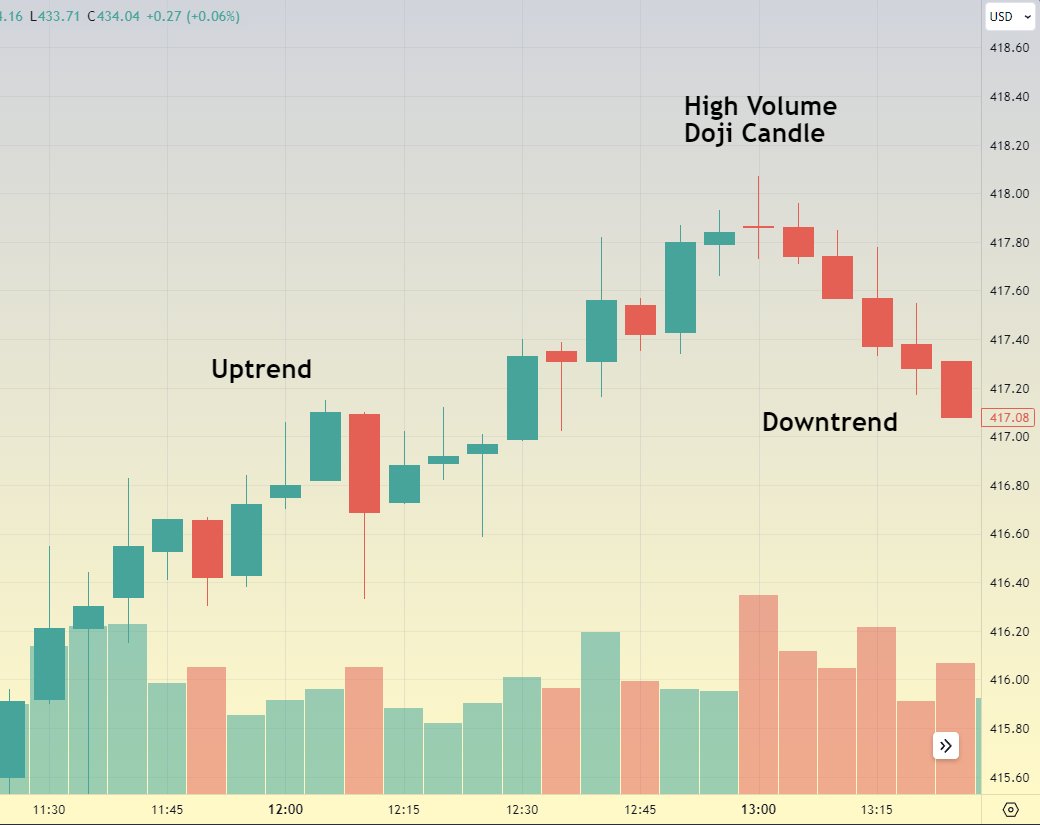
The main function of number 3 is to show you when bulls & bears have reached an important level
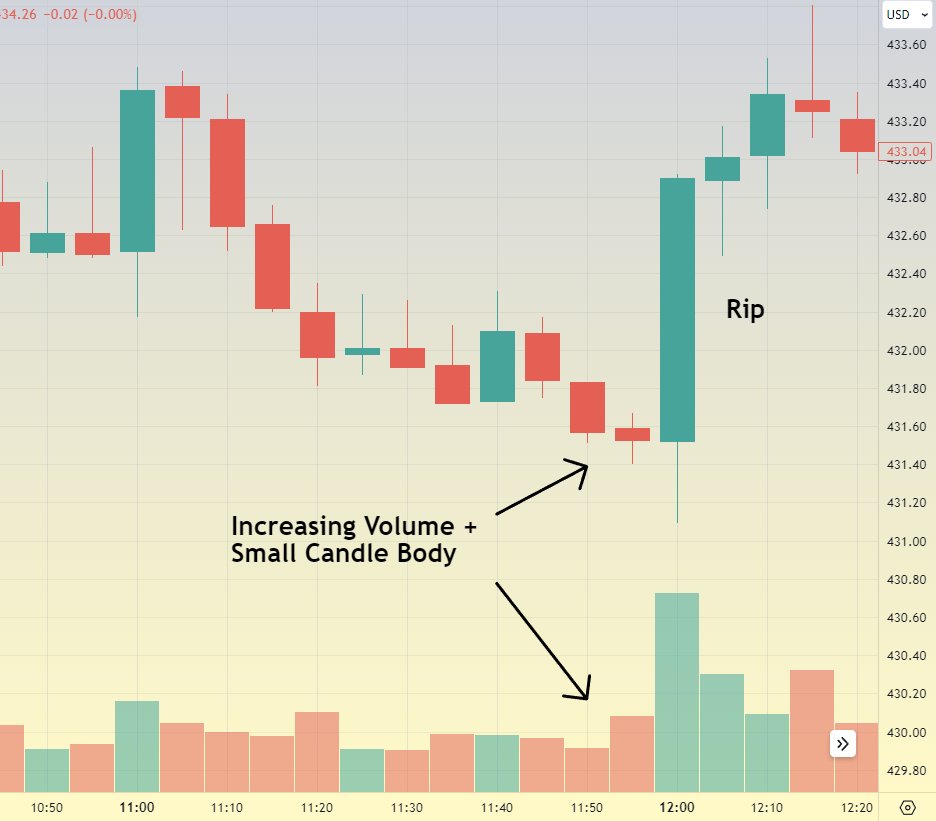
4) Validating Price Action With Volume
Increasing Candle Size + Increasing Volume = Validated
Increasing Candle Size + Decreasing Volume = Invalidated
Increasing Candle Size + Increasing Volume = Validated
Increasing Candle Size + Decreasing Volume = Invalidated
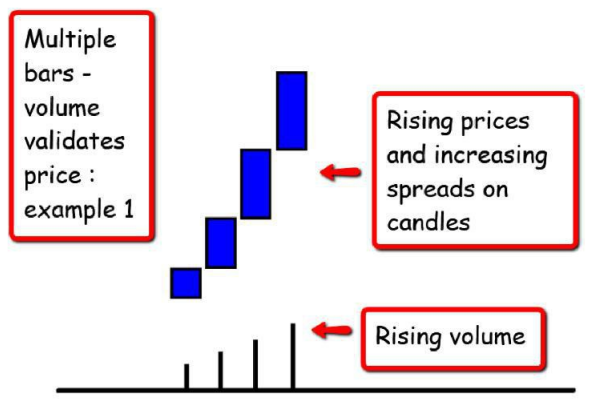
The function of number 4 is to highlight when price action is acting 'normal' and when something might be wrong (a trap or fake move)
I love to fade low volume moves, usually the other side is able to reject them quickly
I love to fade low volume moves, usually the other side is able to reject them quickly
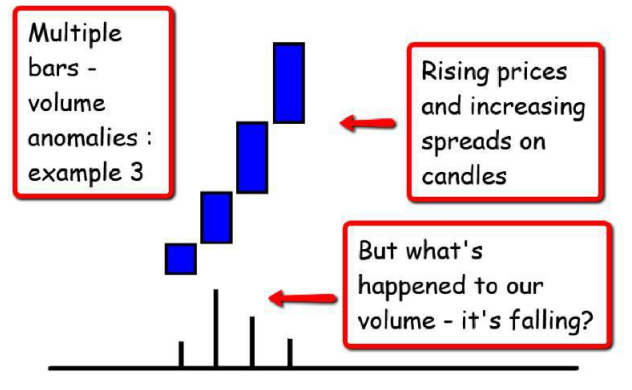
5) Trend Reversal
Increasing volume + Smaller Candle Bodies = Trend is Ending
Increasing volume + Smaller Candle Bodies = Trend is Ending
The main function of number 5 is to notice when relative volume is high, but results are not high
This shows us that the current price is likely to reverse the trend
This shows us that the current price is likely to reverse the trend
6) Breakouts/Breakdowns
High Volume + Break = Strong Move
Low Volume + Break = Weak Move
High Volume + Break = Strong Move
Low Volume + Break = Weak Move

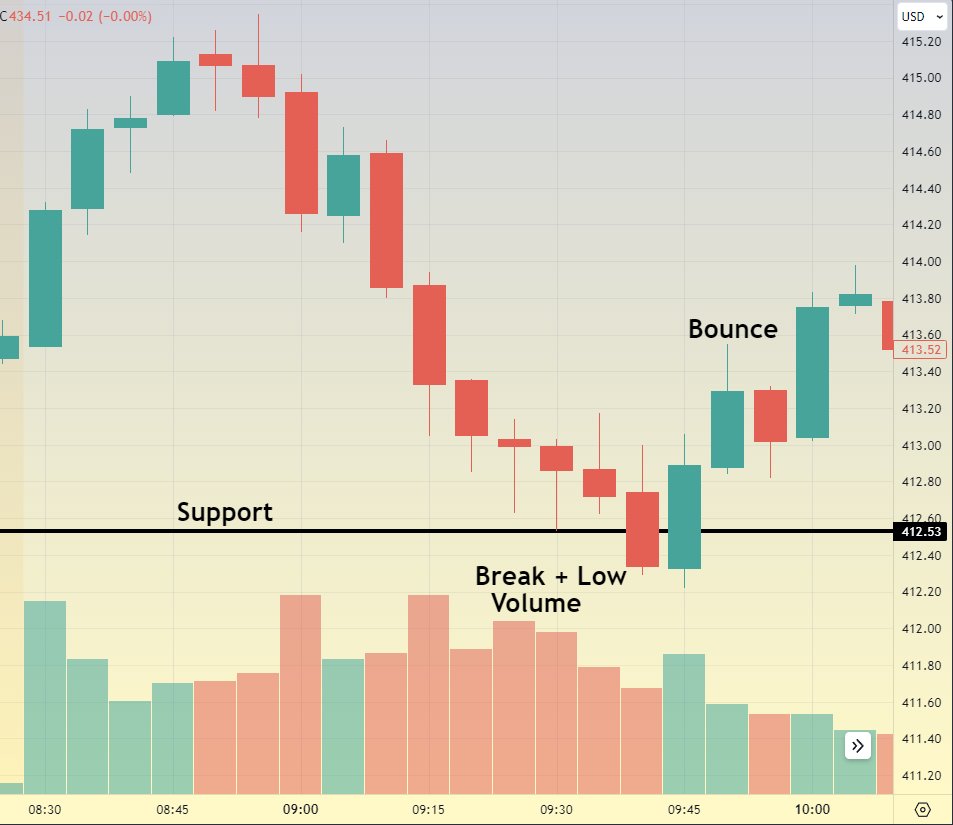
The main function of number 6 is to help you avoid fake breakouts & bank on real breakouts
7) Pullbacks
High Volume + Pullback = Reversal
Low Volume + Pullback = REAL PULLBACK
High Volume + Pullback = Reversal
Low Volume + Pullback = REAL PULLBACK
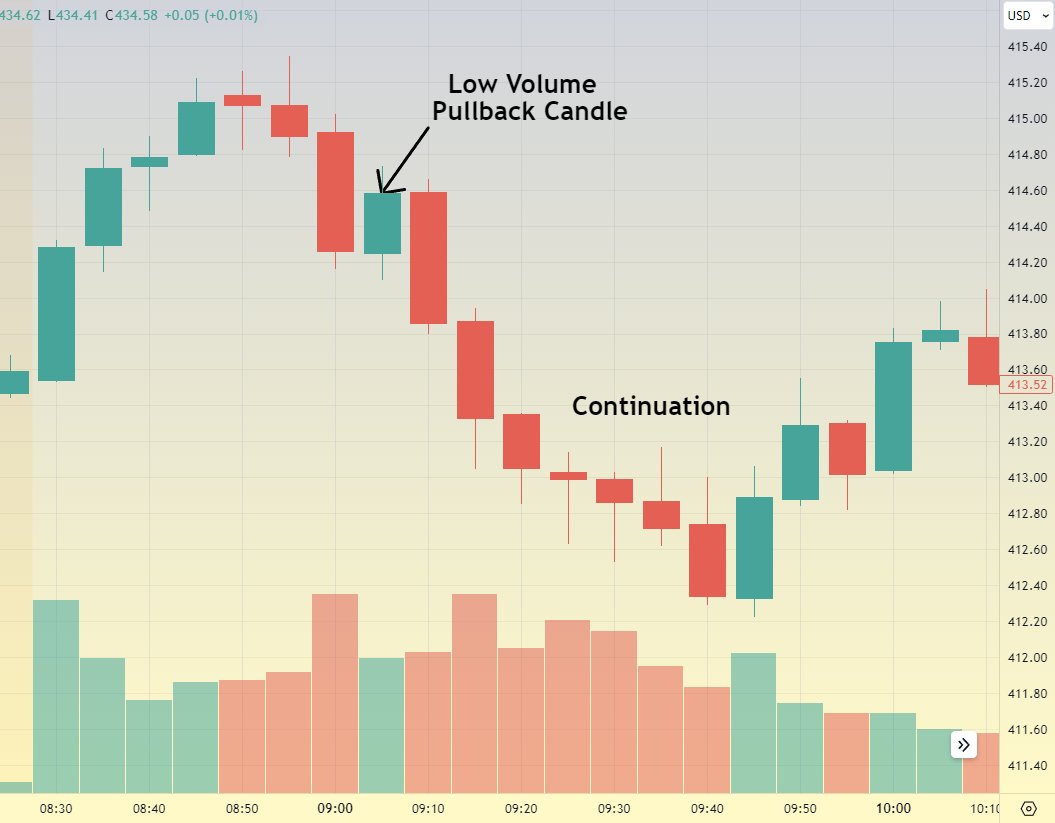
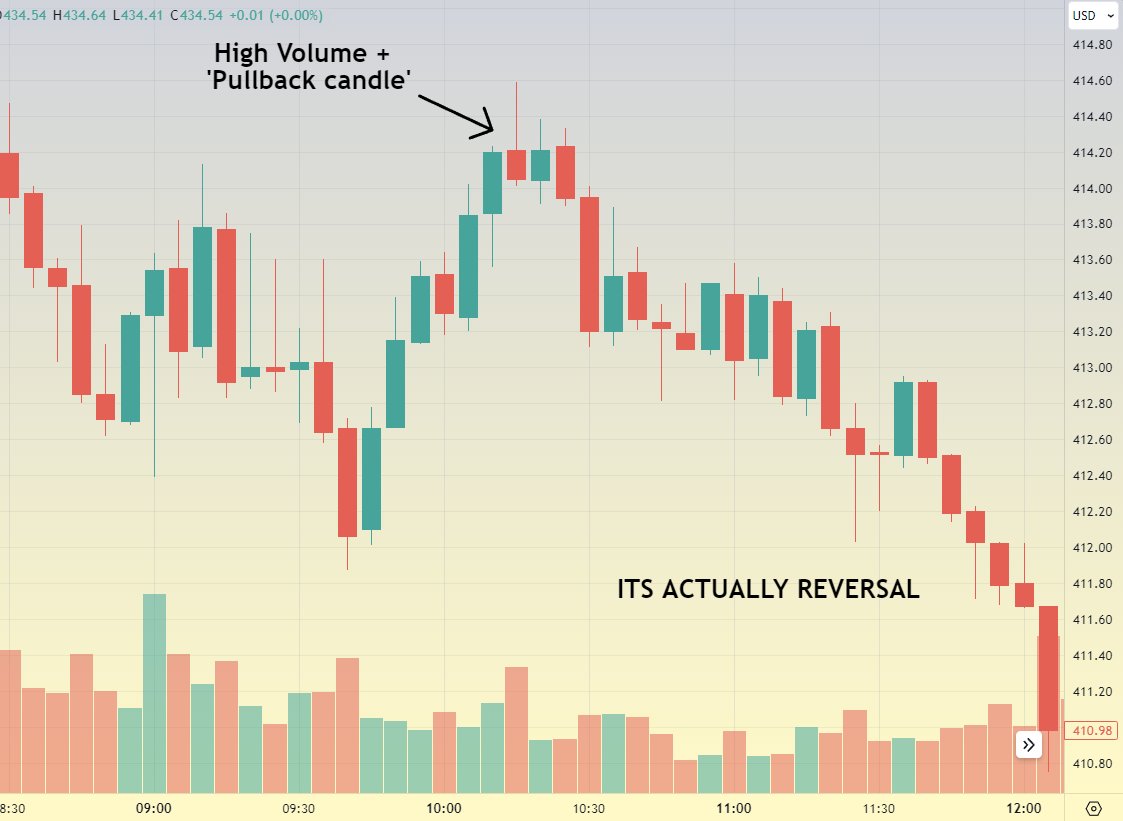
The main function of number 7 is making sure we buy real pullbacks and not reversals
Low volume pullbacks are another one of my top setups
Low volume pullbacks are another one of my top setups
Key VPA Ideas
High volume usually means that candle is significant
Low volume candles are usually insignificant
VPA should tell you about what buyers and sellers are doing/who is in control
Candles should either be validated or invalidated by volume
High volume usually means that candle is significant
Low volume candles are usually insignificant
VPA should tell you about what buyers and sellers are doing/who is in control
Candles should either be validated or invalidated by volume
My Thoughts
VPA is the best tool I have. I use it everyday
Once you isolate VPA setups that work well for you it's game over for MMs
The best way to find those setups is looking at charts and taking trades based on VPA (even if you don't win)
VPA is the best tool I have. I use it everyday
Once you isolate VPA setups that work well for you it's game over for MMs
The best way to find those setups is looking at charts and taking trades based on VPA (even if you don't win)
I hope this thread helped y'all understand VPA🙏
If you're looking for a trading community, consider checking out my discord. The link is in my bio♥️
If you're looking for a trading community, consider checking out my discord. The link is in my bio♥️
• • •
Missing some Tweet in this thread? You can try to
force a refresh