1/ Bear market rallies are notoriously violent and abrupt. And last week was among the most violent and abrupt of them all. While implied vol cratered over the week, and betrayed zero interest in hedging for the weekend, the price behavior left us searching for analogs.
2/ One of the more interesting charts that came out of our weekend work was the behavior of skew for the $NDX.
3/ Remember that skew is a measure of how "non-normal" a distribution is. A normal distribution does a oor job of describing equity returns; they tend to exhibit "fat tails" as popularized by Nassim Taleb in his work.
4/ Inevitably, we focus on the left tail dynamics. But occasionally, markets become extremely RIGHT-tail skewed – especially during secular bear markets.
That's right. We said it.
5/ In the 1998-2001 "skew bull," markets rose in a nearly uninterrupted manner, causing skew to "gain" both from dropping off the events of 1998 AND from an increasingly "right-tailed" bias.
6/ While we think it's important to note that the NDX of 1998-2001 had a large element of "meme" stock to it, the general outline looks similar (just imagine switching to ARKK in 2020-21):
7/ And while we're switching indices to $SPX in this next chart, the character of distributions of returns has shifted markedly despite similarities in skew.
8/ From June 1998- Dec 2001, the S&P500 was totally unchanged; from Dec 2019-Nov 6, 2023 the S&P500 is up 35% cumulatively. The difference in the return distributions is night and day, however:
9/ Unfortunately, this fits with the theories of @profplum99 on the influence of passive and simply raises the risks that the next stage in this market is a reintroduction of negative skew. Hold on to your butts.
@peter_s1981
• • •
Missing some Tweet in this thread? You can try to
force a refresh
Dealers remain excessively short-gamma with around $1.7 billion to hedge per index point. This level puts us back near the max amount of negative Gamma we've seen this year and close to record levels since 2018.
2/ While that might seem scary, remember that around half of this Gamma is tied to weekly options, which are being hedged with further out-of-the-money contracts rather than hitting the futures market.
These hedging flows have contributed to the massive jump in 0dte volumes.
3/ That also means short-dated gamma is modestly less dangerous as far as contagion risk, as long as market makers can stay delta-hedged within the window of liquid options, which are created by CBOE several weeks in advance.
1/ The vol surface carries an interesting message with a sharp rise in implied vol into the end of September.
With nothing looming on the economic calendar, what gives?
This is the return of the JP Morgan Hedged Equity put.
$JEHQX
2/ On a quarterly basis, a family of JP Morgan mutual funds must restrike a "sell call, buy put spread" structure. This is a highly visible trade also know as the JPM collar.
3/ Oddly (not really as it's clearly about marketing), these options are set for end of month rather than more liquid option expiry dates.
As a result, they have a discernible impact on implied volatility at these less liquid dates.
1/ "When the USA sneezes, the rest of the world catches a cold."
A short 🧵on the US dollar. $DXY
Within the details of last week's Kansas City Fed surveys, we found it interesting that new orders remain negative.
2/ The trailing 12m average of new orders is now on par with the end of the GFC and there is an inevitable level of restocking that we should expect to eventually lead to recovery in this series. The continued weakness is likely increasingly influenced by growing USD strength.
3/ Support for this hypothesis can be found in the sharp deterioration in expected export orders which fell to levels last seen in the depths of the Covid shutdowns:
1/ Using the Fed's JOLTs data, we have seen 1.5M job openings disappear since it peaked in March '22.
To put this in context, Job Openings declined by 1.8M over the Global Financial Crisis when unemployment spiked from 4.4% to 10%.
This time though, unemployment is unchanged.
2/ From our model-based view, this failure to raise unemployment has been the key factor keeping passive inflows into the equity markets sustained.
3/ This has also been supplemented by the rebirth of volatility selling and the inflows from corporate share buybacks, vol targeting strategies, and CTAs.
The low vol parade continues and with the entire front curve of the vol surface totally flat and below 13, it's remarkably hard to hold long vol positions for any period of time. $VIX $SPX
2/ The carry into realized is not so much the problem (we are pricing and realizing 11-13%) which makes it easy for dealers (who continuously delta hedge) to carry these positions, it's the roll down in the $VIX futures curve that is the killer.
3/ Contrast to the flat surface inside 30 days, the VIX futures surface is quite steep, rising to 15 at the first future and 16.7 at the second. This creates monthly positive carry of roughly 11% per month that is resulting in rapid gains for products that run inverse to the VIX:
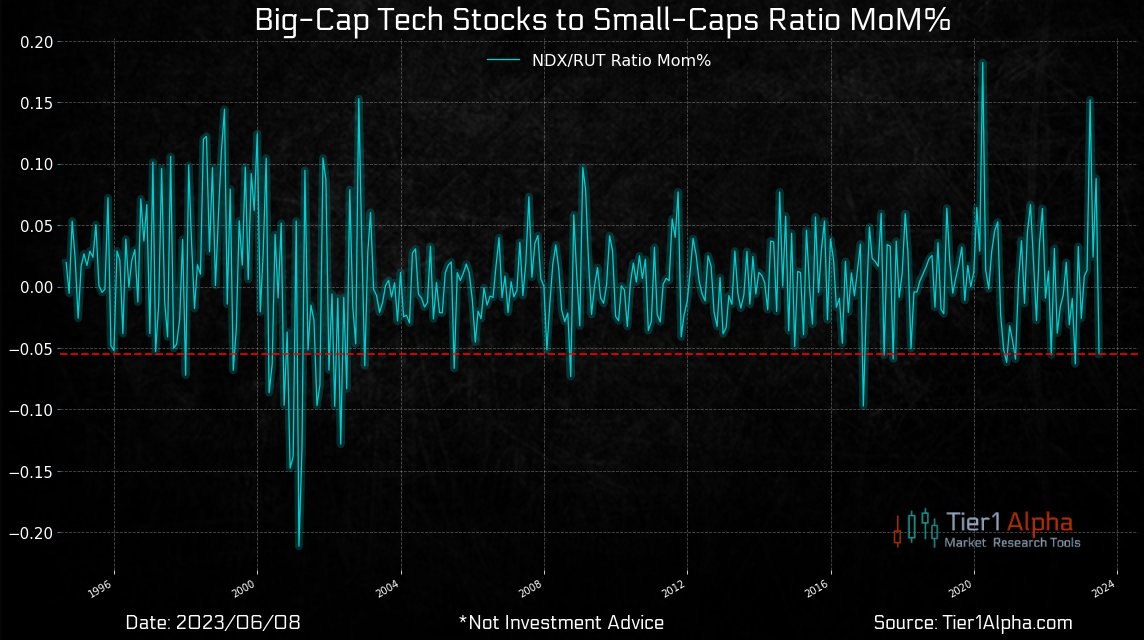
1/ The past two days have been broadly characterized as a value rally or a broadening of the market.
Unfortunately, nothing could be further from the truth.
No, really. 🧵
$NDX $RUT $SPX
2/ What you just experienced is an unwind -- the selling of popular longs and unwind of popular shorts ahead of "events."
What events? (Insert Narrative Here )
It doesn't really matter.
3/ Somebody de-grossed in a big way starting with an algorithmic program around 10:30am on Monday. It appears to have concluded around 3:55pm yesterday as we rolled into the close.