
The Stockbee Market Monitor by @PradeepBonde is probably one of the best free resources out there.
It's amazing for gauging situational awareness of the market.
Let's take a look from a data-science perspective in predicting trends in SPY 🧵
It's amazing for gauging situational awareness of the market.
Let's take a look from a data-science perspective in predicting trends in SPY 🧵

@PradeepBonde If you're a swing trader, then the Market Monitor is a seriously useful market breadth tool.
I'm using it to understand whether the market is favorable to long-based momentum trades.
Basically, I'm looking to trade long when the chart is highlighted green.
I'm using it to understand whether the market is favorable to long-based momentum trades.
Basically, I'm looking to trade long when the chart is highlighted green.

@PradeepBonde Of course, labelling areas as green/red is easy in hindsight.
What's harder is knowing that before it happens.
So, what the aim is here is to use the Market Monitor to predict when green/red happens.
We are going to use machine learning for this.
What's harder is knowing that before it happens.
So, what the aim is here is to use the Market Monitor to predict when green/red happens.
We are going to use machine learning for this.
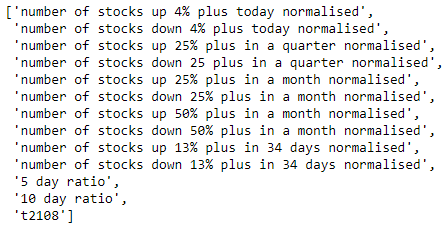
@PradeepBonde Firstly, we need the market monitor data.
Fortunately, this is completely free, just google it (thanks Pradeep!).
Many of the columns are dependent on the # of stocks in the universe.
So first, let's normalise pretty much every column by the # of stocks.
Fortunately, this is completely free, just google it (thanks Pradeep!).
Many of the columns are dependent on the # of stocks in the universe.
So first, let's normalise pretty much every column by the # of stocks.
@PradeepBonde Why?
We want the machine learning model to learn general rules.
If we feed in raw figures, it may not understand that the # will change because the universe size changes.
The 5 & 10 day ratio are already normalised, so they are fine too (same for the t2108).
We want the machine learning model to learn general rules.
If we feed in raw figures, it may not understand that the # will change because the universe size changes.
The 5 & 10 day ratio are already normalised, so they are fine too (same for the t2108).
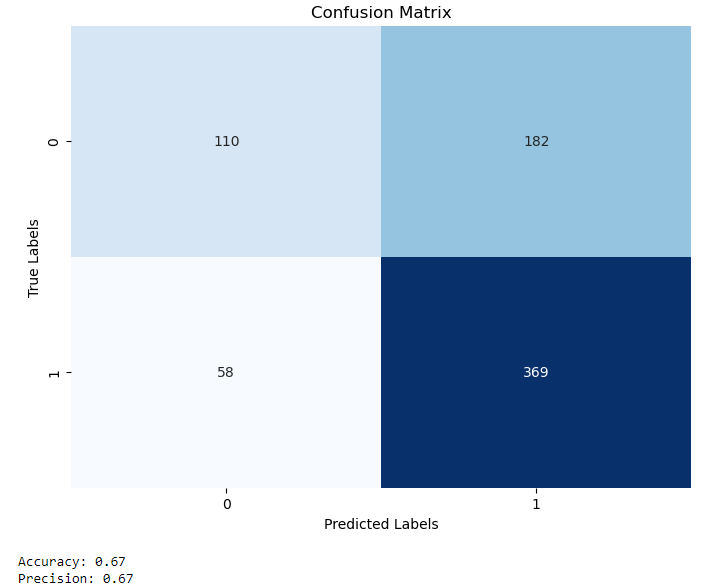
@PradeepBonde With all these features & the uptrend/downtrend label (which is binary) we can train a model.
To start with, use a tree-based model like a random forest.
With no effort to optimise the training/feature engineer - we get a remarkable 67% accuracy in trend prediction.
To start with, use a tree-based model like a random forest.
With no effort to optimise the training/feature engineer - we get a remarkable 67% accuracy in trend prediction.
@PradeepBonde The best thing about tree based models is that you can extract feature importance.
In other words, per column in Pradeep's data, what are the most/least important.
Interestingly, the # of stocks up 13% plus in 34 days is most important. Closely followed by the 10 day ratio.
In other words, per column in Pradeep's data, what are the most/least important.
Interestingly, the # of stocks up 13% plus in 34 days is most important. Closely followed by the 10 day ratio.
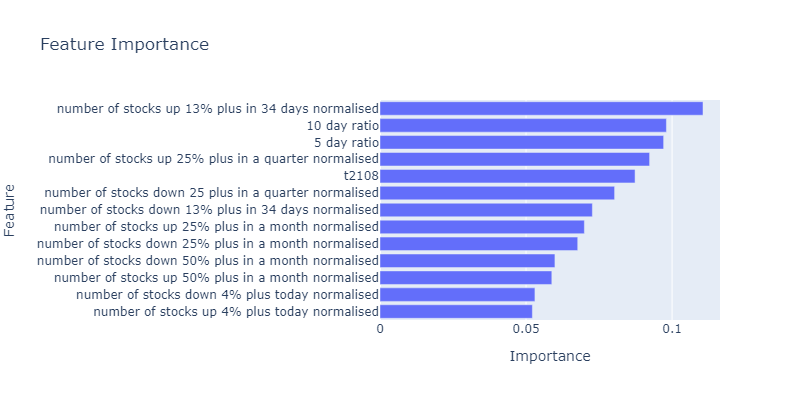
@PradeepBonde Since a random forest is a non-linear model, it's likely all columns have interaction with each other.
Since there are no features where there a value close to 0 on the scale, all look pretty useful.
This is no surprise given Pradeep's expertise, he knows what works!
Since there are no features where there a value close to 0 on the scale, all look pretty useful.
This is no surprise given Pradeep's expertise, he knows what works!
@PradeepBonde But what does this mean for our chart?
Actually... it's pretty messy. But it indeed captures the good/bad pretty well!
Remember, this is a quick/dirty train of a model, there is plenty to be done in terms of optimisation.
Actually... it's pretty messy. But it indeed captures the good/bad pretty well!
Remember, this is a quick/dirty train of a model, there is plenty to be done in terms of optimisation.
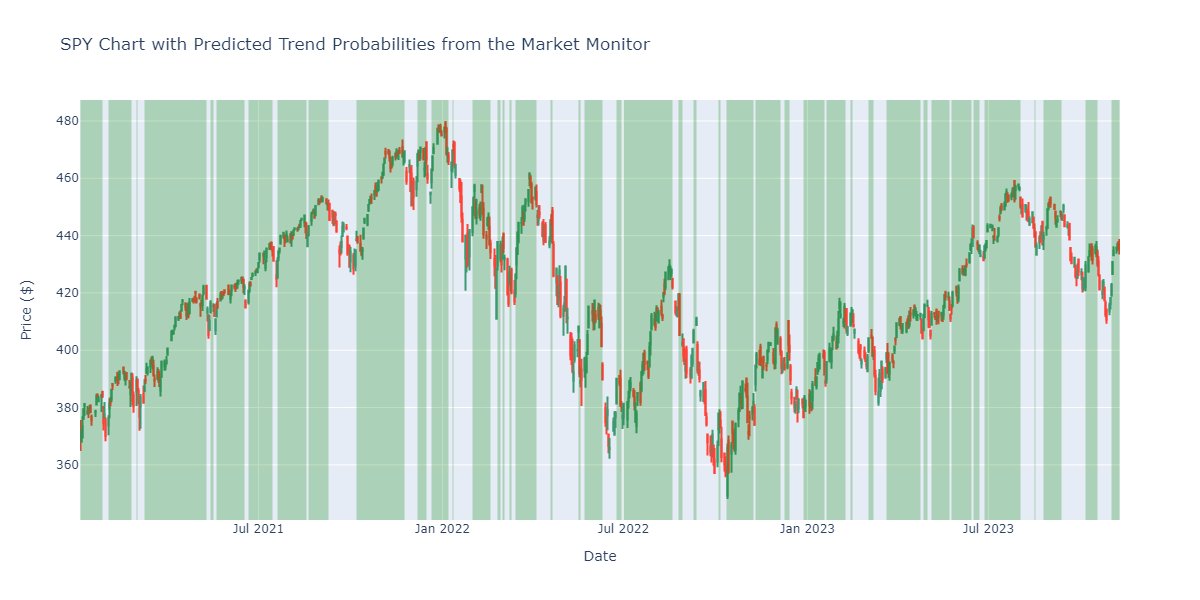
@PradeepBonde Another good thing about ML models is they can produce "probabilities"
I.e., the last image shows anything above 50% probability.
Higher probability = greater model "surety" that it's in an uptrend.
Upping it to 70% shows a cleaner view, for sure!
I.e., the last image shows anything above 50% probability.
Higher probability = greater model "surety" that it's in an uptrend.
Upping it to 70% shows a cleaner view, for sure!

@PradeepBonde Let's look to improve slightly.
I'm adding in a few technicals from the SPY itself, including:
• Price distance from the moving averages
• Average range over n days
• Price distance from an n day max/min
There's no need to overthink this too much.
ML is all iteration!
I'm adding in a few technicals from the SPY itself, including:
• Price distance from the moving averages
• Average range over n days
• Price distance from an n day max/min
There's no need to overthink this too much.
ML is all iteration!
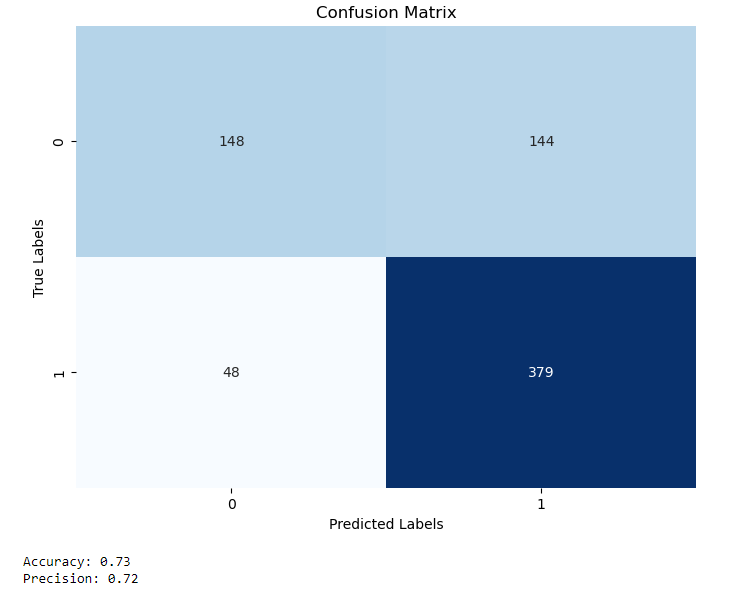
@PradeepBonde We now get an improved accuracy to 73%.
This shows the power of feature engineering.
There is undoubtedly more tinkering to be done - but outside the scope of a simple thread.
This shows the power of feature engineering.
There is undoubtedly more tinkering to be done - but outside the scope of a simple thread.
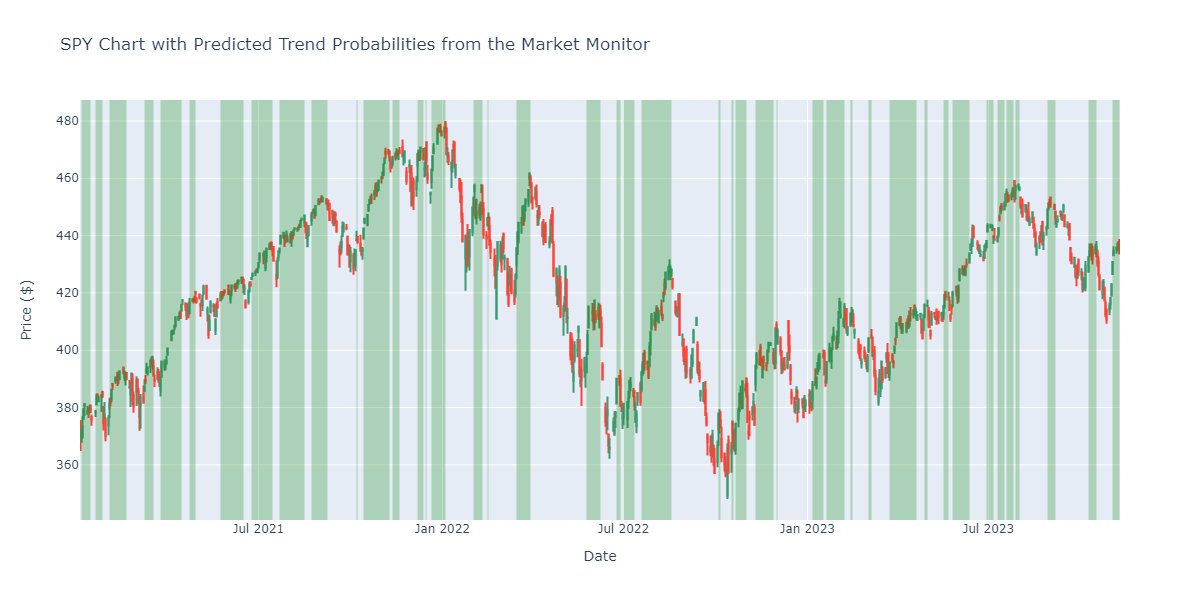
@PradeepBonde With the new features & model, we end up with a cleaner chart again.
What I find quite interesting is seeing how the model is quite unsure in 2023.
Lots of chop for sure - I'm sure many traders can vouch for that personally!
What I find quite interesting is seeing how the model is quite unsure in 2023.
Lots of chop for sure - I'm sure many traders can vouch for that personally!
@PradeepBonde TL;DR
The Market Monitor is an exceptional tool for understanding trading environments.
Machine learning can be leveraged with this data to provide an indicator of when to swing trade long.
And be sure to thank Pradeep for the data/free content!
The Market Monitor is an exceptional tool for understanding trading environments.
Machine learning can be leveraged with this data to provide an indicator of when to swing trade long.
And be sure to thank Pradeep for the data/free content!
@PradeepBonde Anyway, that's all for this one!
If you are interested in applying Python/Data-Science to finance then:
1. Follow me @DrDanobi for more of these
2. Check out some other of my threads.
If you are interested in applying Python/Data-Science to finance then:
1. Follow me @DrDanobi for more of these
2. Check out some other of my threads.
https://twitter.com/DrDanobi/status/1723714853938806871
• • •
Missing some Tweet in this thread? You can try to
force a refresh


