John Bistline Profile picture
Nov 16, 2023 21 tweets 10 min read Read on X
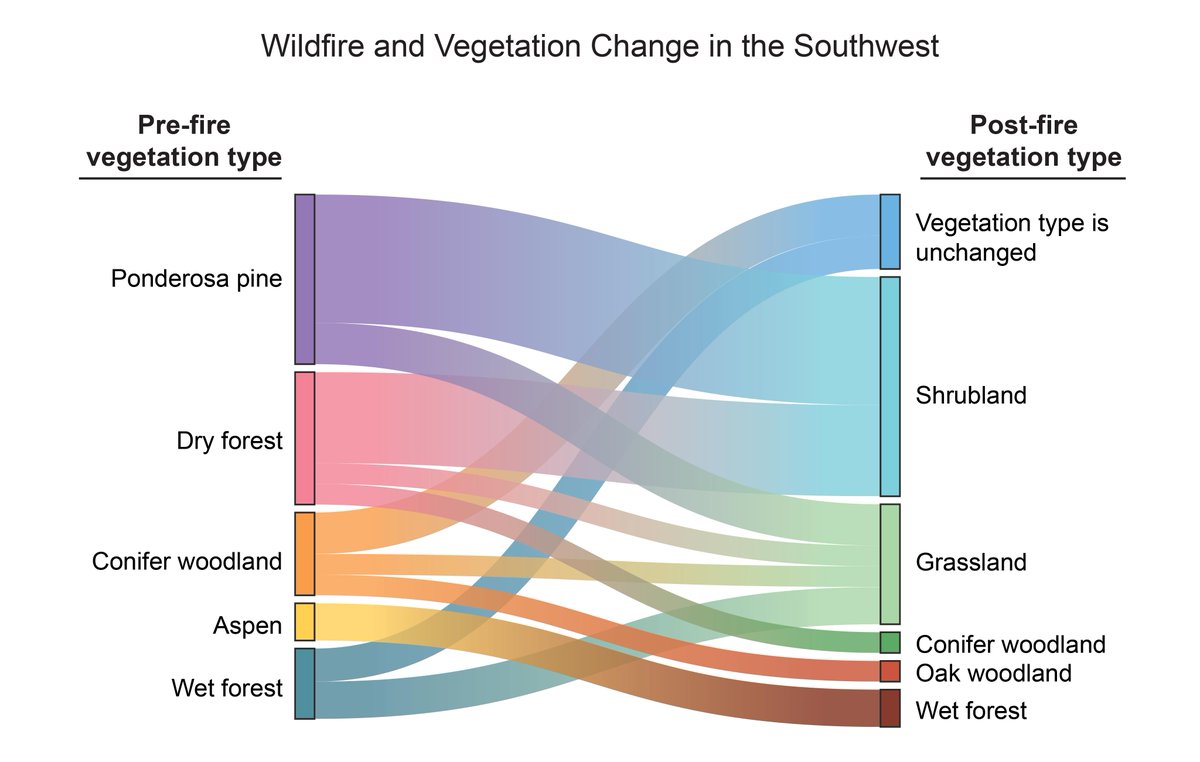
Taylor Swift and Travis Kelce as figures in the new U.S. National Climate Assessment report, a thread
Image
Image
Taylor and Travis as Figure 3.11 in #NCA5 (regional differences in climate response)
Image
Image
Taylor Swift as Figure 21.9 (flood insurance rates in the Northeast)
Image
Image
Taylor Swift as Figure 1.15 (extreme precipitation and coastal flooding)
Image
Image
Travis Kelce as Figure 1.8 (relationship between temperature and income in three U.S. cities)
Image
Image
Taylor Swift as Figure 1.7 (damages from billion-dollar disasters)
Image
Image
Taylor Swift as Figure 29.14 (salmon)
Image
Image
Travis Kelce as Figure 18.2 (intersectional vulnerabilities)
Image
Image
Taylor Swift as Figure 22.8 (social vulnerability in the Southeast)
Image
Image
Interlude: If you'd like to learn more about climate science, impacts, and solutions, read the full report here:

I was a coauthor of the Mitigation chapter (@Davis_StevenJ): nca2023.globalchange.gov
nca2023.globalchange.gov/chapter/32/
@Davis_StevenJ Taylor Swift as Figure 1.2 (historical cost declines for wind, solar, and batteries)
Image
Image
@Davis_StevenJ Travis Kelce as Figure 1.14 (regional changes in climate)
Image
Image
Taylor Swift as Figure 27.1 (atmospheric rivers and extreme precipitation)
Image
Image
Taylor Swift as Figure 1.12 (jobs impacts of net-zero pathways) cc @ErinNMayfield
Image
Image
@ErinNMayfield Taylor Swift as Figure 32.15 (health cobenefits of power plant retirements) cc @Davis_StevenJ @inesliaz
Image
Image
@ErinNMayfield @Davis_StevenJ @inesliaz Taylor Swift as Figure 2.15 (regional tipping points) cc @hausfath @wang_seaver
Image
Image
Taylor Swift as Figure 1.3 (U.S. state and city adaptation and mitigation policies) cc @WeiPeng_Pton
Image
Image
Travis Kelce as Figure 2.4 (winter and summer temperatures)
Image
Image
Taylor Swift as Figure 20.1 (dimensions of environmental justice)
Image
Image
Taylor Swift as Figure 32.23 (company-level mitigation actions)
Image
Image
Feel free to add your own! There are so many great figures throughout the #NCA5 report:

And thanks to @HMcJeon for the inspiration! nca2023.globalchange.gov/all-figures/

• • •

Missing some Tweet in this thread? You can try to force a refresh
 

Keep Current with John Bistline

John Bistline Profile picture

Stay in touch and get notified when new unrolls are available from this author!

Read all threads

This Thread may be Removed Anytime!

PDF

Twitter may remove this content at anytime! Save it as PDF for later use!

Try unrolling a thread yourself!

how to unroll video
  1. Follow @ThreadReaderApp to mention us!

  2. From a Twitter thread mention us with a keyword "unroll"
@threadreaderapp unroll

Practice here first or read more on our help page!

More from @JEBistline

Nov 30, 2023
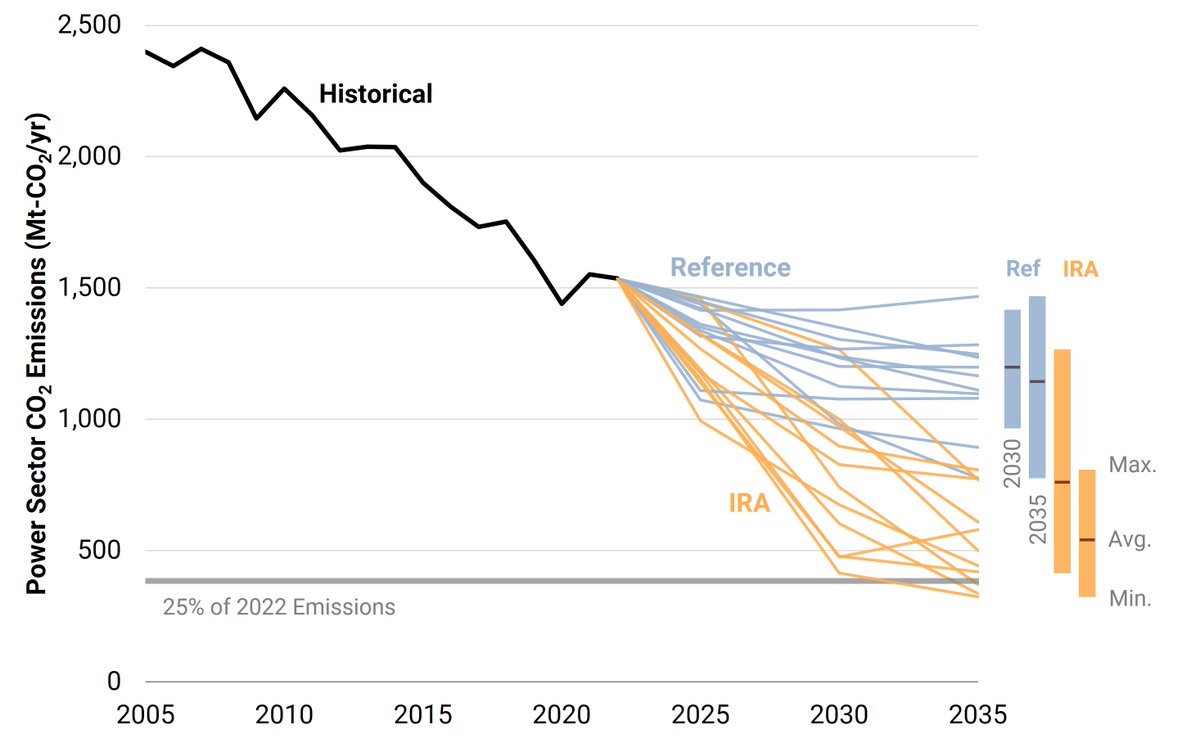
New article: Our 11 model comparison shows how the Inflation Reduction Act can lower power sector emissions, accelerate clean electricity deployment, and lower electricity prices. Image
You can read our article for free in Environmental Research Letters:

Here's a short thread of our key findings…

@IOPenvironment @dan_kammen doi.org/10.1088/1748-9…
Image
@IOPenvironment @dan_kammen IRA could accelerate clean electricity deployment relative to a pre-IRA reference. New capacity is led by solar and wind, including 1.4-6.2 times current installed capacity by 2035. Image
Read 10 tweets

Did Thread Reader help you today?

Support us! We are indie developers!


This site is made by just two indie developers on a laptop doing marketing, support and development! Read more about the story.

Become a Premium Member ($3/month or $30/year) and get exclusive features!

Become Premium

Don't want to be a Premium member but still want to support us?

Make a small donation by buying us coffee ($5) or help with server cost ($10)

Donate via Paypal

Or Donate anonymously using crypto!

Ethereum

0xfe58350B80634f60Fa6Dc149a72b4DFbc17D341E copy

Bitcoin

3ATGMxNzCUFzxpMCHL5sWSt4DVtS8UqXpi copy

Thank you for your support!

Follow Us!

:(