 Read on Twitter
🚨 Immigration & crime
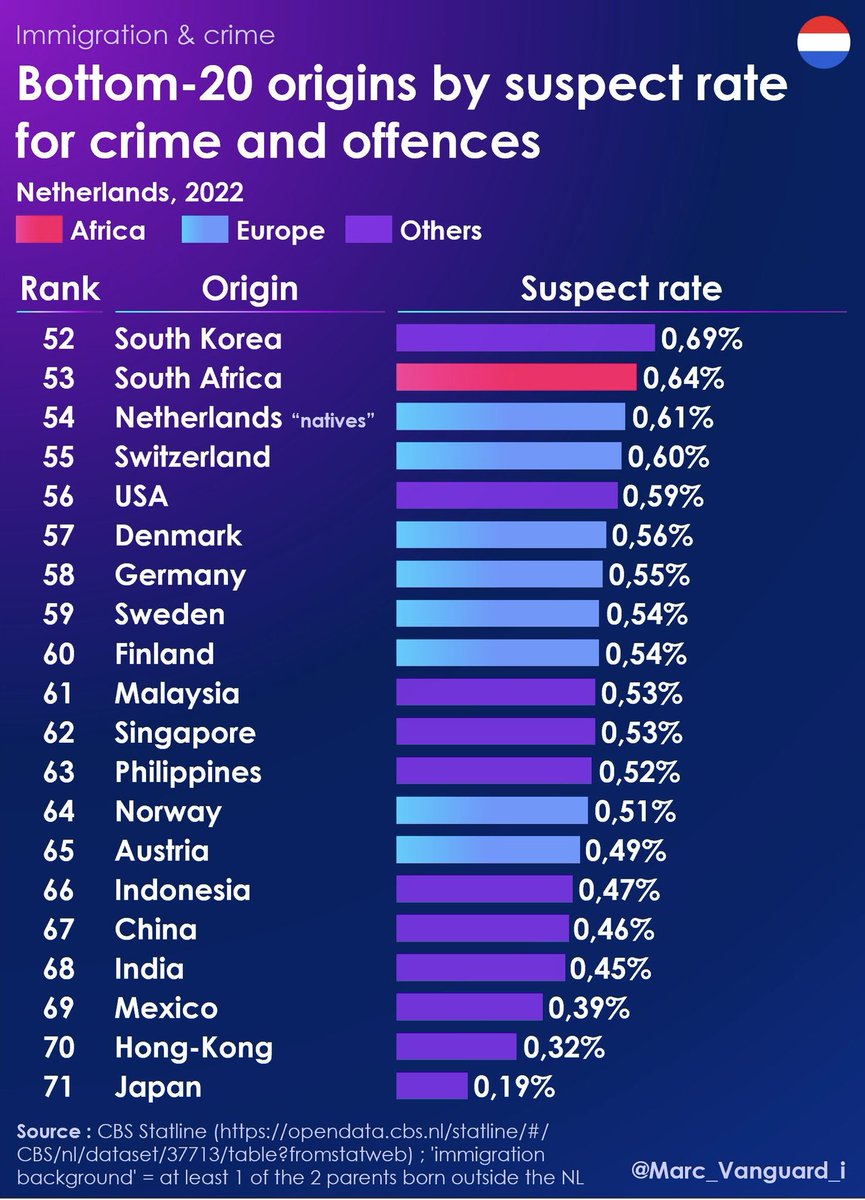
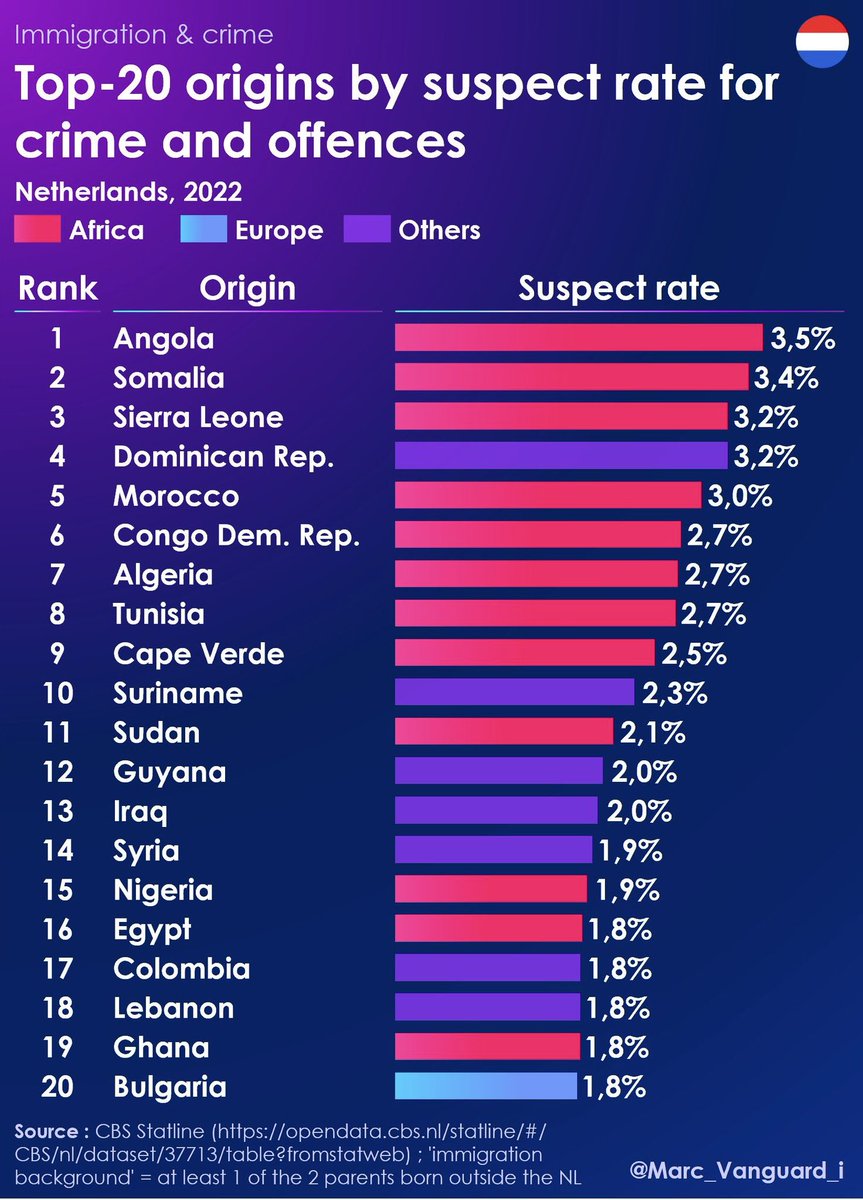
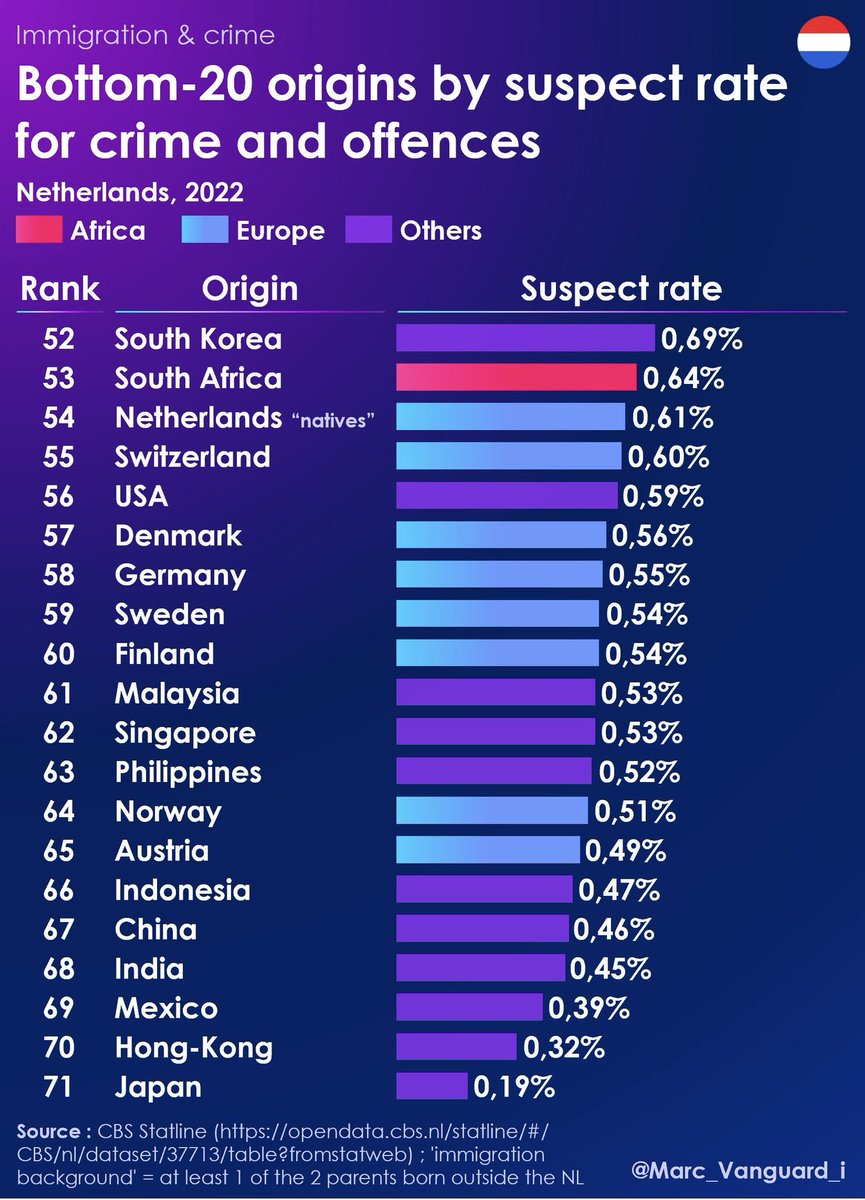
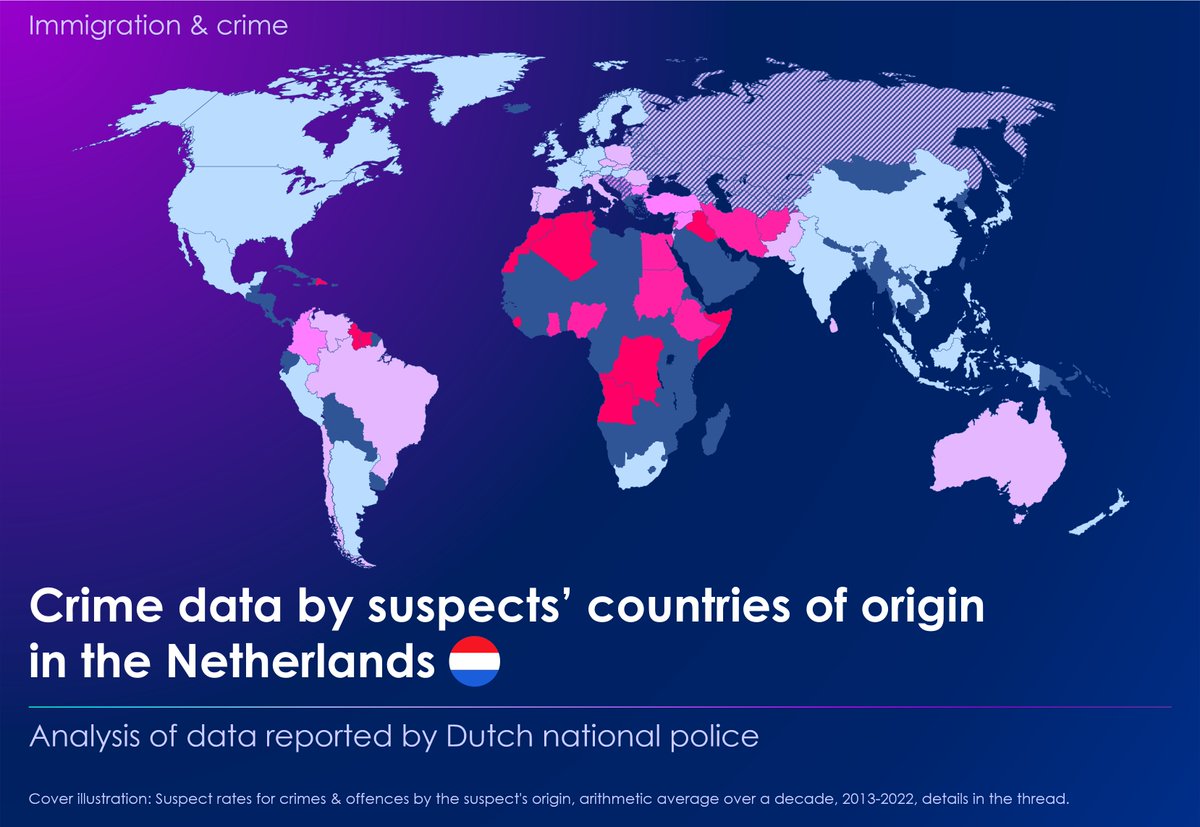
The Dutch police releases crime statistics by country of origin. Accumulated over 10 years, they provide a fantastic dataset of 2 million data points.
⬇️ THREAD: the 15 most interesting facts about the alarming link between immigration and crime in the 🇳🇱
The Dutch police releases crime statistics by country of origin. Accumulated over 10 years, they provide a fantastic dataset of 2 million data points.
⬇️ THREAD: the 15 most interesting facts about the alarming link between immigration and crime in the 🇳🇱
Foreword:
- Links to sources at the end of the thread
- Definitions at the bottom of each illustration
- More threads like this on @Marc_Vanguard_i
- Links to sources at the end of the thread
- Definitions at the bottom of each illustration
- More threads like this on @Marc_Vanguard_i
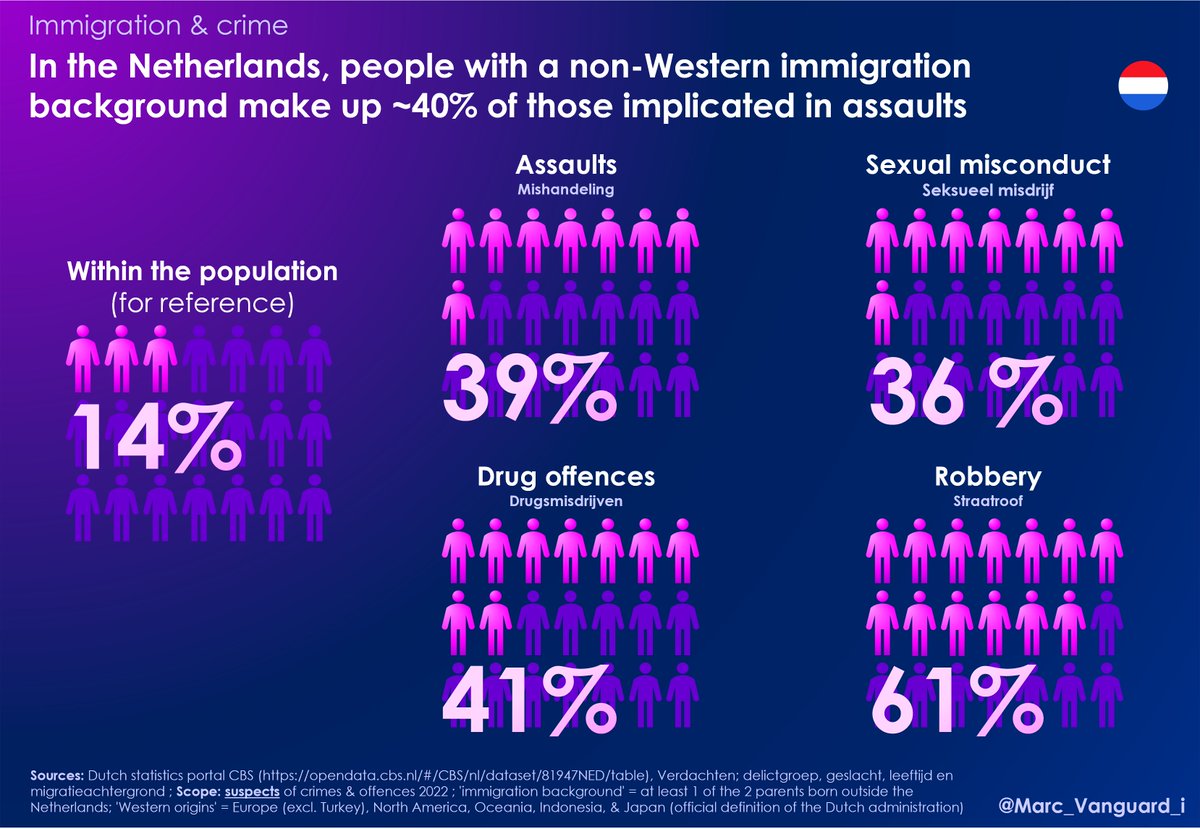
1⃣ Individuals from 'non-Western' immigration background make up 14% of the population in the Netherlands. However, they account for a large portion of those implicated:
🔞 Sexual offenses: ~35%
🔪 Assaults: ~40%
💉 Drug offences: ~40%
👊 Violent thefts: ~60%
🔞 Sexual offenses: ~35%
🔪 Assaults: ~40%
💉 Drug offences: ~40%
👊 Violent thefts: ~60%
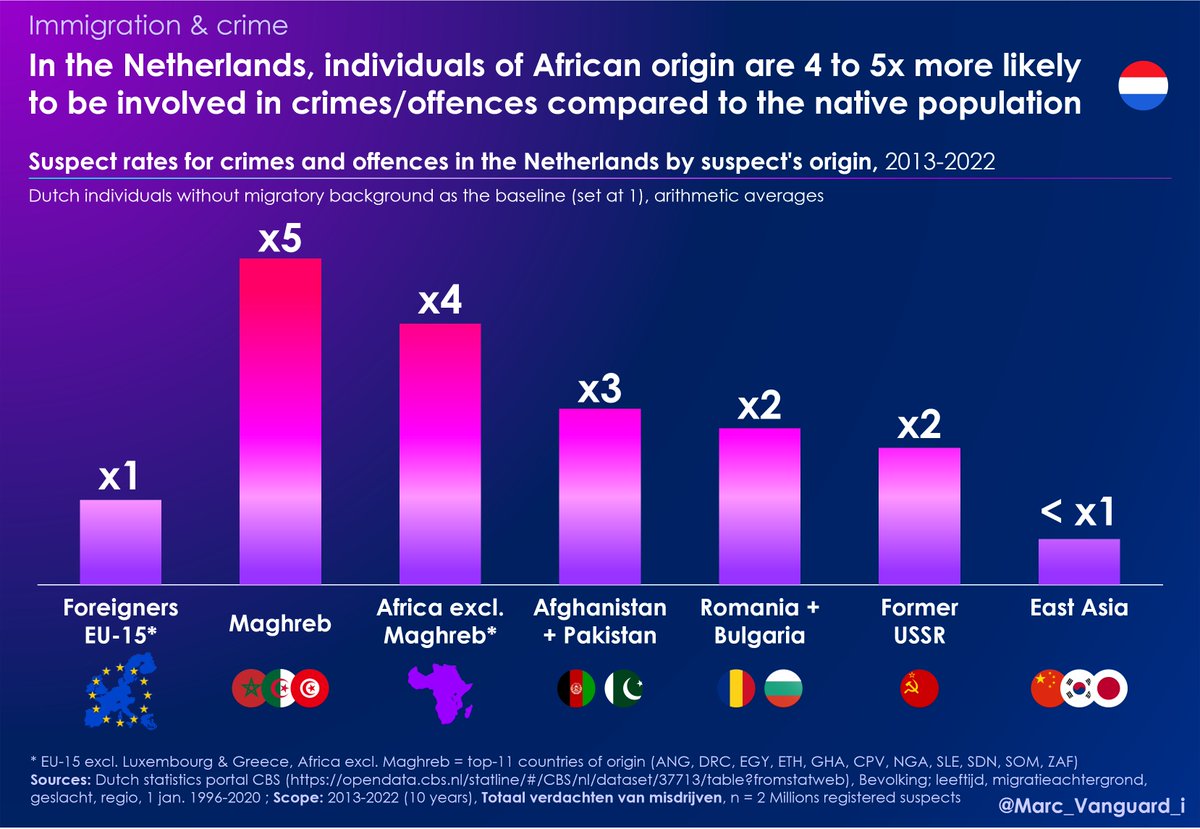
2⃣ As seen on the map below, the suspect rates vary significantly from one origin to another.
👉 Populations from Africa or the Middle East tend to exhibit rates 2 to 4 times higher than those of 'native' Dutch!
👉 Populations from Africa or the Middle East tend to exhibit rates 2 to 4 times higher than those of 'native' Dutch!

3⃣ 👉 The suspect rates for populations of Maghrebi origin are even 5 times higher than those of Dutch who have no migratory background.
👉 In contrast, populations originating from East Asia exhibit rates similar to those of 'native' Dutch
👉 In contrast, populations originating from East Asia exhibit rates similar to those of 'native' Dutch
4⃣ In the Netherlands, more than two-thirds of men of Moroccan origin have been suspected of a crime or offence before the age of 30.

5⃣ Recidivism rates are equally alarming.
👉 40% of individuals of Moroccan origin commit new offense(s) within 6 years, which is twice as much as 'native' Dutch individuals.
👉 40% of individuals of Moroccan origin commit new offense(s) within 6 years, which is twice as much as 'native' Dutch individuals.

6⃣ Let's look at crime statistics by offense as reported by the Dutch police for the year 2022.
👉 Starting with sexual offenses: the visualization below illustrates the alarming extent of overrepresentation of individuals of non-Western origin among those implicated ⬇️
👉 Starting with sexual offenses: the visualization below illustrates the alarming extent of overrepresentation of individuals of non-Western origin among those implicated ⬇️

7⃣ The suspect rate for sexual offenses among individuals of Antillean origin is 7 times higher than that of 'native' Dutch individuals!
For those of Maghrebi origin, it is 4 times higher.
For those of Maghrebi origin, it is 4 times higher.

8⃣ The crime gap can be even higher for certain offenses, such as violent thefts.
👉 The suspect rate for violent thefts among individuals of Antillean origin is more than 15 times higher than that of 'native' Dutch individuals!
👉 The suspect rate for violent thefts among individuals of Antillean origin is more than 15 times higher than that of 'native' Dutch individuals!

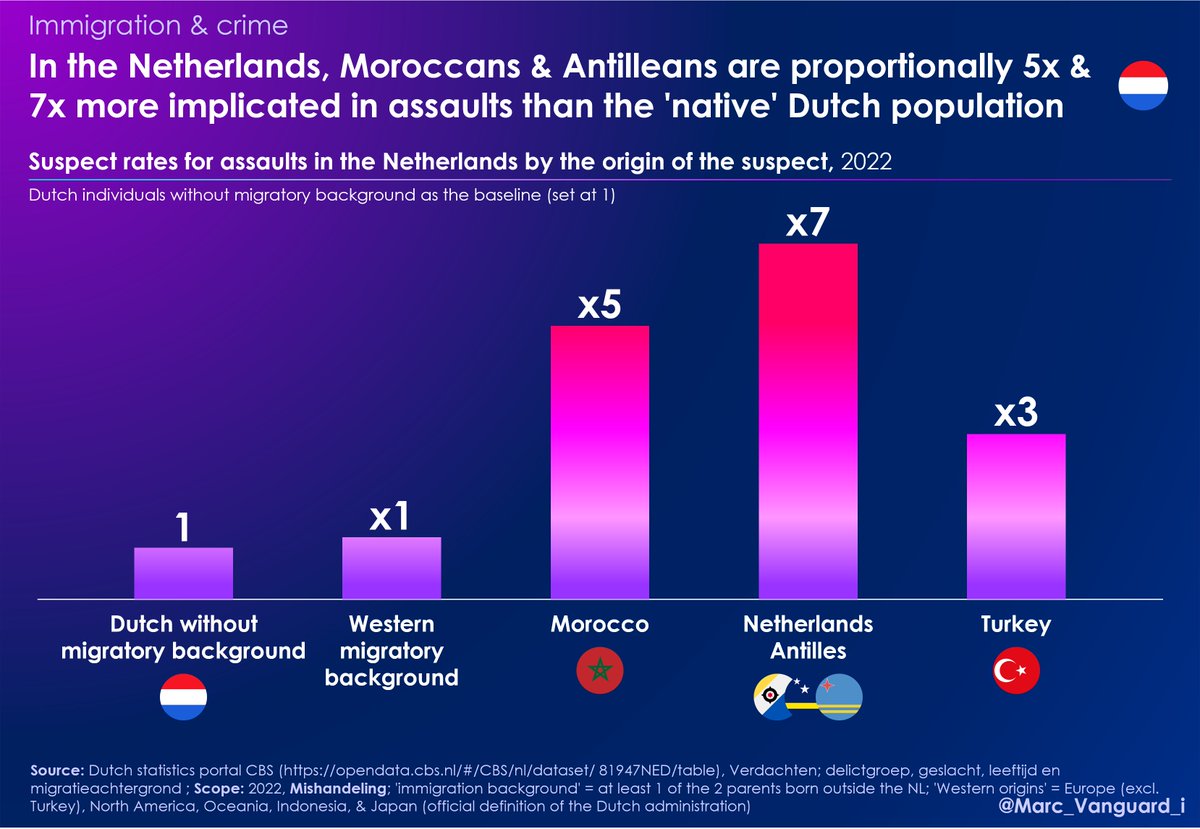
9⃣ The assault statistics align with the trends observable in the countless acts of violence that punctuate our daily news.
👉 Proportionally, Moroccans and Antilleans are implicated 5 times and 7 times more, respectively, than 'native' Dutch individuals in these offences.
👉 Proportionally, Moroccans and Antilleans are implicated 5 times and 7 times more, respectively, than 'native' Dutch individuals in these offences.
🔟 The Netherlands are plagued by drug trafficking. The powerful Moroccan Mocro Mafia has assassinated journalists and lawyers, and even carried out rocket launcher attacks against media HQs.
👉 Not surprisingly, the suspect rate of Moroccans in drug-related cases is alarming ⬇️
👉 Not surprisingly, the suspect rate of Moroccans in drug-related cases is alarming ⬇️

1⃣1⃣ "Fun" fact: Moroccans are significantly overrepresented in offenses related to driving under the influence of alcohol or drugs.
The implementation of religious principles appears to be somewhat relative at times.
The implementation of religious principles appears to be somewhat relative at times.

1⃣2⃣ The poor level of education of immigrants plays a significant role in the "over-criminality" we see here.
However, even at a similar level of education, we observe that it is still the same migratory backgrounds that are overrepresented in criminal activities:
However, even at a similar level of education, we observe that it is still the same migratory backgrounds that are overrepresented in criminal activities:

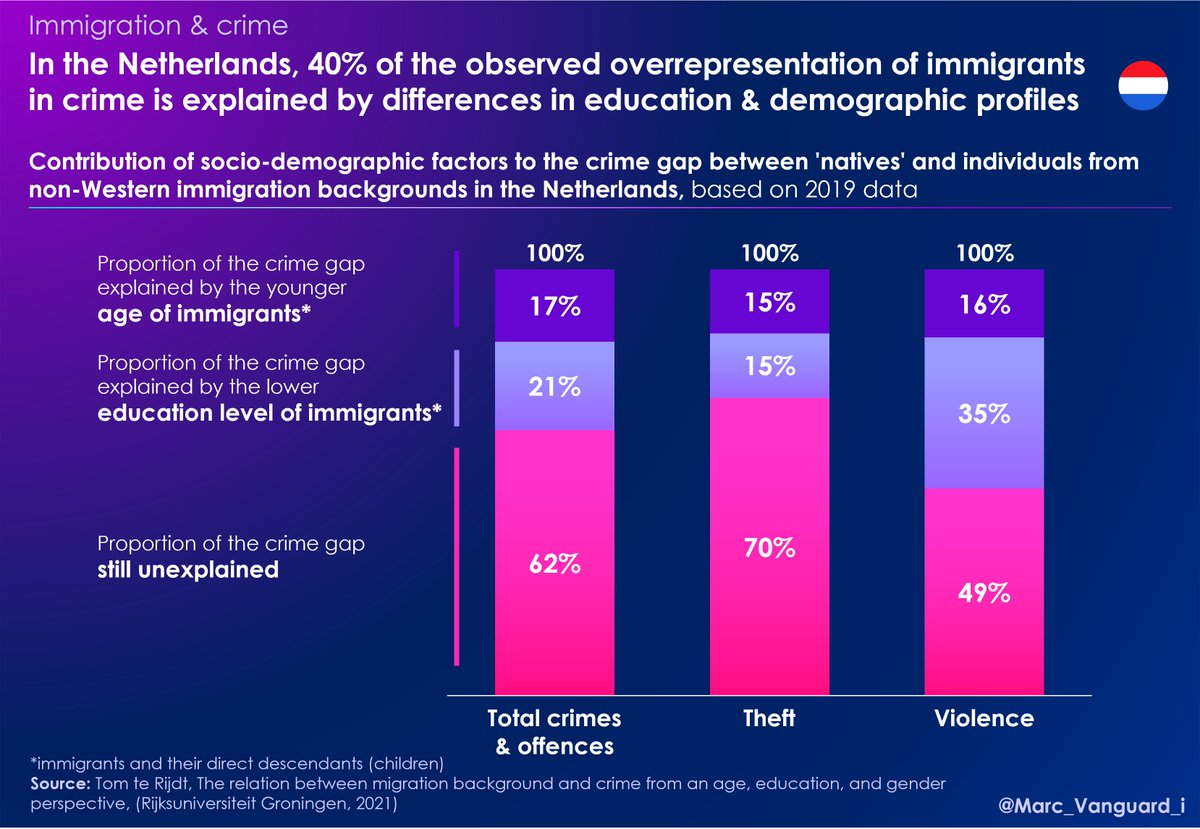
1⃣3⃣ In reality, education gaps and demographic differences would only account for 40% of the observed crime gap between "native" populations and non-Western ones.
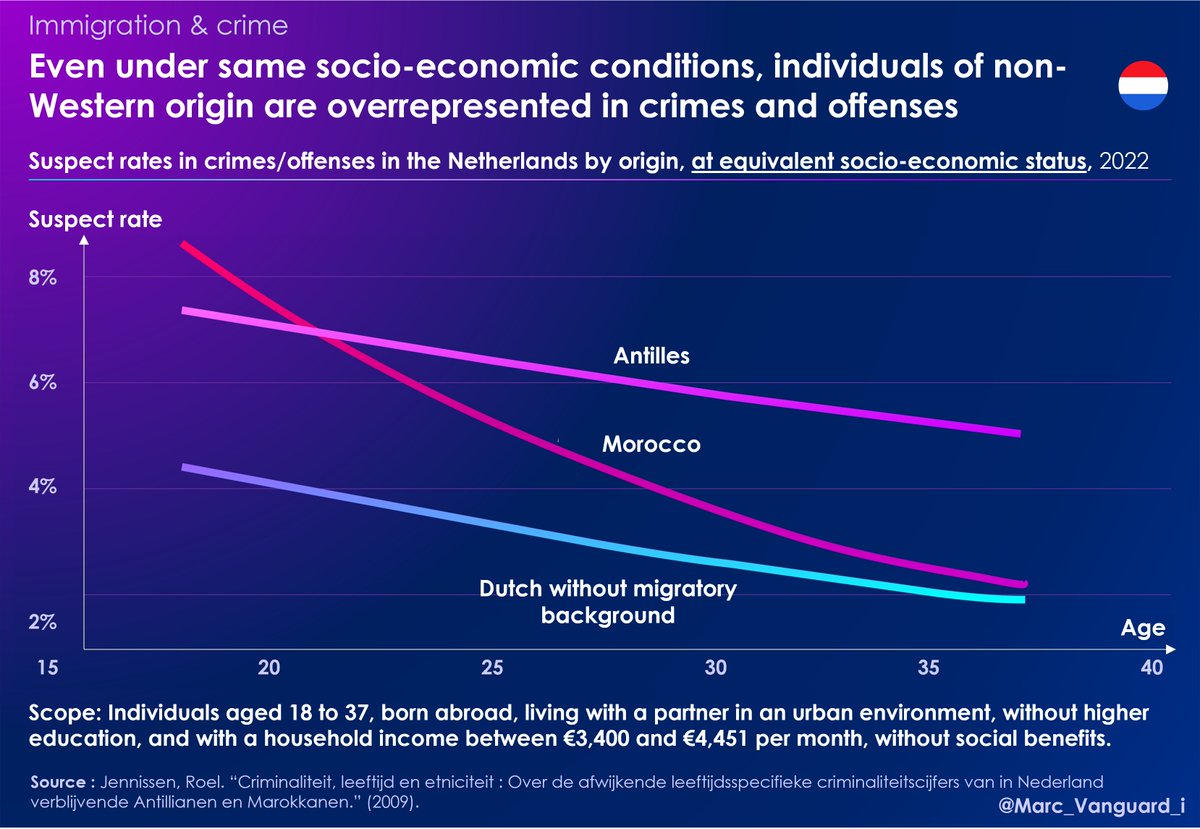
1⃣4⃣ Even more striking: even when they have similar income and age, and live in a similar environment, populations with non-Western background are more involved in criminal activities than 'native' populations.
1⃣5⃣ Some may argue that the figures are artificially inflated by an alleged 'systemic racism' within the Dutch police. However, research shows that it is either a myth or a phenomenon so negligible that its existence cannot even be demonstrated.

🔎 I encourage you to take a look at the data sources to see for yourselves the accuracy of the observations I am making here.
opendata.cbs.nl/#/CBS/nl/datas…
opendata.cbs.nl/#/CBS/nl/datas…
repository.wodc.nl/bitstream/hand…
opendata.cbs.nl/#/CBS/nl/datas…
opendata.cbs.nl/#/CBS/nl/datas…
repository.wodc.nl/bitstream/hand…
⚠️ Of course, not all criminals come from immigration backgrounds, and vice versa, not all immigrants are criminals. Violence existed before the contemporary waves of immigration.
Please interpret these figures without hatred or fatalism.
Please interpret these figures without hatred or fatalism.
🟣 However, the alarming overrepresentation of non-European immigrants in crimes & offences is an undeniable fact that our policies must take into account.
Having a critical perspective on current immigration is not a whim of the far right. It is simply a reasonable attitude.
Having a critical perspective on current immigration is not a whim of the far right. It is simply a reasonable attitude.
➡️ We must raise awareness about the link between immigration and crime. That's why I will post statistics on this topic every week, gathered from various European countries.
🔁🔁🔁 Feel free to share widely and follow my account @Marc_Vanguard_i to not miss upcoming threads 🤗
🔁🔁🔁 Feel free to share widely and follow my account @Marc_Vanguard_i to not miss upcoming threads 🤗
• • •
Missing some Tweet in this thread? You can try to
force a refresh