In this thread, @Richthebull008 and I will take you with us into a deep dive of undeniable proof of algorithmic price delivery by showing the relationship between Time and ICT's PD arrays.
Buckle up.
Buckle up.

Let’s begin with a quote from @I_Am_The_ICT
“My PD arrays are algorithmic signatures, but they are not really what is going on behind these markets.”
What could possibly be going on then?
“My PD arrays are algorithmic signatures, but they are not really what is going on behind these markets.”
What could possibly be going on then?

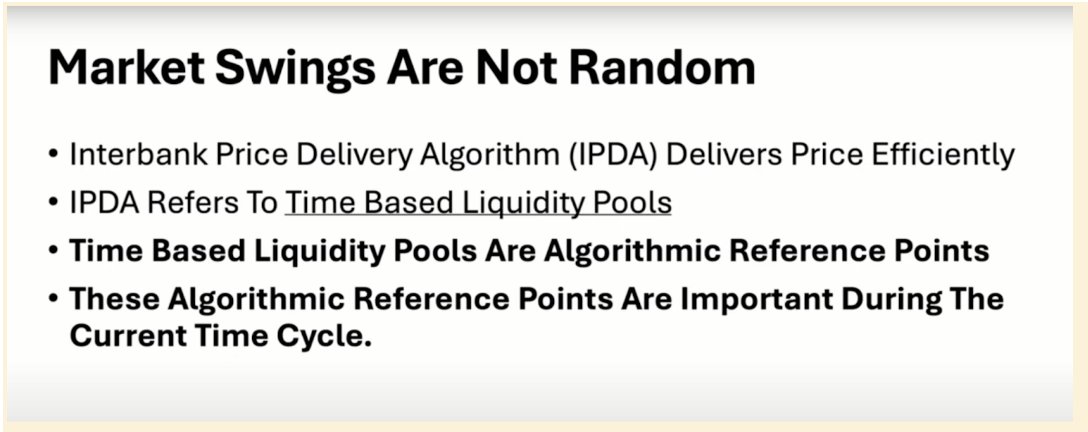
A rather common saying within the ICT community nowadays is that PD arrays which form during ‘Killzones’ hold significance. We would like to expand on this understanding and offer way more precision.
Introducing TAPDA theory: ‘Time and PD Arrays Theory.’
Introducing TAPDA theory: ‘Time and PD Arrays Theory.’
The foundation of TAPDA is that PD arrays by themselves are not significant, but the timings at which they forms are.
If a PD array forms at a specific Time of Day and price comes back to that PD array at the same Time of Day, but at a later point in Time, we anticipate that PD array to act as support or resistance on price. If it does not, it is the first sign of a CSD.
Let’s look at a few examples.
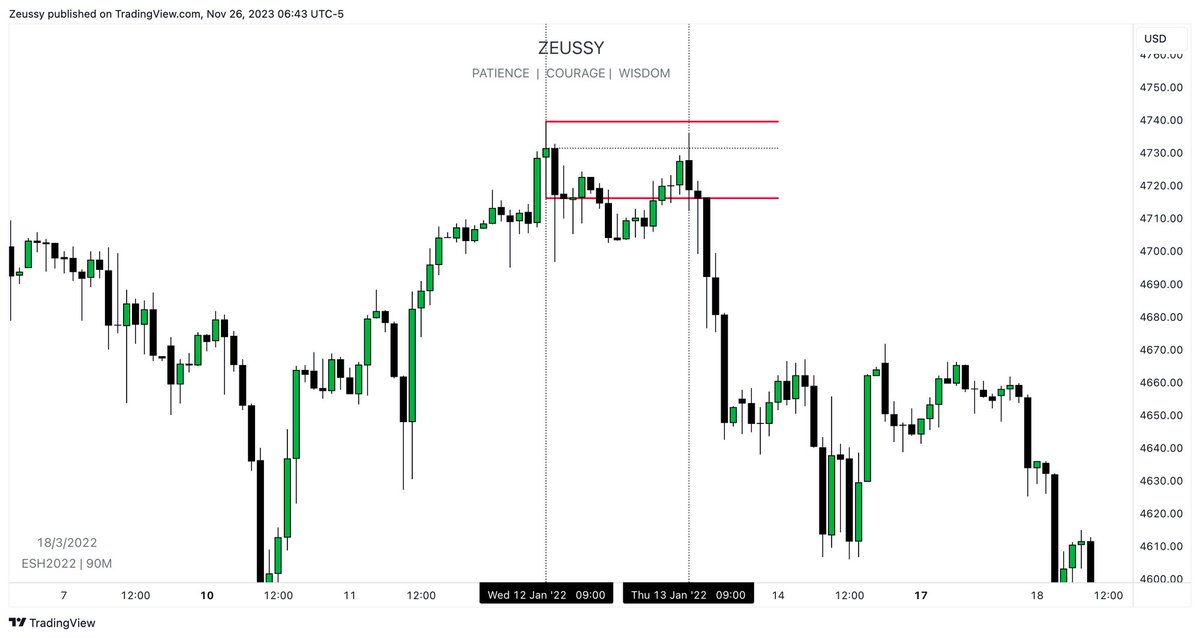
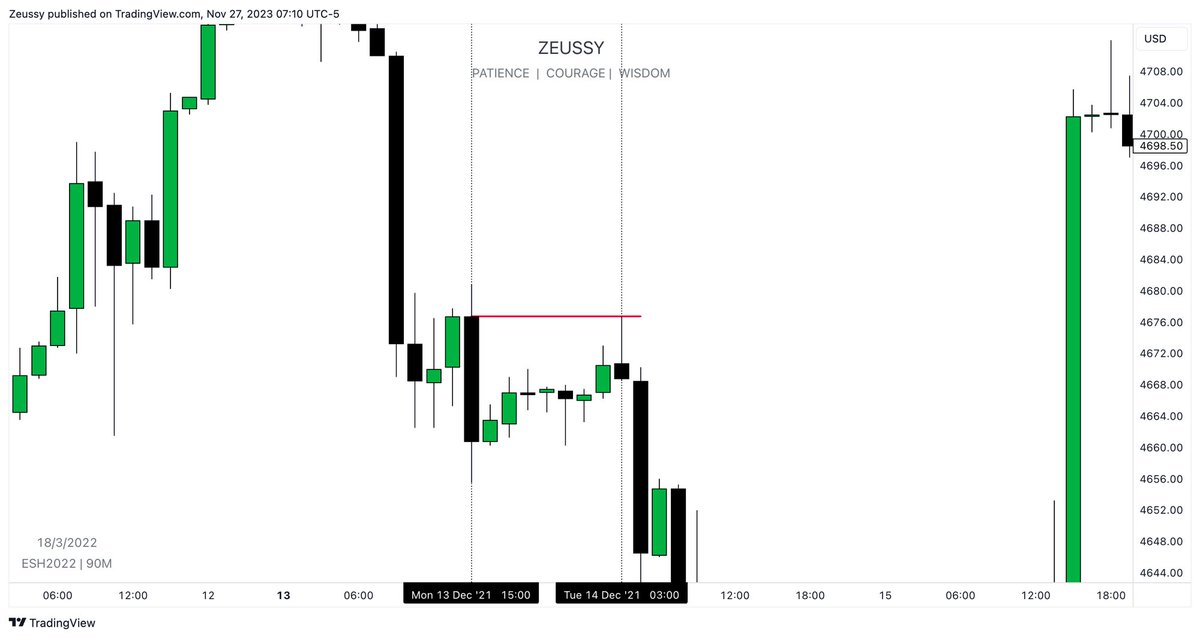
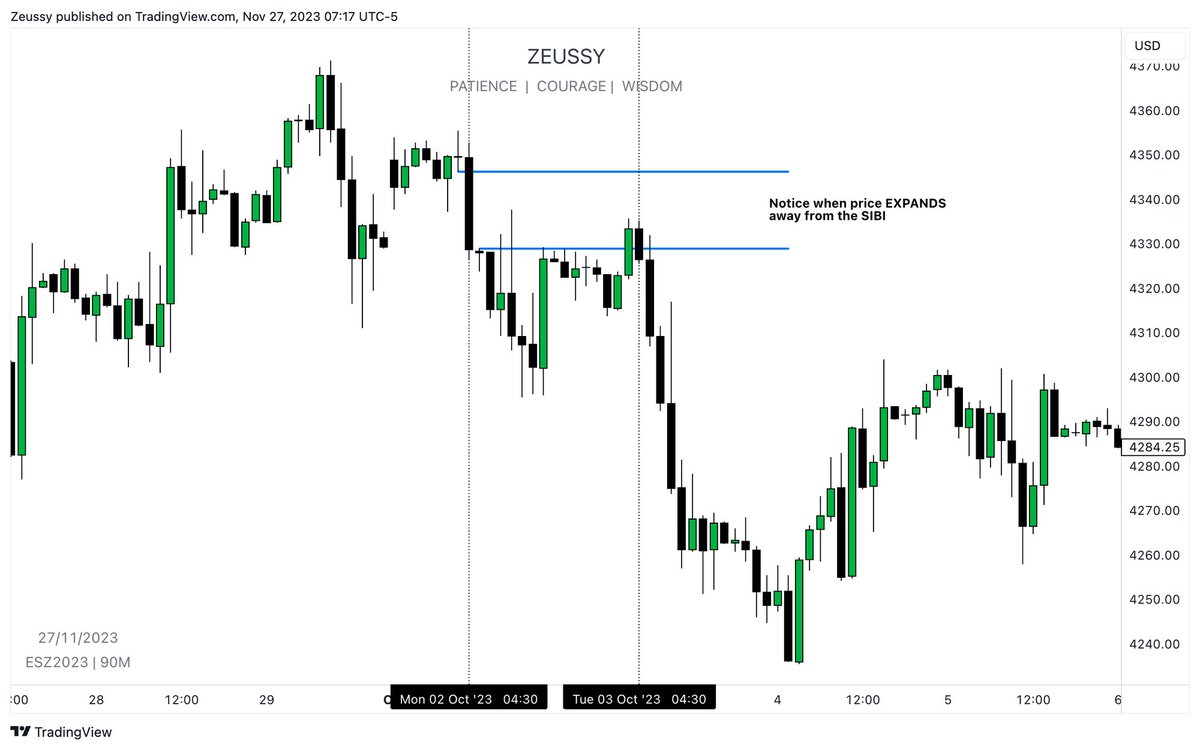
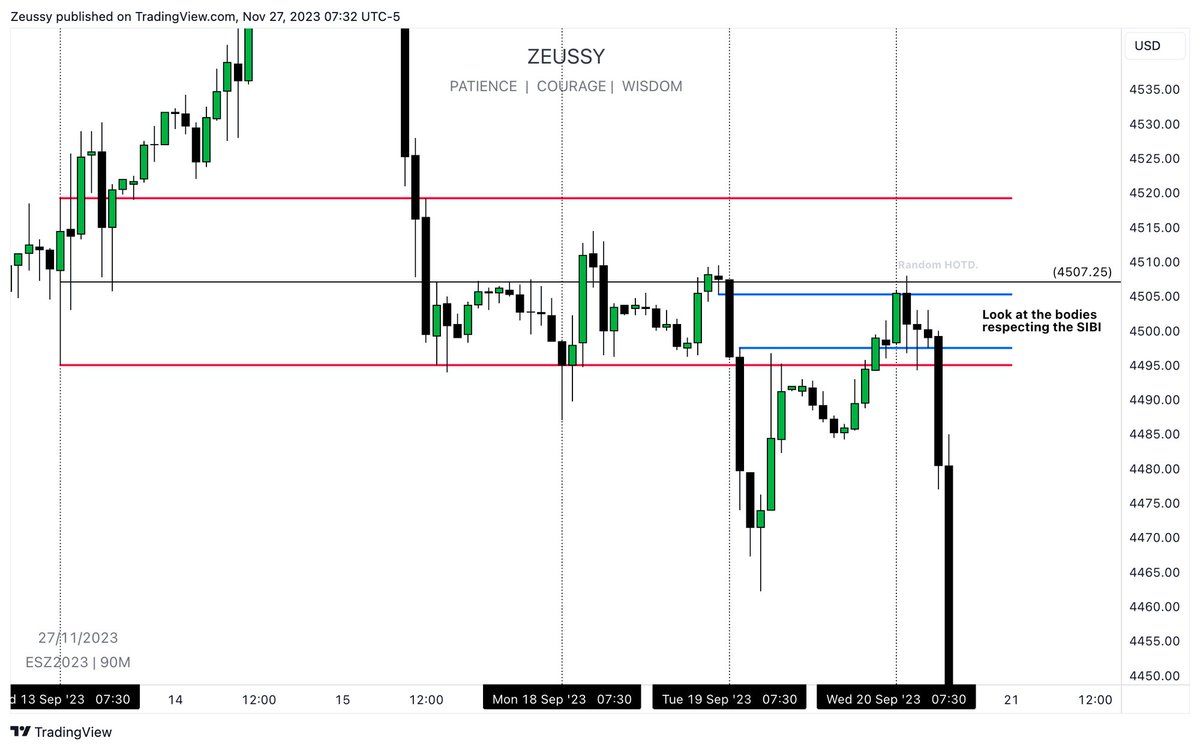
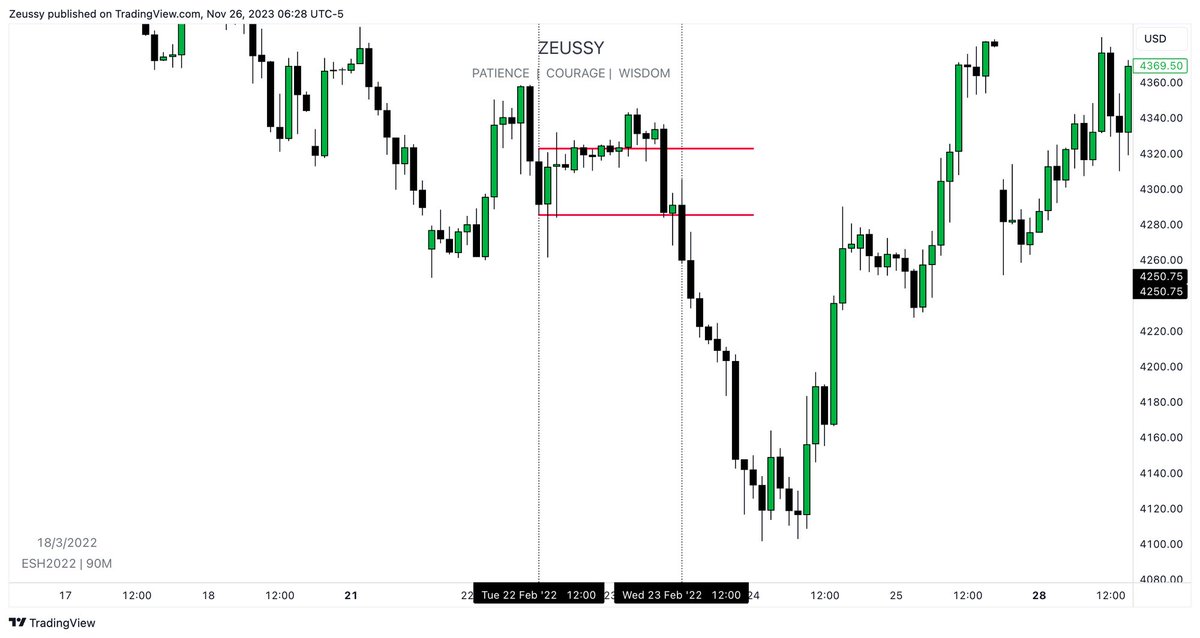
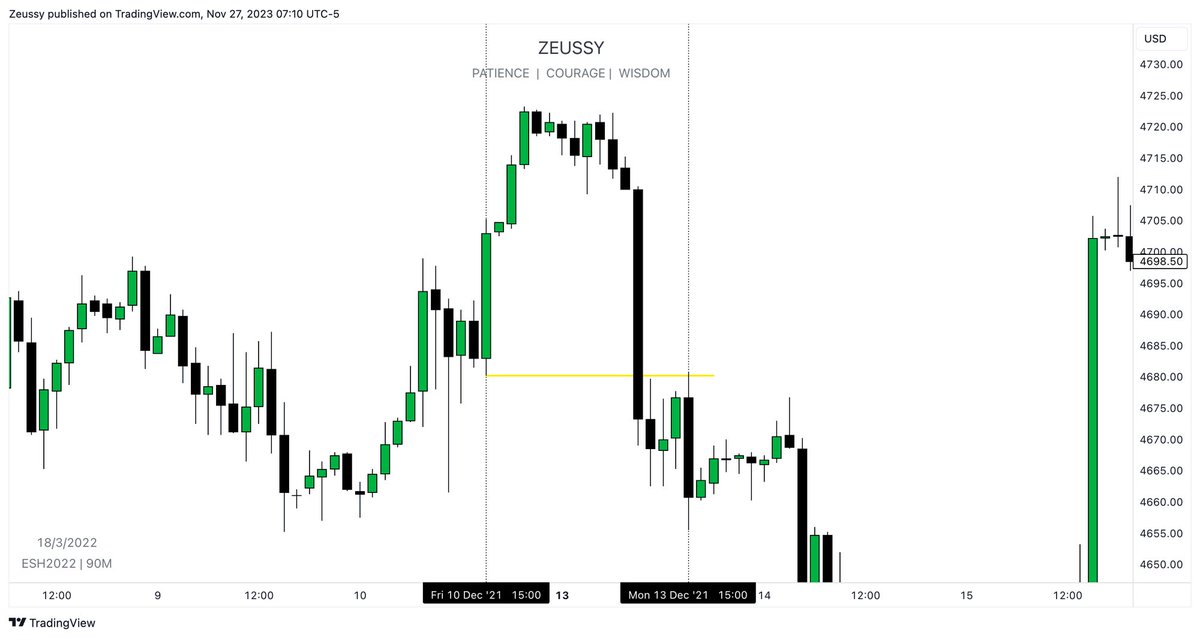
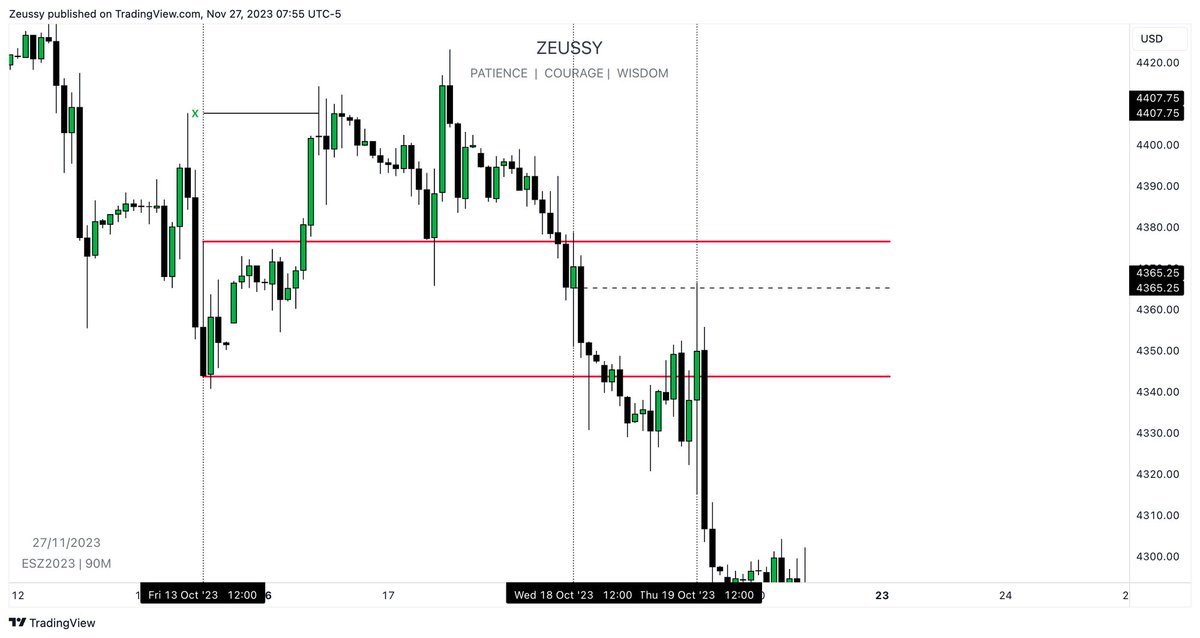
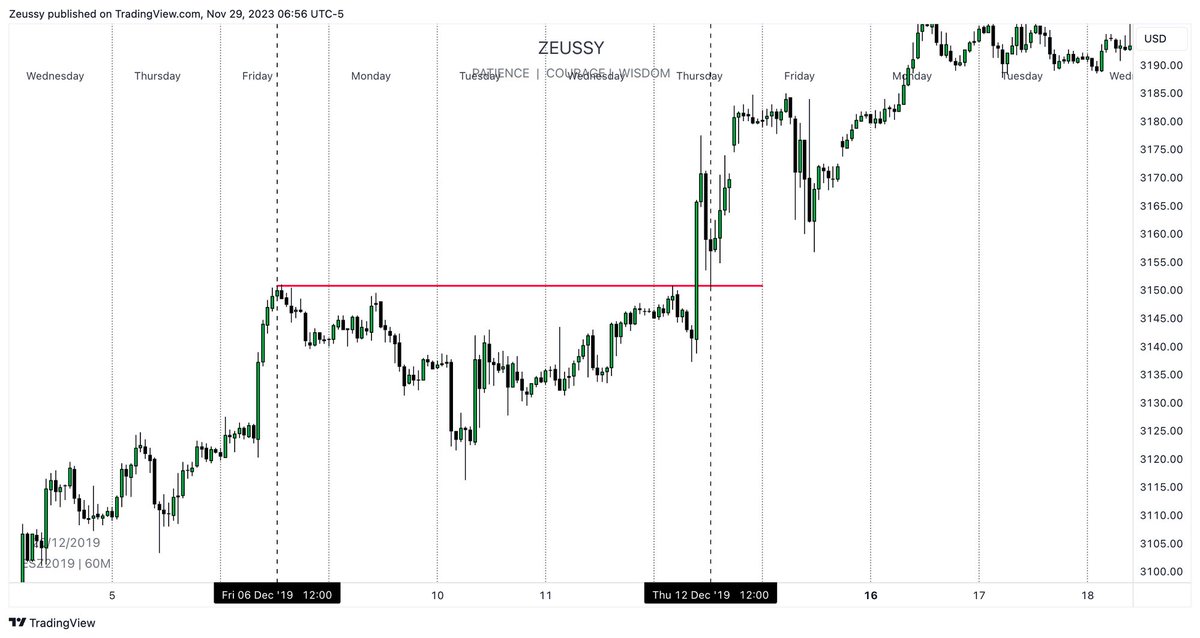
For our examples, we have chosen to put emphasis on the 90 minute candles for $ES. Pay close attention to how price reacts to the previous X time’s price range at exactly the same time, but at another day...
For our examples, we have chosen to put emphasis on the 90 minute candles for $ES. Pay close attention to how price reacts to the previous X time’s price range at exactly the same time, but at another day...
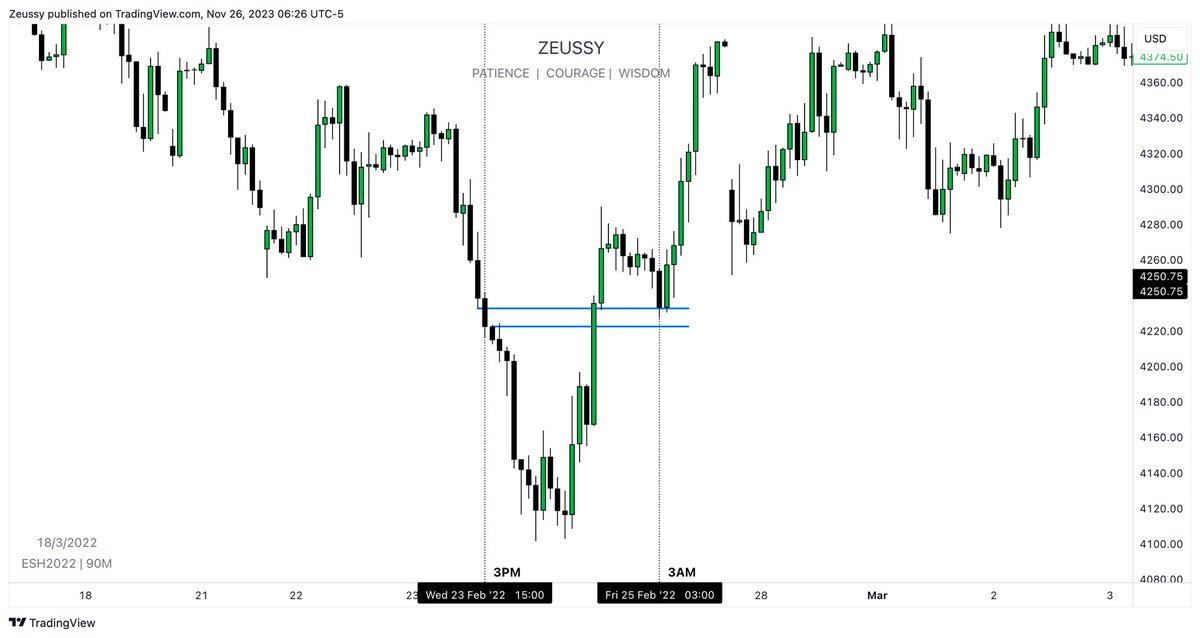
3PM, 3AM.
04:30AM, 04:30AM.
07:30AM, 07:30AM.
3PM, 3AM
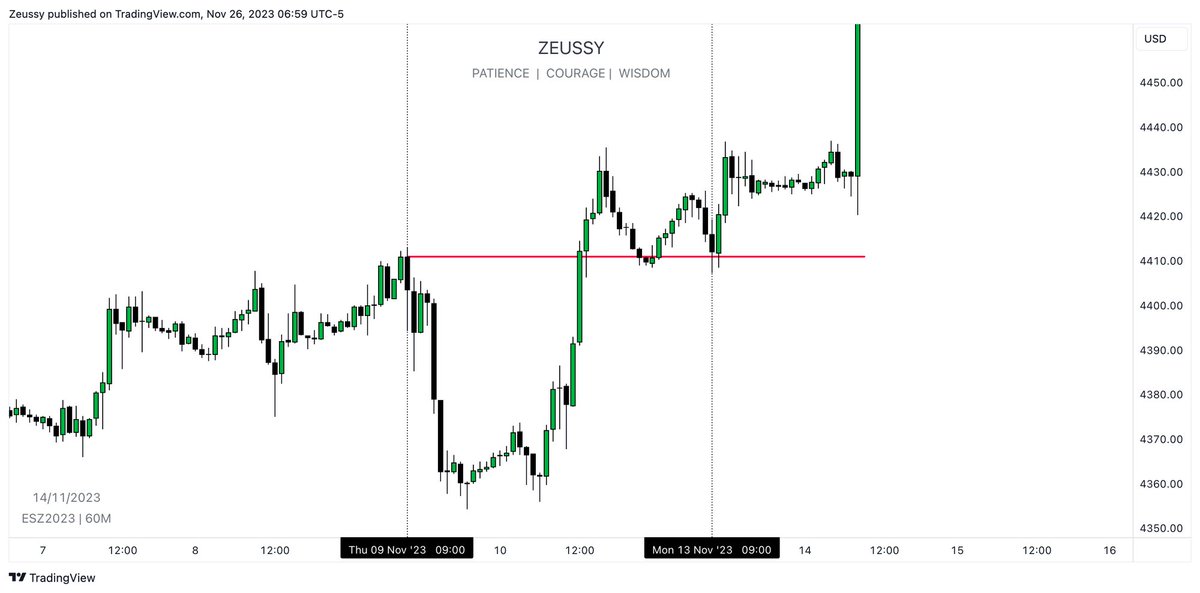
9AM, 9AM.
12PM, 12PM.
12PM, 12PM.
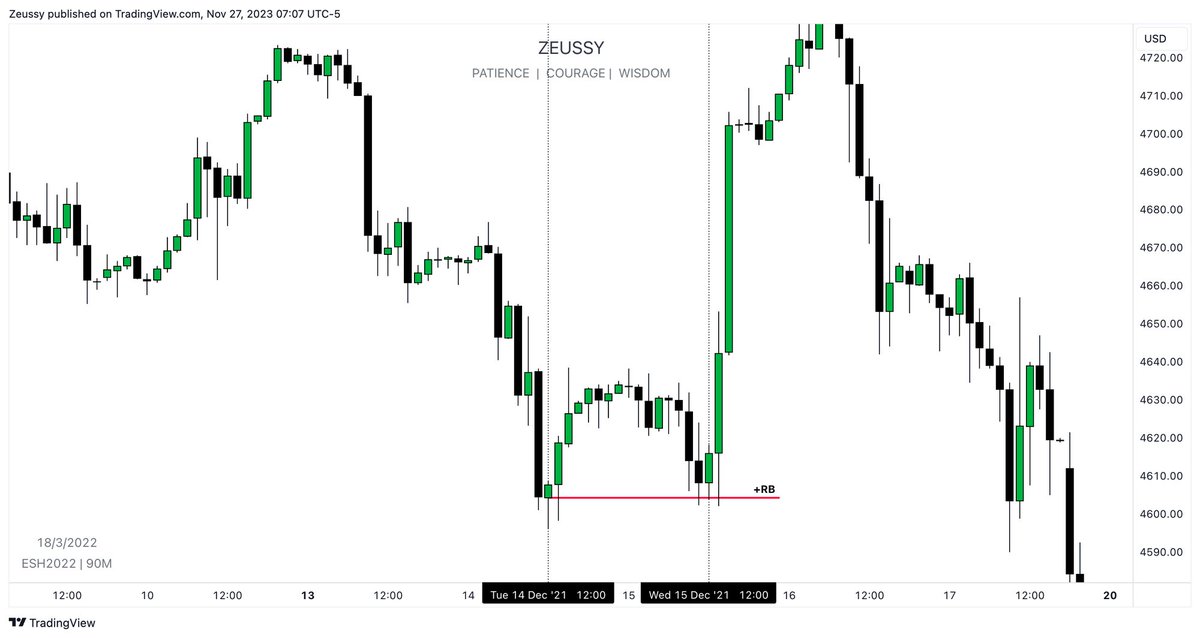
3PM, 3PM
12PM, 12PM.
12PM, 12PM.
We have come to the end of this thread. Instead of just ending it here, we have released the recording of a TOTK livestream in which our findings with regards to TAPDA theory where shared for the first time.
You can watch it here ⬇️
You can watch it here ⬇️
https://x.com/Richthebull008/status/1729965880778383446?s=20
For some reason Twitter removed the stream link from the previous Tweet so here it is again:
https://twitter.com/Richthebull008/status/1730026993272455585
• • •
Missing some Tweet in this thread? You can try to
force a refresh