1. Rustbelt Revivals - fascinating new paper by Enrico Moretti & others (via @lydiadepillis) on why & how deindustrialized Rustbelt regions recover: nber.org/papers/w31948
2. Lots there but here are my main takeaways ...
3. Across the US and Europe more than a third (34%) of deindustrialized Rustbelt metros recovered better than pre-deindustrialization.
4. German metros, and to some extent other European metros recovered more than US metros.
5. To me this is evidence of the efficacy of what Henry Ergas long ago called deepening as opposed to shifting strategies for technology-based economic development.
6. Shifting strategies, as their name implies, emphasize shifting away from incumbent industries like steel or chemicals or automotive in favor of new high-tech industries like semiconductors, computers, biotech etc.
7. Shifting is the kind of strategy deployed by the US and also can be seen in how US regions try to cope with deindustrialization. Boston shifting from textiles & boot and shoe industries in the 1950s & 60s to new high tech sectors. ...
8. Pittsburgh doing something similar shifting from steel and heavy industry to high-tech software robotics etc.
9. Deepening is the approach favored by Germany - by applying new technology to upgrade incumbent industries.
10. The study also finds that human capital ( share of college grads) is a big factor in successful adaptation and recovery of deindustrialized Rustbelt communities.
11. I see this as pointing in the direction of what I term industry-transforming industrial and technology policy. And this is something that the US Rustbelt & Heartland are ripe for now. And it is enhanced by the shift to place based industrial policy.
12. A new suite of technologies - electrification, software, robotics, self-driving, connected cars, smart mobility - now auger for the transformation of incumbent industries in the US Heartland/Rustbelt.
13. They also suggest that it makes sense to increasingly work to fuse regional R&D capabilities at universities & grow & scale college towns.
1. Deep dive into mobility in America. The big takeaways. Lower income, less educated Americans are stuck in place their lack of mobility, explains the lack of mobility in America.
1. Super interesting new NBER paper on "Covid and Cities, Thus Far by Gilles Duranton & Jessie Handbury. Worth a quick thread on its main thrusts: nber.org/papers/w31158
2. Their main thesis is that "working-from-home changes the household location decision in two ways: the first is a reduction in commuting costs and the second is a reduction in, or tax on, the space one can consume at home to make room for an office."
3. They refer to this as a: "'commuting dividend’ & ‘home-office tax.’ Taken together, these two forces imply an increase in the aggregate demand for housing."
1. This chart shows the evolution of America's class structure from 1800-2020. It is based on data on occupations or the kinds of work Americans do.
2. It divides the class structure into 4 main classes:
The Working Class who engage in manual labor in factories & related, maintenance, & construction.
The farming or agricultural class.
The service class who engage in the delivery of routine services, and ...
3. The creative class in knowledge, professional and creative occupations who principally use their mental labor in their work.
2. First off, as the authors describe there is a basic numbers issue at work: "because the number of research papers overall has skyrocketed ...while the number of disrupted papers has stayed roughly constant, the fraction of all papers that are disruptive has declined." ...
3. ""We are not saying [the difference reflects] the quality of the work" ...The difference is that the more recent papers describe consolidating rather than disruptive inventions." spectrum.ieee.org/disruptive-tec…
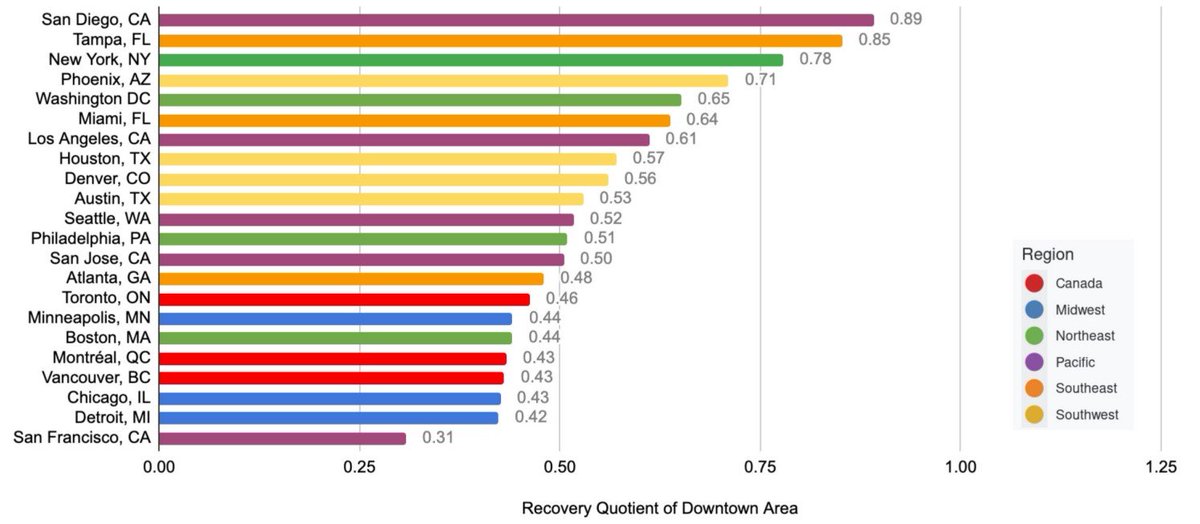
1. Take a close look at this chart. It a very different & very useful take on downtown recovery of North American cities by my @UofTCities colleague @profchapple.
2. it is based on "visits" by 18 million smartphones to downtown points of interest by SafeGraph. As the study notes: "This indicator is much more comprehensive than office vacancy rates, public transportation ridership, and retail spending totals."
3. The study is based on cellphone"visits" to 62 downtown areas in North America from pre-pandemic 2019 to May 31, 2022. The full study is here: schoolofcities.utoronto.ca/death-of-downt…
1. A short thread on the future or new reality of work. We too often think in binaries - work from home vs. work from the office. But the reality is we have been shifting toward more flexible work for several decades now. COVID again simply accelerates this shift.
2. Some stats:
Trend in work from home or remote work. It has been growing for a while ...
Less than 1% in 1980.
2.4% in 2000
5% in 2018 @I_Am_NickBloom projects 20% of workdays remote post-pandemic.
3. And since remote work is highly concentrated among knowledge, professional & creative workers, this suggests as much as 40-50% of their workdays could be remote going forward.