🤖 Struggling to understand Linear Regression?
Don't worry, you're in the right place!
Let's explore the world of Linear Regression together. 👇🏽
Don't worry, you're in the right place!
Let's explore the world of Linear Regression together. 👇🏽

0️⃣ Linear Regression
Linear Regression is a simple statistical regression method, making it perfect for beginners in predictive analysis.
You can perform Linear Regression with multiple variables or just one.
Let's keep things simple and fun for now! We'll focus on using a single variable today, so it's easier to grasp. 😊
As known as Simple Linear Regression or Univariate Linear Regression.
1️⃣ Linear Regression - Visual Explanation
In simple Linear Regression, we use one independent variable to predict a dependent variable.
🎯 Goal: Find the best-fit line that represents the trend in the data.
For example, you can recognize trends in stocks or house prices.
In simple Linear Regression, we use one independent variable to predict a dependent variable.
🎯 Goal: Find the best-fit line that represents the trend in the data.
For example, you can recognize trends in stocks or house prices.

2️⃣ Linear Regression - Mathematical Explanation
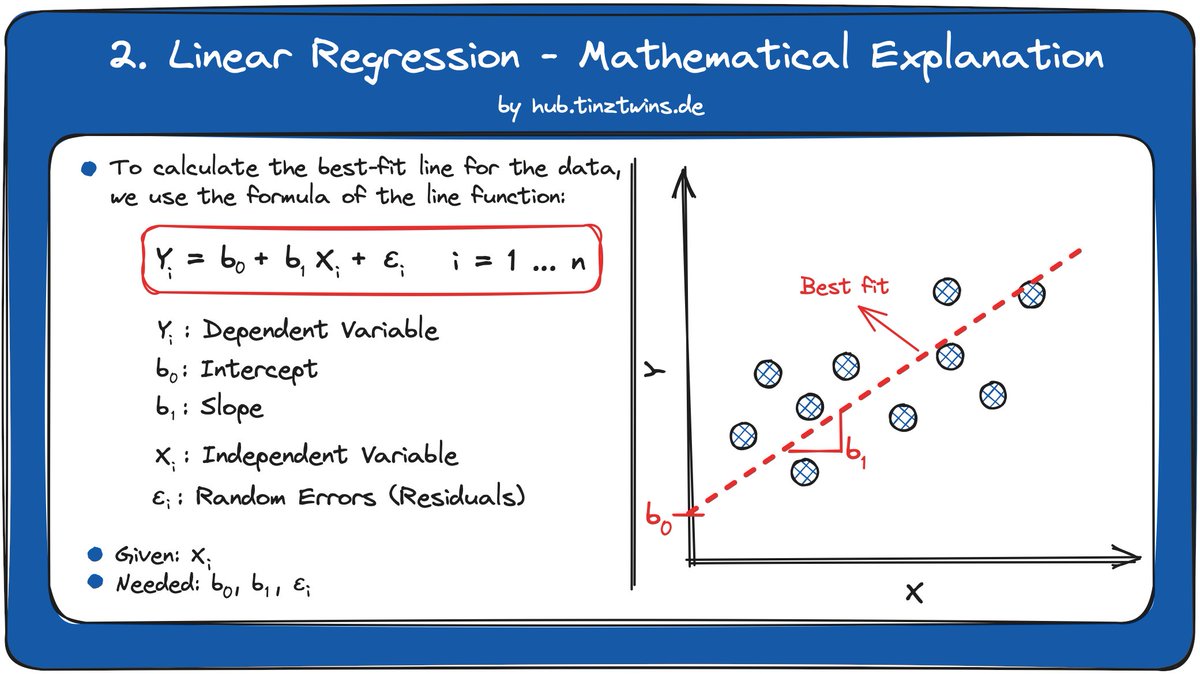
The linear relationship between the dependent variable Y (outcome) and the independent variable X (predictor) can be represented by the line function.
To calculate the best-fit line for the data, we use the formula of the line function.
The linear relationship between the dependent variable Y (outcome) and the independent variable X (predictor) can be represented by the line function.
To calculate the best-fit line for the data, we use the formula of the line function.
3️⃣ How can we calculate the Residuals?
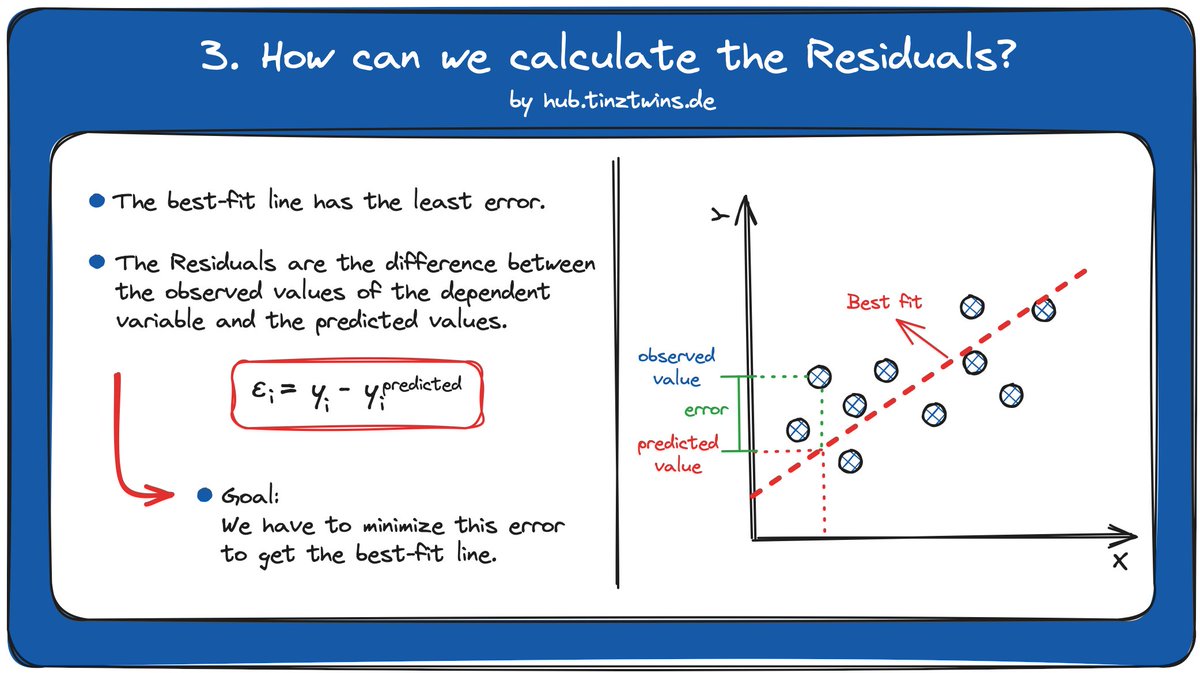
The best-fit line has the least error.
🤔 But how can we calculate this error?
The error is the difference between
- the observed values (dependent variable) and
- the predicted values (dependent variable).
We have to minimize this error to get the best-fit line.
The best-fit line has the least error.
🤔 But how can we calculate this error?
The error is the difference between
- the observed values (dependent variable) and
- the predicted values (dependent variable).
We have to minimize this error to get the best-fit line.
4️⃣ How can we calculate the Intercept and the Slope?
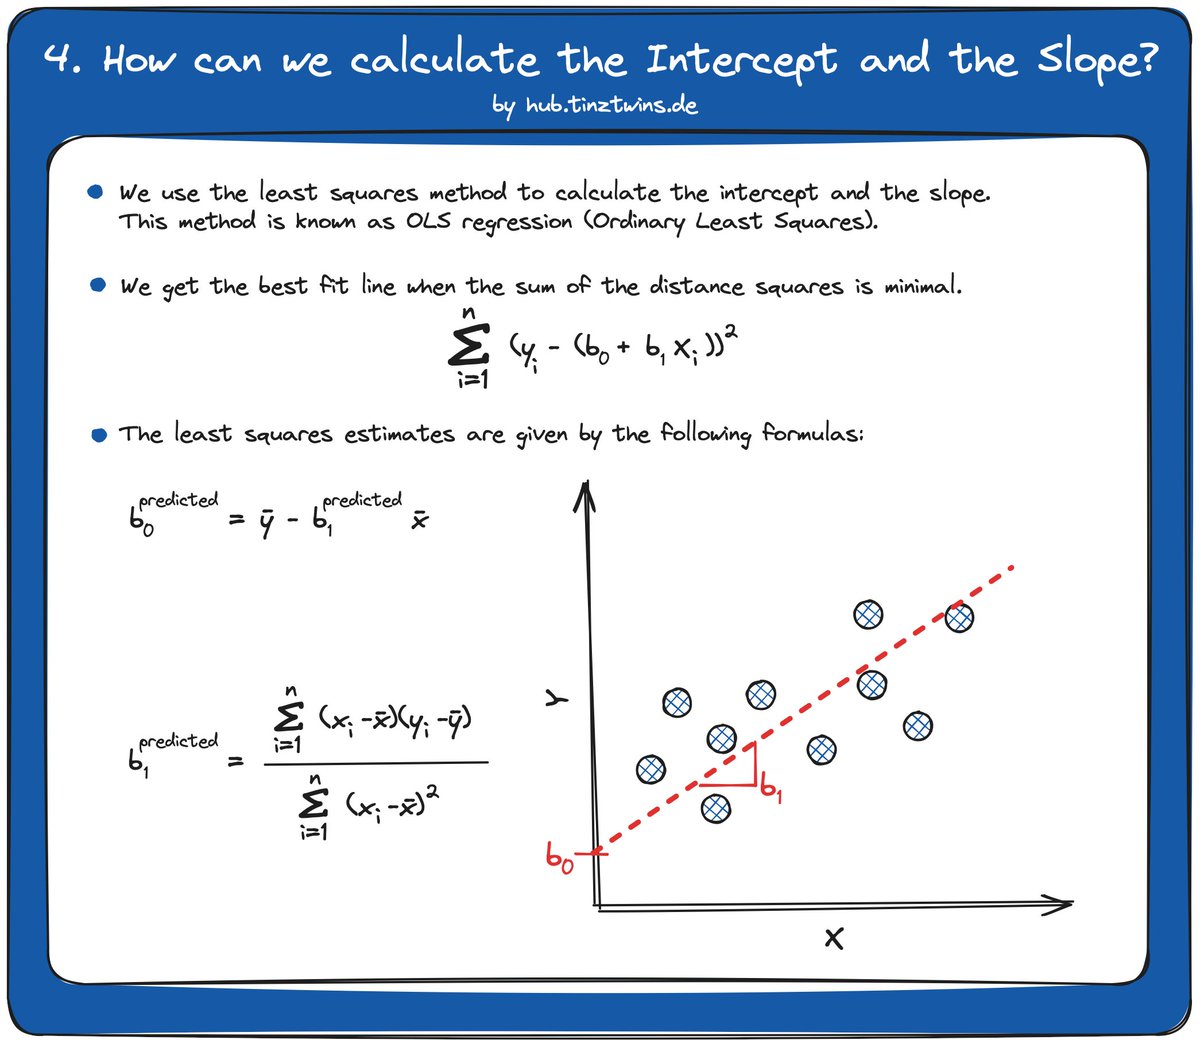
We use the least squares method to calculate the intercept and the slope.
The least squares method is referred to in the literature as OLS regression (Ordinary Least Squares).
We get the best-fit line when the sum of the distance squares is minimal.
Here are the estimators for Intercept and Slope 👇🏽
• • •
Missing some Tweet in this thread? You can try to
force a refresh