Spectre Profile picture
Jan 3, 2024 • 8 tweets • 3 min read • Read on X
Internal & External Range Liquidity

Bias made easy

A thread 🧵 Image
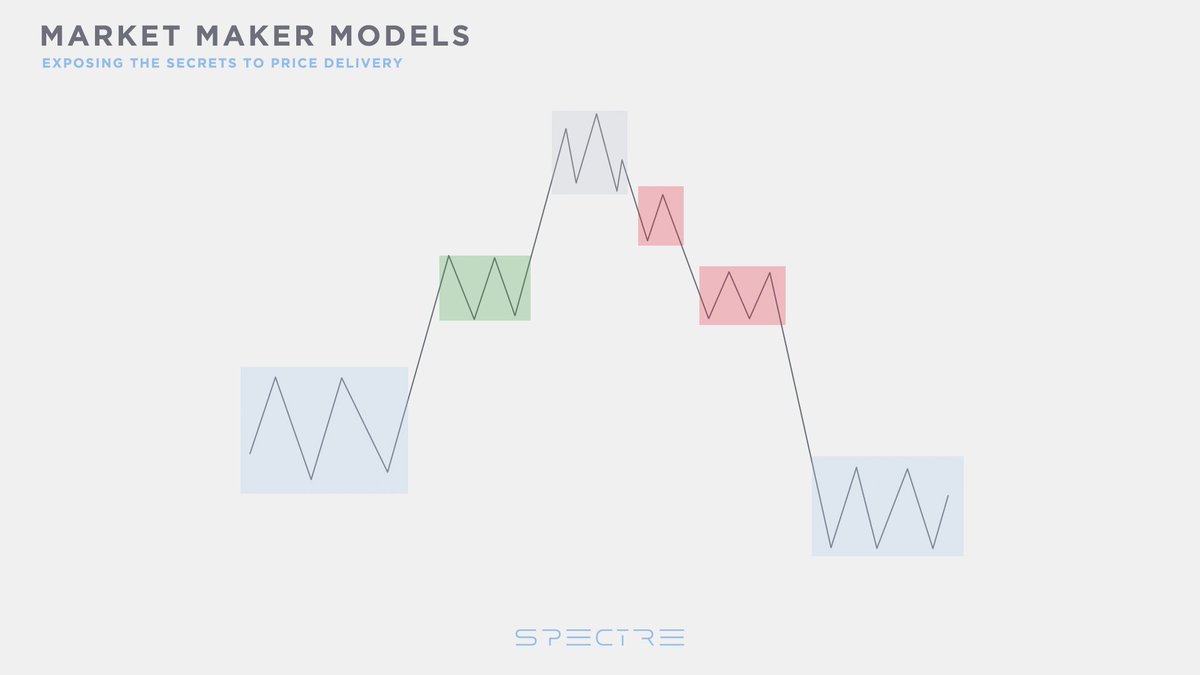
External range liquidity are the swing highs and swing lows of a range. Image
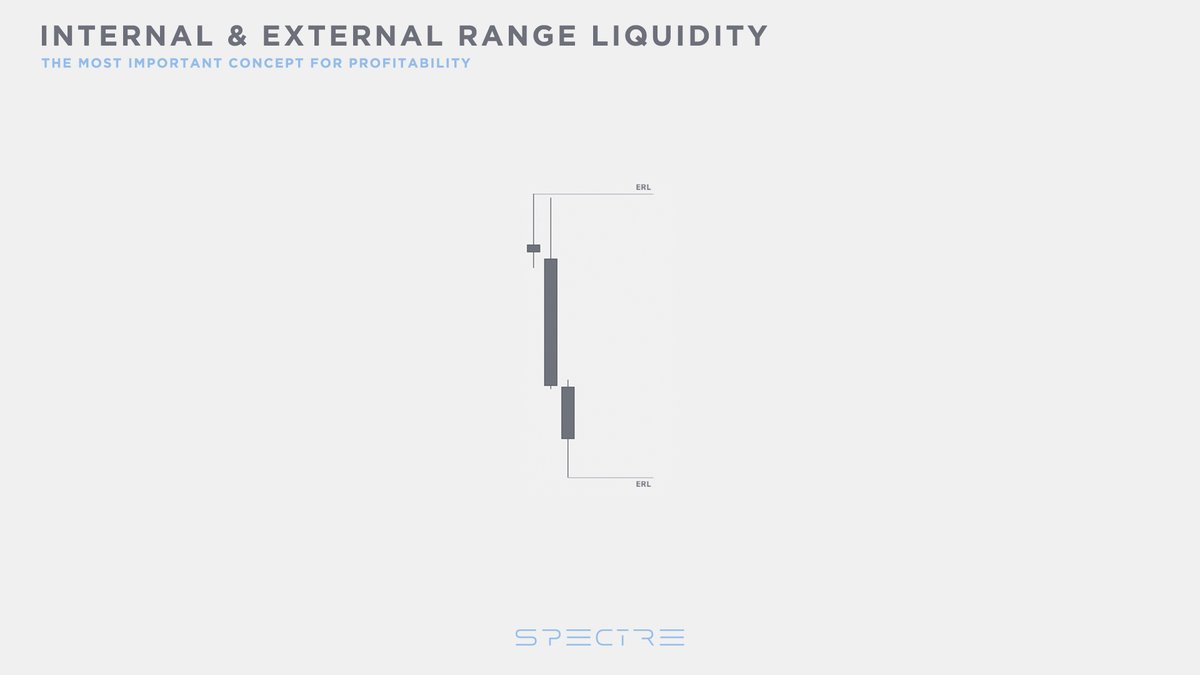
Internal range liquidity are the Imbalances / Fair value gaps left behind within the range. Image
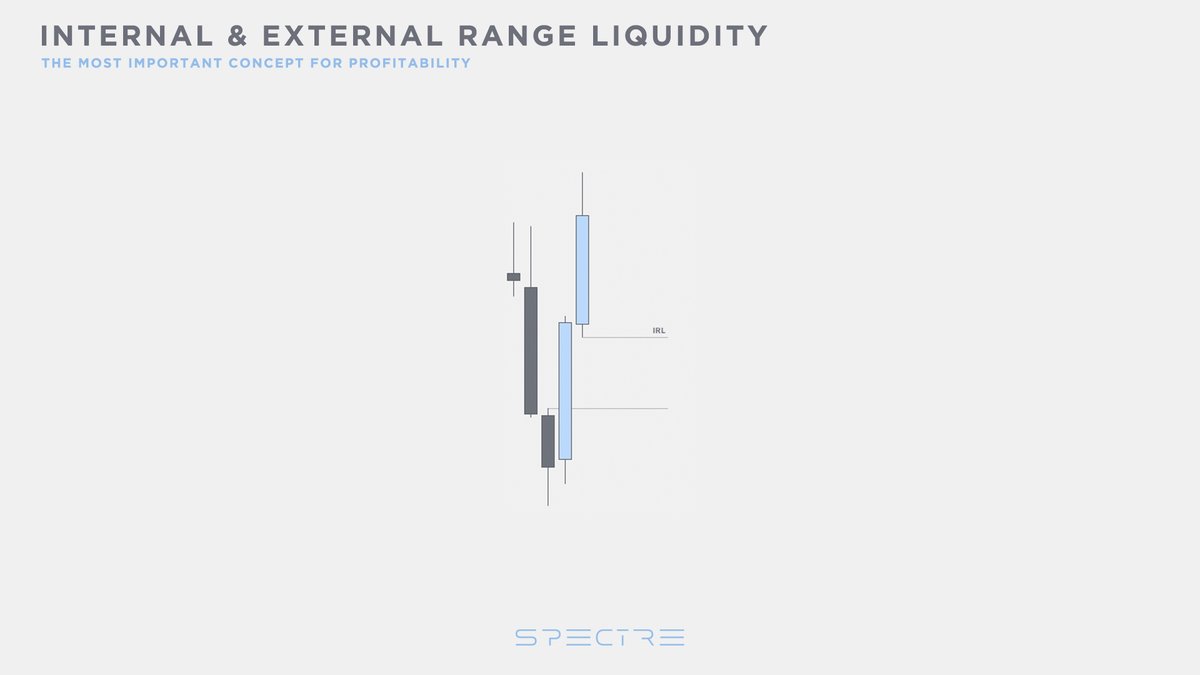
When price takes out an external range liquidity, you should anticipate a return into the range to target internal range liquidity. Image
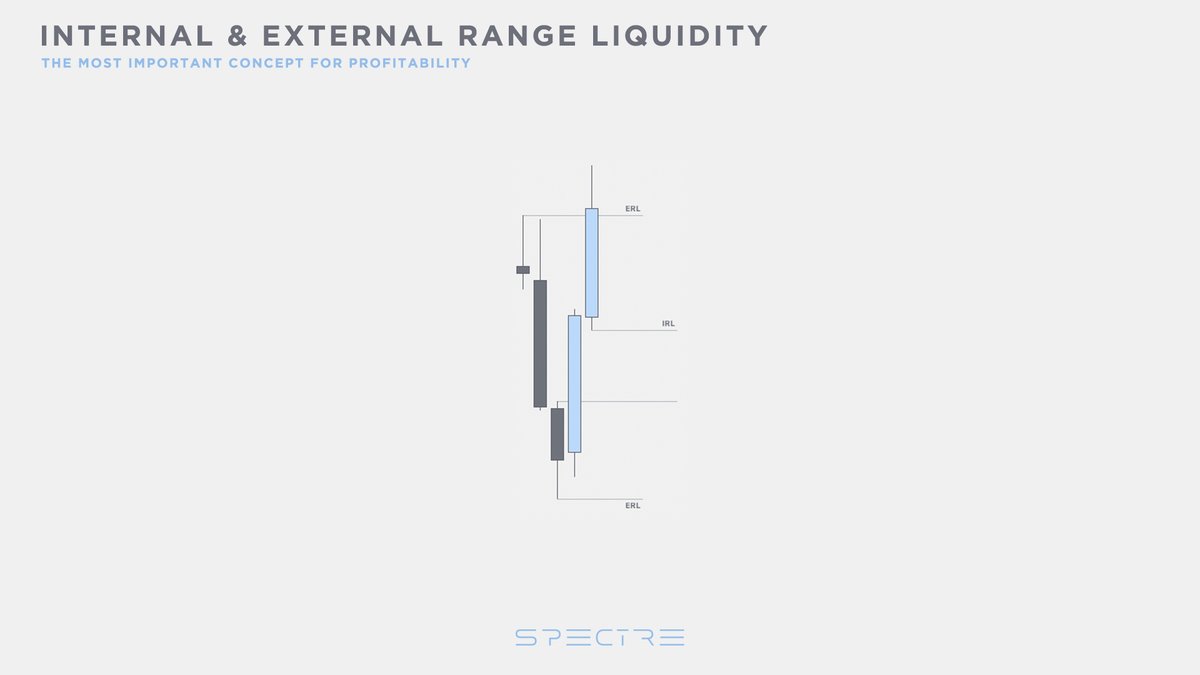
Here is a textbook example.

External ⇒ Internal. Image
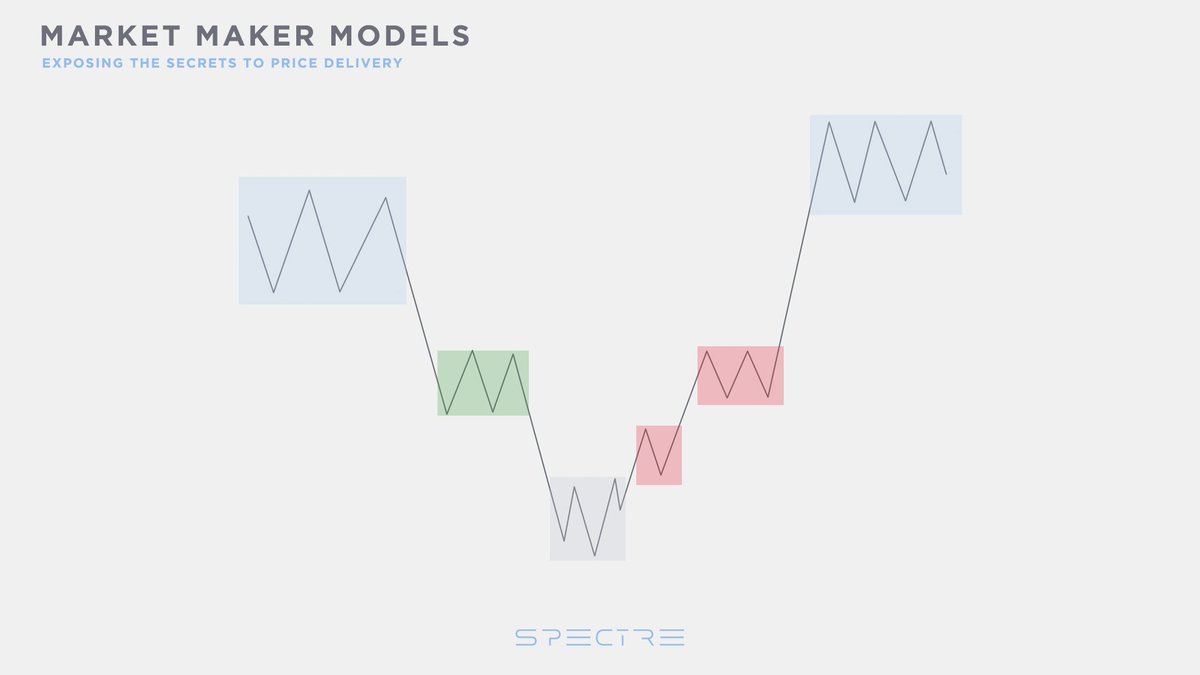
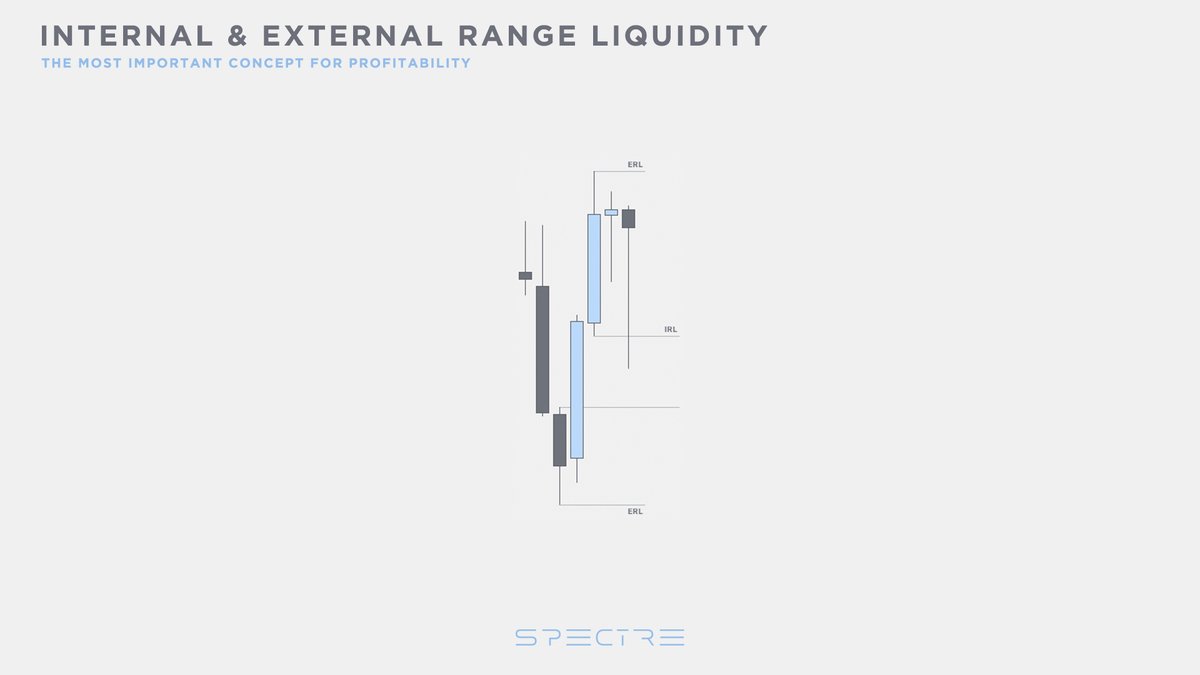
Your new external range high now becomes the highest swing high of the range after the internal range liquidity was rebalanced.

Now you should anticipate external range liquidity to be your next target.

Internal ⇒ External.
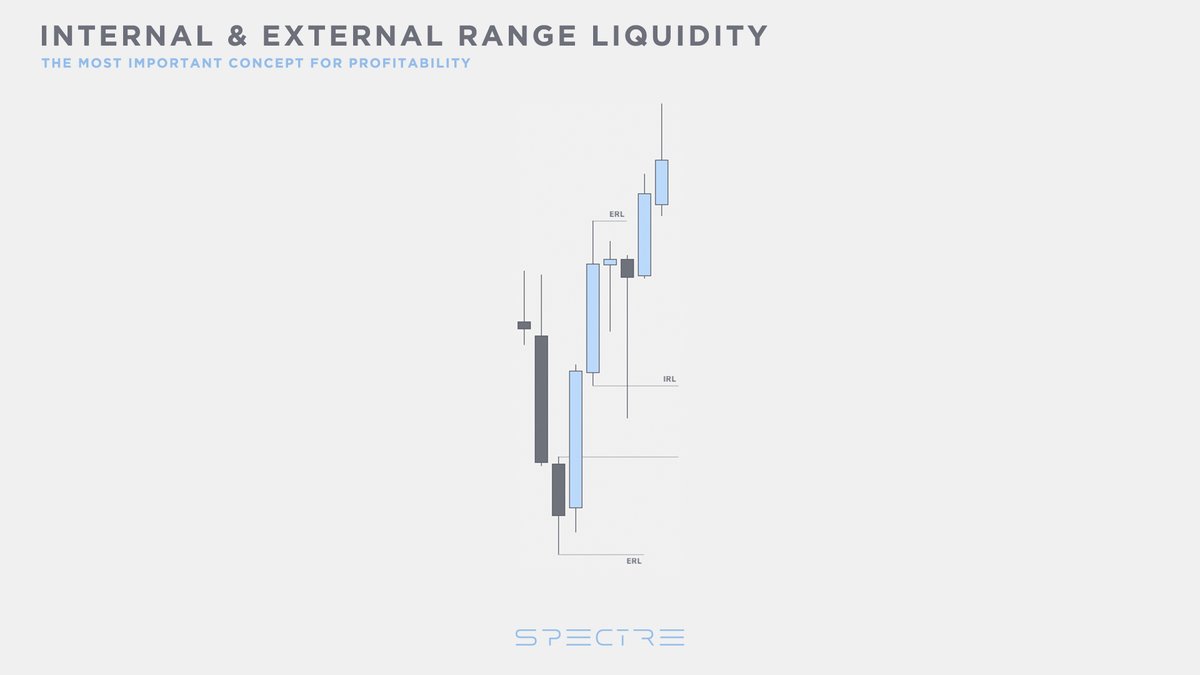
 Image
There you have it.

Internal ⇒ External ⇒ Internal ⇒ External ⇒ Repeat. Image
Detailed video explanation šŸ‘‡

• • •

Missing some Tweet in this thread? You can try to force a refresh
怀

Keep Current with Spectre

Spectre Profile picture

Stay in touch and get notified when new unrolls are available from this author!

Read all threads

This Thread may be Removed Anytime!

PDF

Twitter may remove this content at anytime! Save it as PDF for later use!

Try unrolling a thread yourself!

how to unroll video
  1. Follow @ThreadReaderApp to mention us!

  2. From a Twitter thread mention us with a keyword "unroll"
@threadreaderapp unroll

Practice here first or read more on our help page!

More from @SpectreTrading

Nov 22, 2023
Smart Money Technique

The guide to using it

A thread 🧵 Image
SMT is when there is a crack in correlation between 2 or more assets.

When NQ creates a higher high, you would expect ES to follow through. You get your SMT divergence when it fails to do so and instead creates a lower high. Here you could anticipate bearish price action. Image
This is a diagram for inversely correlated assets.

When EU creates a lower high, you would expect DXY to follow through and create higher low. You get your SMT divergence when DXY creates a lower low instead. Here you could anticipate bullish price action (DXY). Image
Read 5 tweets
Nov 9, 2023
Market Maker Models

The guide to trading them

A thread 🧵 Image
This is a Market Maker Sell Model.

Price begins with consolidation, expanding into a HTF PD array acting as resistance before creating the Smart money reversal (grey box) followed by distribution phases to take out original consolidation. Image
This is a Market Maker Buy Model.

Price begins with consolidation, expanding into a HTF PD array acting as support before creating the Smart money reversal (grey box) followed by distribution phases to take out original consolidation. Image
Read 6 tweets

Did Thread Reader help you today?

Support us! We are indie developers!


This site is made by just two indie developers on a laptop doing marketing, support and development! Read more about the story.

Become a Premium Member ($3/month or $30/year) and get exclusive features!

Become Premium

Don't want to be a Premium member but still want to support us?

Make a small donation by buying us coffee ($5) or help with server cost ($10)

Donate via Paypal

Or Donate anonymously using crypto!

Ethereum

0xfe58350B80634f60Fa6Dc149a72b4DFbc17D341E copy

Bitcoin

3ATGMxNzCUFzxpMCHL5sWSt4DVtS8UqXpi copy

Thank you for your support!

Follow Us!

:(