🩸Blood lactate [BLa] does NOT increase exponentially during high intensity exercise 🧑🔬
Why do we make this common mistake?
I think because we have focused too much on the lactate test
And forgotten what information that test is trying to give us about real exercise
🧵1/14
Why do we make this common mistake?
I think because we have focused too much on the lactate test
And forgotten what information that test is trying to give us about real exercise
🧵1/14
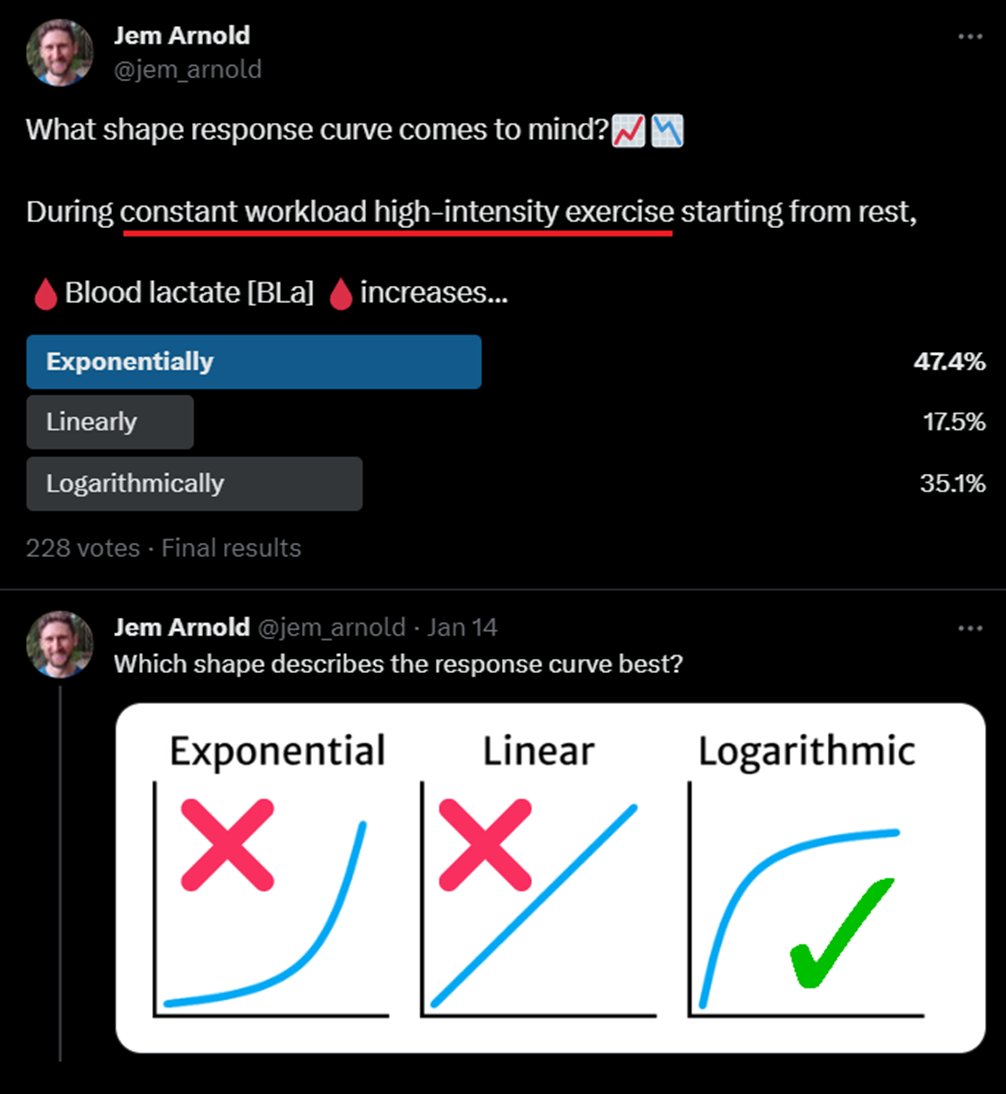
We are probably familiar with the🩸BLa curve during an incremental exercise test
As intensity increases 🩸BLa accumulates at a faster rate, approximating an exponential increase
We can estimate a 'threshold' in this curve, but what is this threshold telling us?
2/
As intensity increases 🩸BLa accumulates at a faster rate, approximating an exponential increase
We can estimate a 'threshold' in this curve, but what is this threshold telling us?
2/

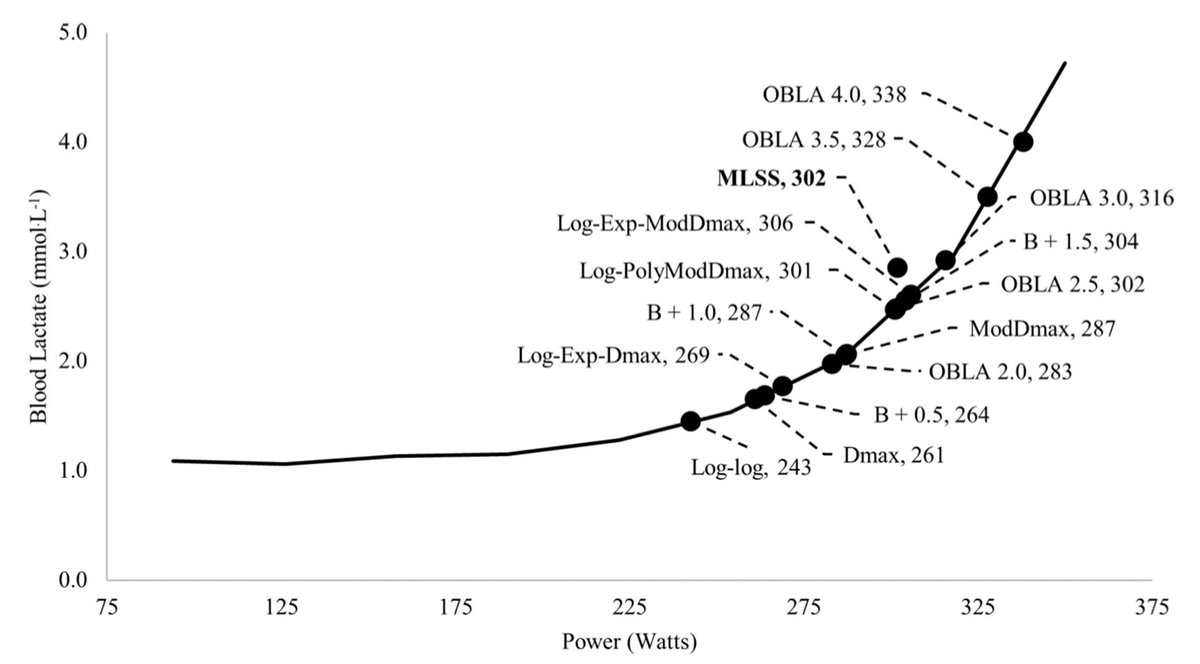
We don’t actually care about the deflection point in a lactate curve on its own
True exponential curves don't have deflections. it's like finding the corner of a circle
There are lots of corners depending on our operational definitions 🫣
3/
DOI: 10.1371/journal.pone.0199794
True exponential curves don't have deflections. it's like finding the corner of a circle
There are lots of corners depending on our operational definitions 🫣
3/
DOI: 10.1371/journal.pone.0199794
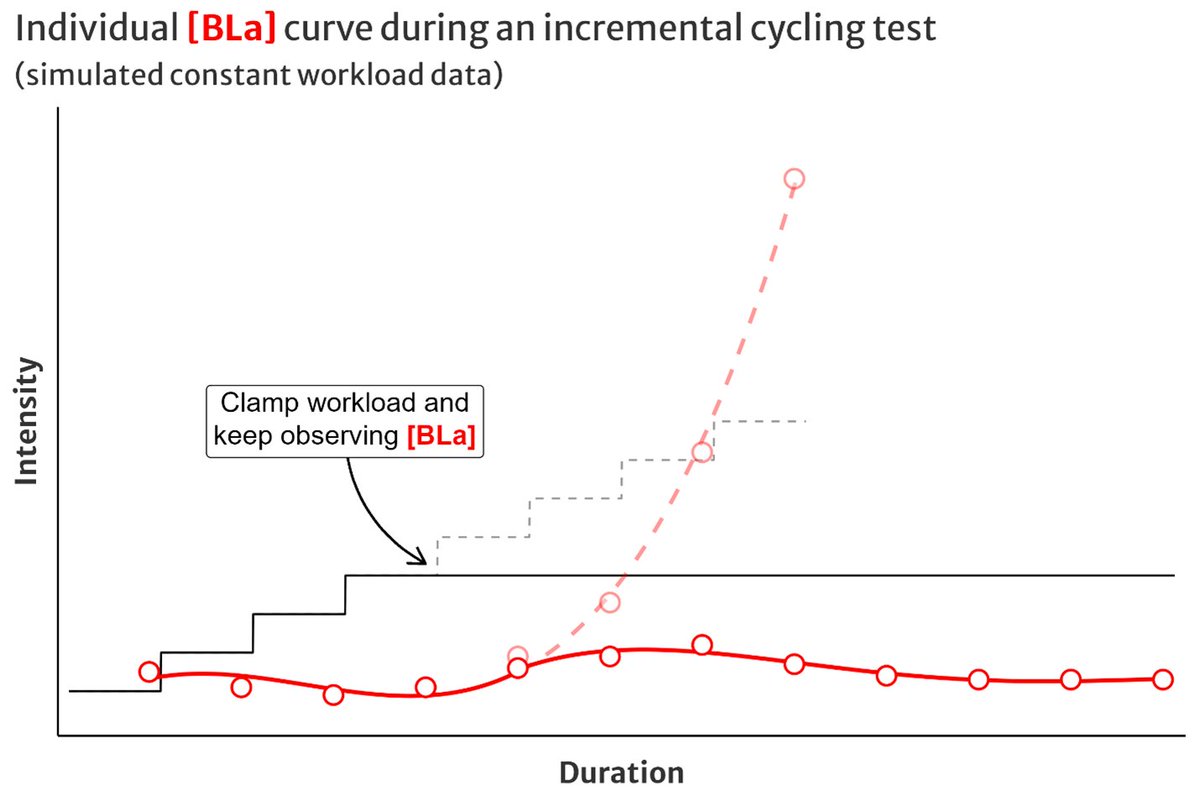
We care about what our lactate curve predicts about our *constant workload* performance at every intensity
What happens to 🩸BLa if we clamped workload during a lactate test and continued exercising at that constant workload?
At lower intensities, something like this 👇
4/
What happens to 🩸BLa if we clamped workload during a lactate test and continued exercising at that constant workload?
At lower intensities, something like this 👇
4/
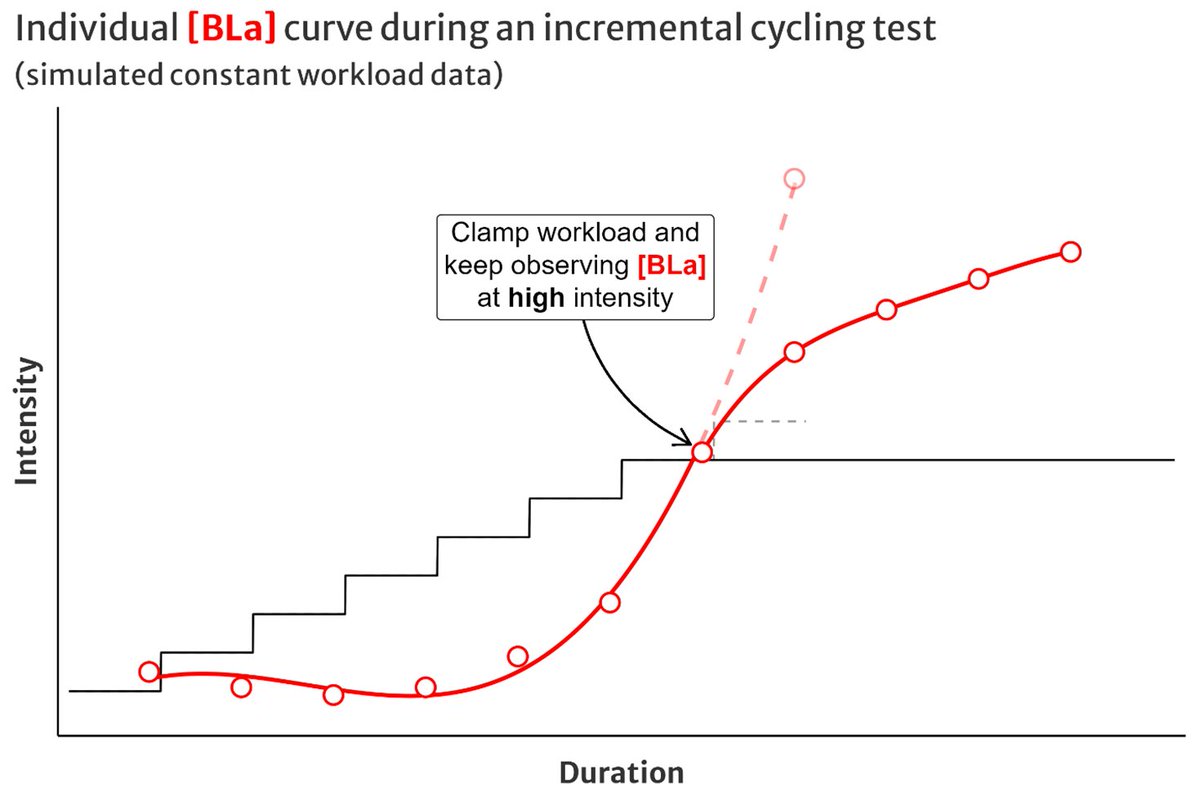
If we continued our incremental lactate test and clamped workload above the lactate threshold, would it continue to increase exponentially?
Nope! 🩸BLa accumulation *decelerates* over time, even at high intensity
Because⬆️V̇O₂ and ⬆️BLa oxidation
(science incoming 🧑🏫👇)
5/
Nope! 🩸BLa accumulation *decelerates* over time, even at high intensity
Because⬆️V̇O₂ and ⬆️BLa oxidation
(science incoming 🧑🏫👇)
5/
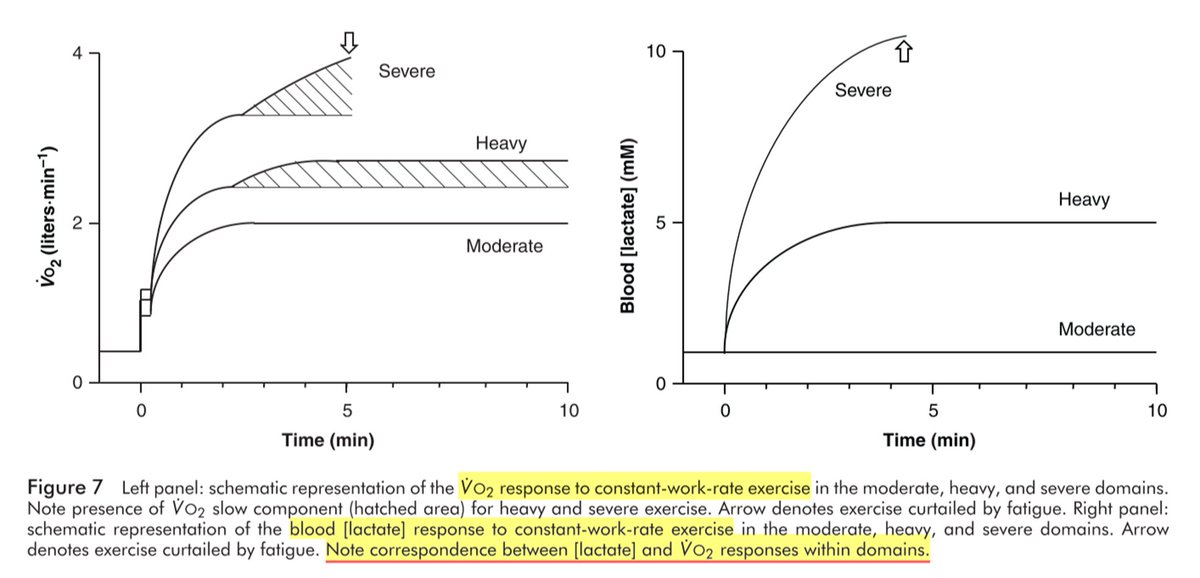
Wasserman et al (and others before them) observed this waaaay back in the mid-1900’s
MOD & HVY intensity are characterised by transiently⬆️🩸BLa, before settling back to a low baseline over 5-10 minutes
SVR intensity sees a rapid increase toward an upper ceiling
6/
MOD & HVY intensity are characterised by transiently⬆️🩸BLa, before settling back to a low baseline over 5-10 minutes
SVR intensity sees a rapid increase toward an upper ceiling
6/

Standard schematic representation of constant workload 🩸BLa response below, at, and above the maximal lactate steady state looks like this
At higher intensity 🩸BLa response is *logarithmic*, not exponential!
7/
DOI: 10.1007/s00421-017-3795-6
At higher intensity 🩸BLa response is *logarithmic*, not exponential!
7/
DOI: 10.1007/s00421-017-3795-6

What about during high intensity intervals?
A good example from Stepto et al 2001, highly trained cyclists completed a workout of 8x 5min / 1min rests, averaging 86±2% V̇O₂max
🩸BLa across work bouts followed the same logarithmic response
8/
A good example from Stepto et al 2001, highly trained cyclists completed a workout of 8x 5min / 1min rests, averaging 86±2% V̇O₂max
🩸BLa across work bouts followed the same logarithmic response
8/

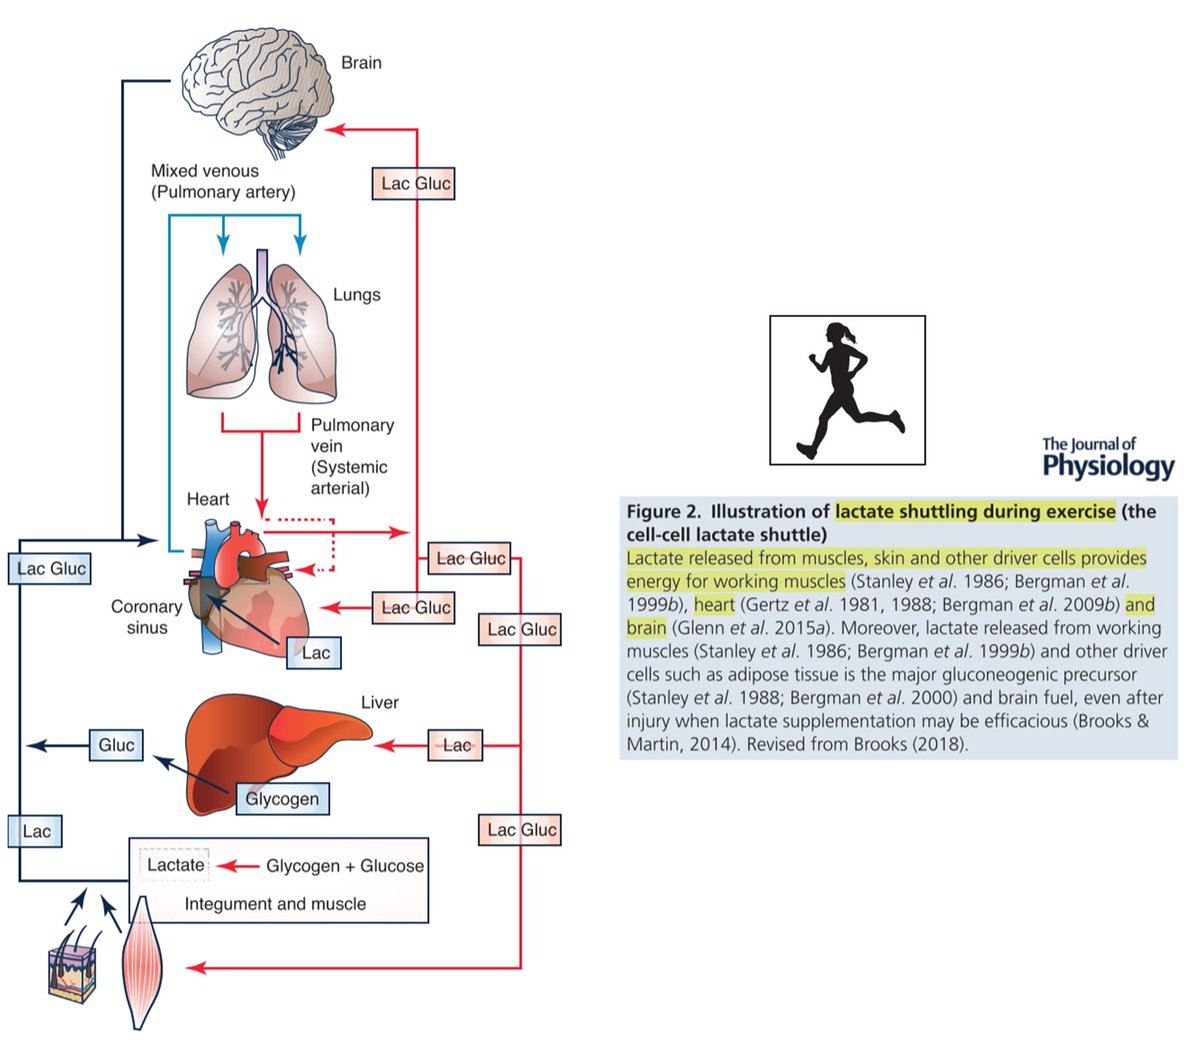
🩸BLa observed during a lactate test is the product of whole-body balance of:
La⁻ production & release from working muscles into blood
La⁻ oxidation/disposal by other tissues: muscle, heart, etc
9/
DOI: 10.1113/jp280955
La⁻ production & release from working muscles into blood
La⁻ oxidation/disposal by other tissues: muscle, heart, etc
9/
DOI: 10.1113/jp280955
La⁻ production & release is greatest at the start of exercise
V̇O₂ (OXPHOS) is still ramping up, and substrate (“anaerobic”) glycolysis must buffer the immediate energetic demand
10/
DOI: 10.1113/jp279963
V̇O₂ (OXPHOS) is still ramping up, and substrate (“anaerobic”) glycolysis must buffer the immediate energetic demand
10/
DOI: 10.1113/jp279963

As OXPHOS spins up during the first ~2min V̇O₂ onset kinetics, this also reflects ⬆️rate of La⁻ oxidation at a cellular level before it ever reaches the blood, and at the whole-body scale
Net 🩸BLa begins to slow and reverse at lower intensity
11/
DOI: 10.1002/cphy.c100072
Net 🩸BLa begins to slow and reverse at lower intensity
11/
DOI: 10.1002/cphy.c100072
So why do we care about lactate testing? Two reasons:
☝️to monitor change over time
The major thing that matters for monitoring is consistency of the test
LTs are reliable within around 5-10% (10-15 W)
12/
DOI: 10.1371/journal.pone.0199794
☝️to monitor change over time
The major thing that matters for monitoring is consistency of the test
LTs are reliable within around 5-10% (10-15 W)
12/
DOI: 10.1371/journal.pone.0199794
https://twitter.com/SeanSeale/status/1660551316509192192/
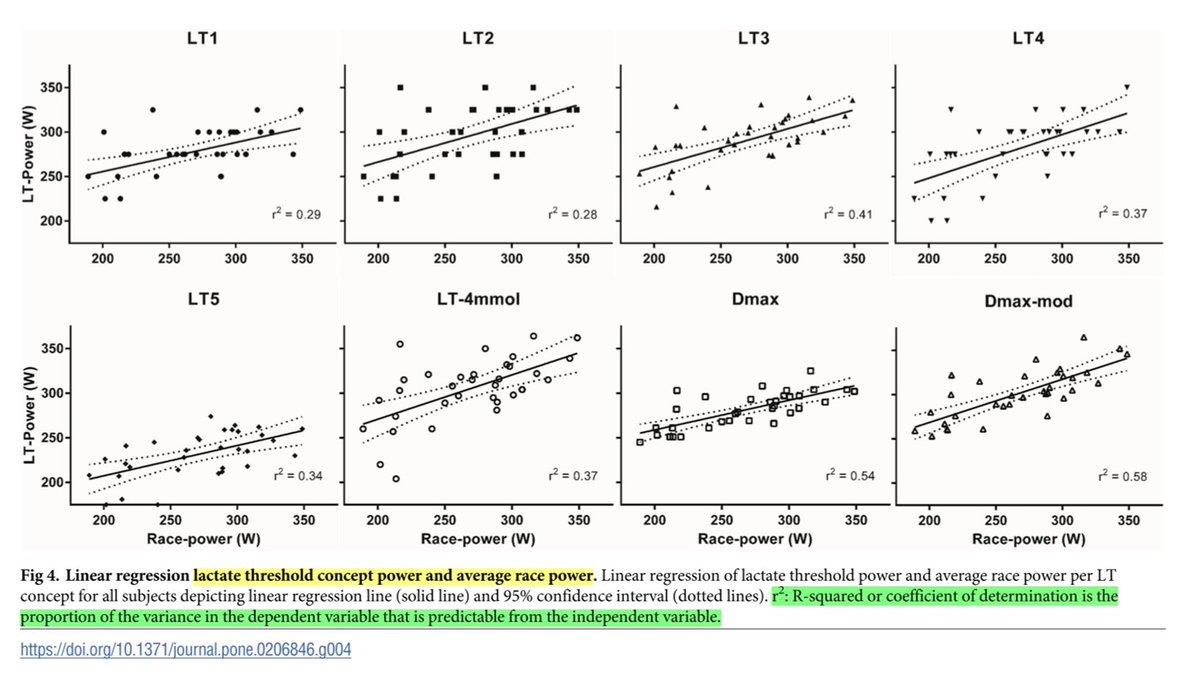
✌️to predict real world performance
LTs can be useful to extrapolate / predict transitions between intensity domains, or race performances
This 2018 study found that differences in LTs could explain 30-60% of the variance in TT performance
13/
DOI: 10.1371/journal.pone.0206846
LTs can be useful to extrapolate / predict transitions between intensity domains, or race performances
This 2018 study found that differences in LTs could explain 30-60% of the variance in TT performance
13/
DOI: 10.1371/journal.pone.0206846
We need to keep in mind what information the test is trying to give us
Try to picture *logarithmic* 🩸BLa responses during your exercise sessions, instead of exponential
This might improve how we apply information from our tests to our training!
14/14
Try to picture *logarithmic* 🩸BLa responses during your exercise sessions, instead of exponential
This might improve how we apply information from our tests to our training!
14/14
Turns out hearing that "BLa increases exponentially at high intensity" is a bit of a pet peeve of mine 😅
Hopefully this thread can help how we think about this
If you chose 'exponential' were you thinking about a lactate test? Or were you thinking about it some other way?
Hopefully this thread can help how we think about this
If you chose 'exponential' were you thinking about a lactate test? Or were you thinking about it some other way?
couldn't fit the DOI to Wasserman et al, 1967:
10.1152/jappl.1967.22.1.71
Fitting in the 'late 1900s' meme was more important 😂
10.1152/jappl.1967.22.1.71
Fitting in the 'late 1900s' meme was more important 😂
https://twitter.com/Historiographos/status/1729493204666577359
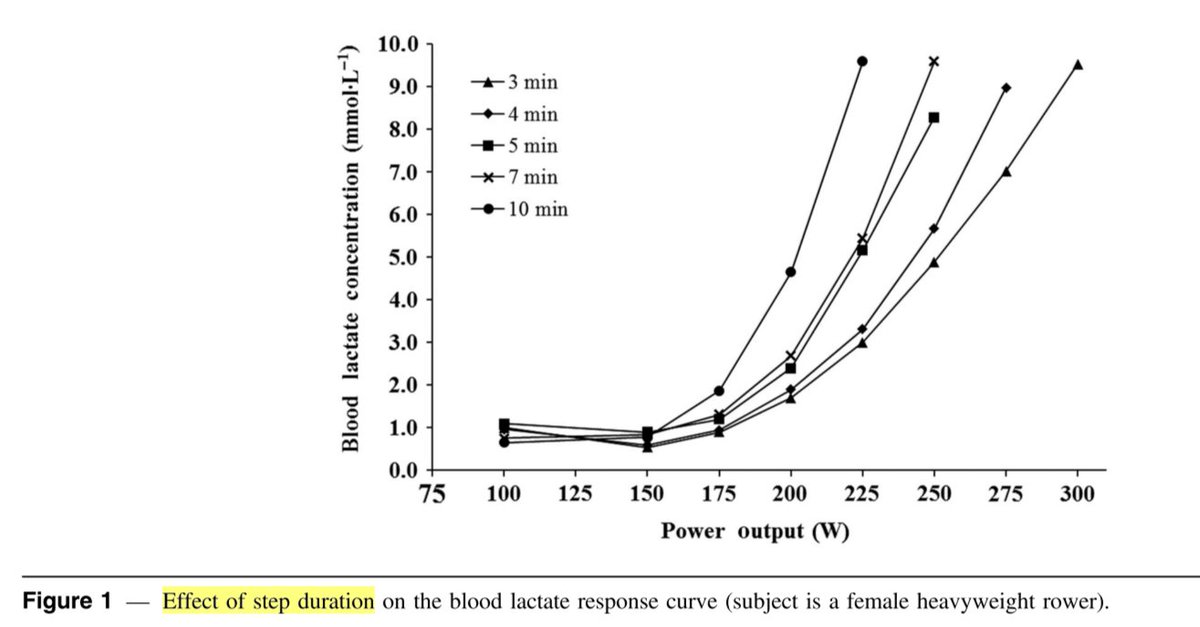
I should have added: this is why stage duration matters in a lactate test protocol: the kinetics of La⁻ production & disposal change during the first 5-10 min of exercise
When we take the observation at each stage will change the shape of the curve
DOI: 10.1123/ijspp.2017-0258
When we take the observation at each stage will change the shape of the curve
DOI: 10.1123/ijspp.2017-0258
• • •
Missing some Tweet in this thread? You can try to
force a refresh

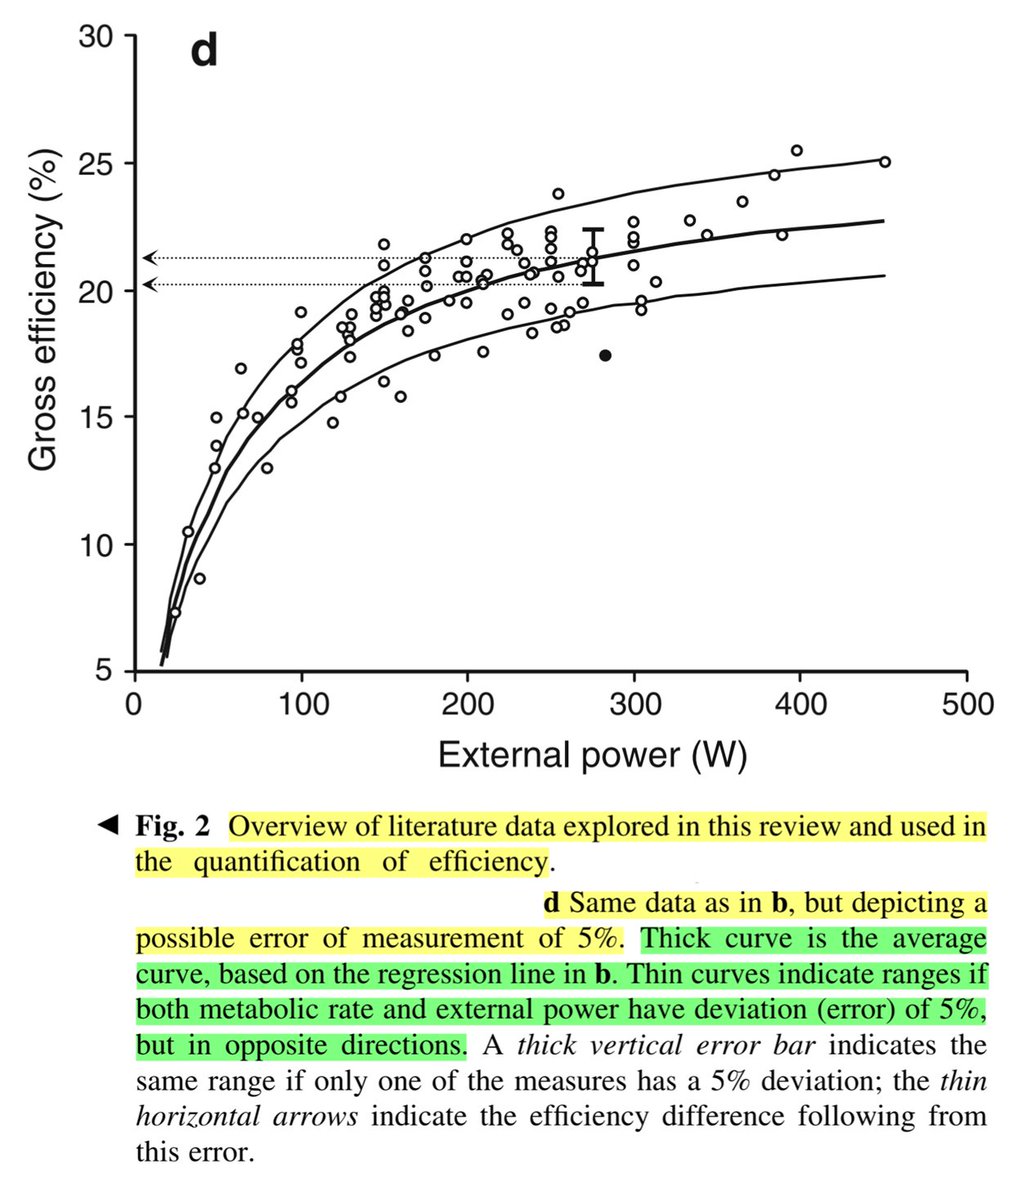
![Figure plotting individually observed gross efficiency (GE) values for cyclists across power output from 50 to 450 W, taken from published cross-sectional data in Ettema & Lorås, 2009. Efficiency in Cycling. A Review. https://www.researchgate.net/publication/24027428_Efficiency_in_cycling_A_review. A logarithmic model predicts GE as a function of PO, with 90% prediction intervals equivalent to ± 2.5% around the marginal estimate. e.g. at 250 W estimated GE = 21%, 90% PI = [18.5, 23.5].](https://pbs.twimg.com/media/G-LJl5ka0AIuANR.jpg)