Looking for a movie to watch this weekend?
I watched around 250 films from the “classic Hollywood era” of the 1930s-50s, while I was at university.
Screwball comedies, film noir, lots of great films still fun to watch today. Here are my favourites with one-line synopses. 🧵
I watched around 250 films from the “classic Hollywood era” of the 1930s-50s, while I was at university.
Screwball comedies, film noir, lots of great films still fun to watch today. Here are my favourites with one-line synopses. 🧵
First, the comedies:
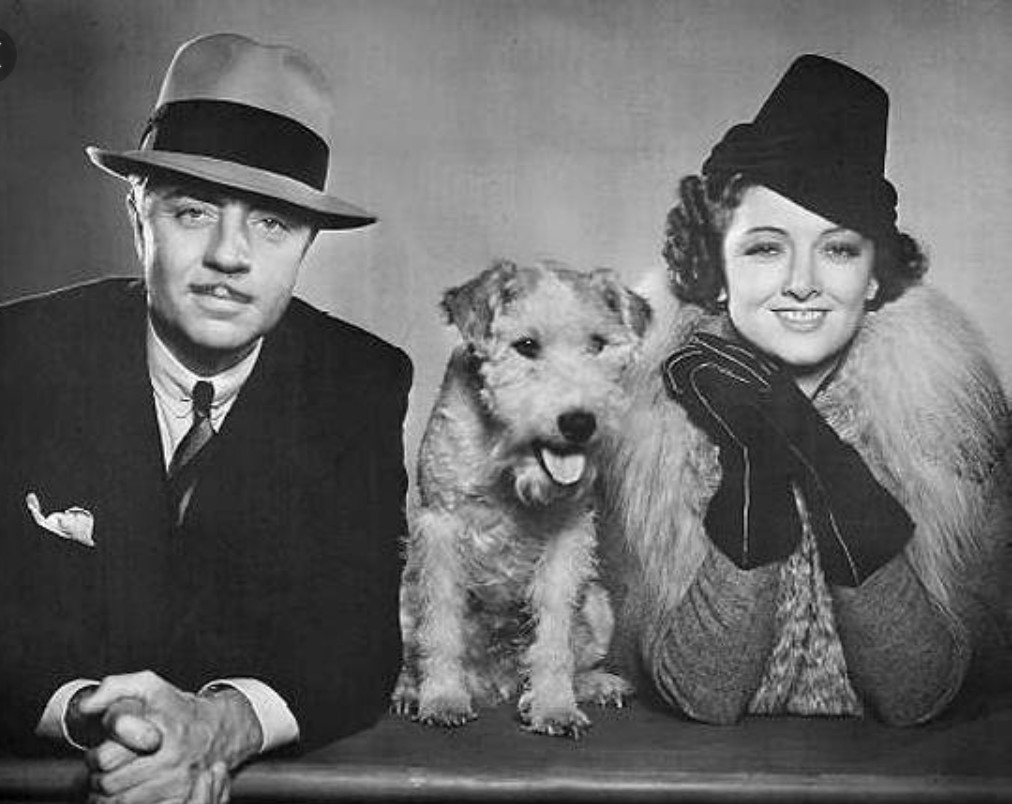
The Thin Man (1934):
A witty couple solves mysteries with their dog.
(This is the first of six films in The Thin Man series, which are all great)
A witty couple solves mysteries with their dog.
(This is the first of six films in The Thin Man series, which are all great)
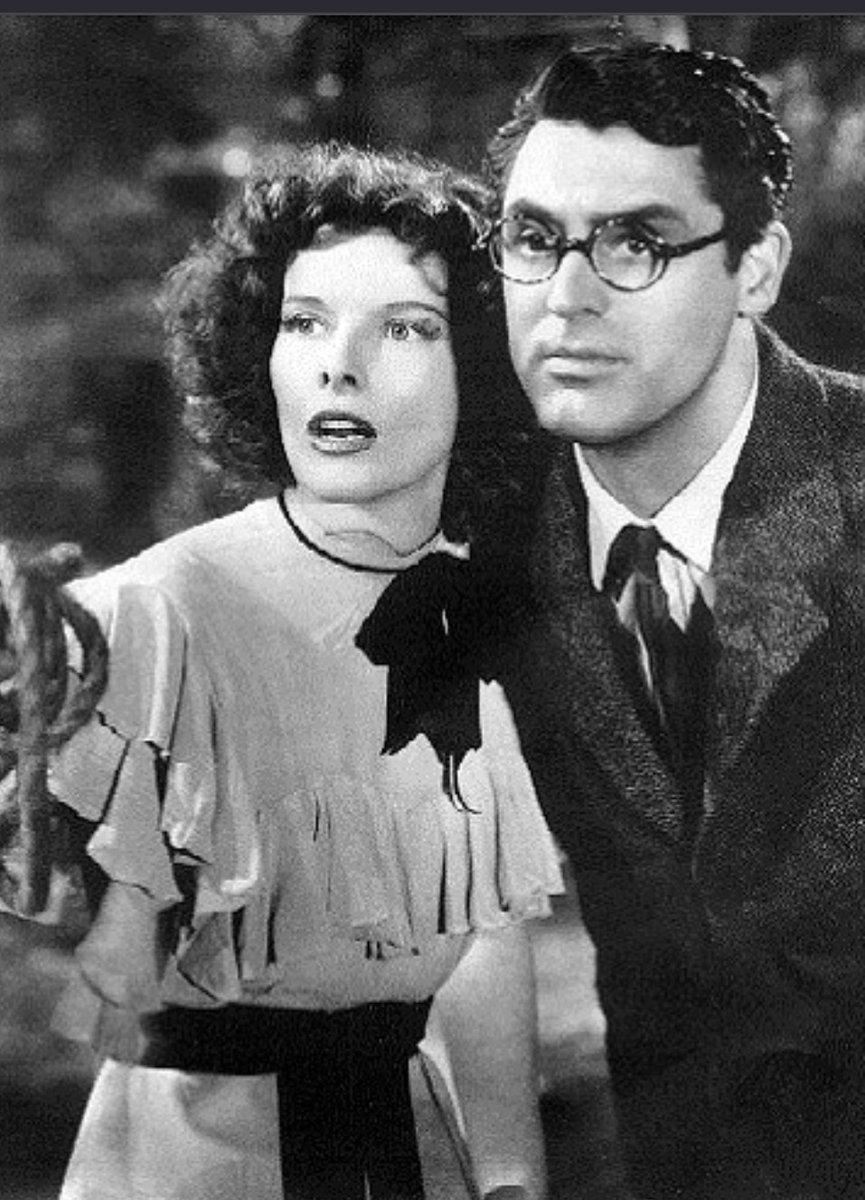
Bringing Up Baby (1938):
A paleontologist's life is turned upside down by a woman and a leopard.
A paleontologist's life is turned upside down by a woman and a leopard.
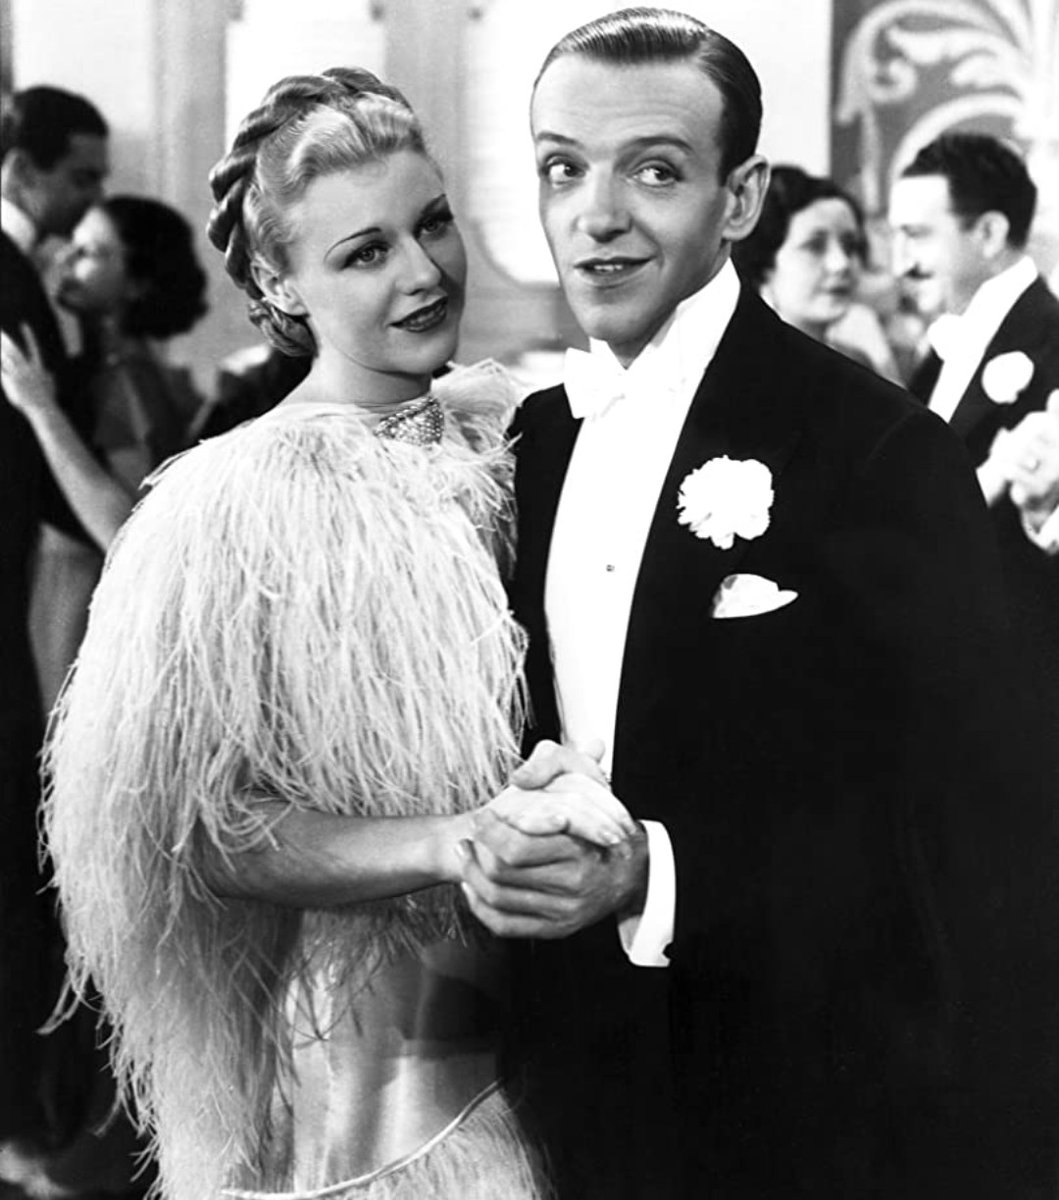
Top Hat (1935):
A dancer falls for a woman who mistakes him for her friend's husband.
A dancer falls for a woman who mistakes him for her friend's husband.
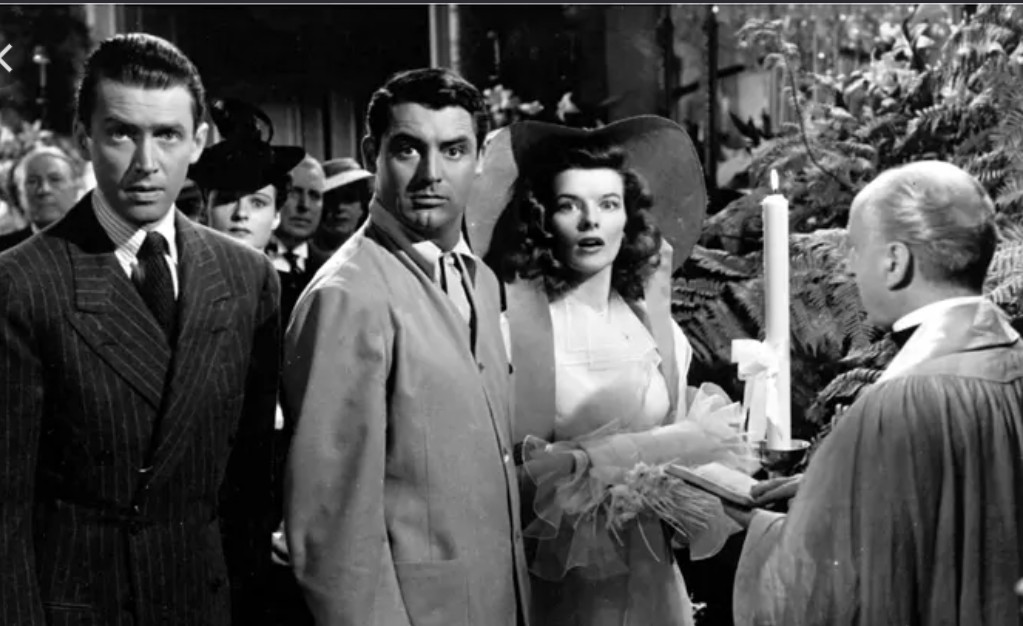
The Philadelphia Story (1940):
A socialite's ex-husband and a reporter complicate her wedding plans.
(won an Oscar)
A socialite's ex-husband and a reporter complicate her wedding plans.
(won an Oscar)
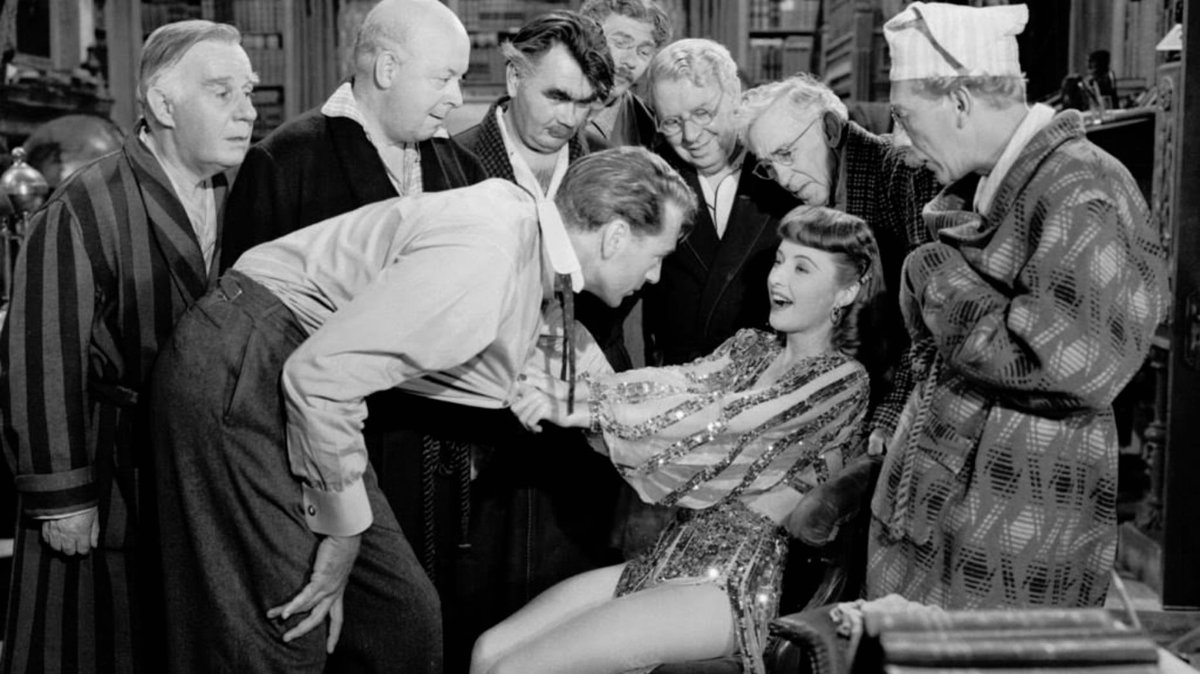
Ball Of Fire (1941):
A group of professors enlist a nightclub singer to help with their research.
A group of professors enlist a nightclub singer to help with their research.
Roman Holiday (1953):
A princess escapes her duties and falls for an American reporter in Rome.
(won an Oscar)
A princess escapes her duties and falls for an American reporter in Rome.
(won an Oscar)

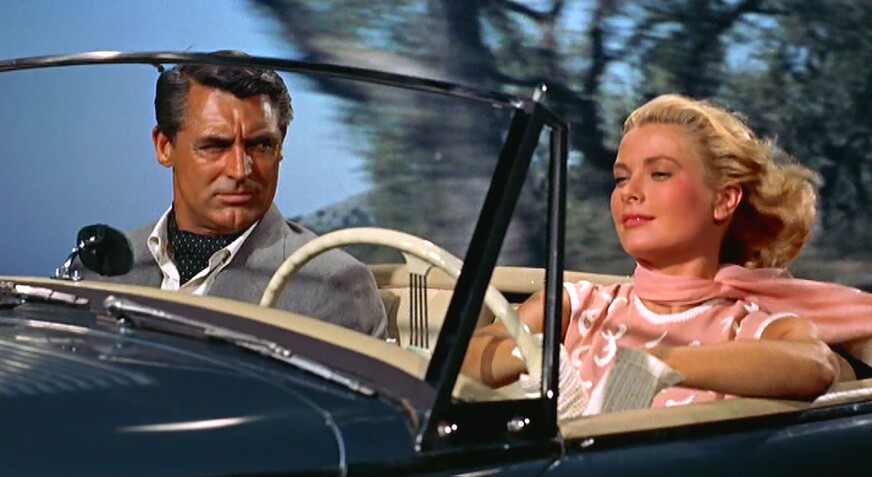
To Catch A Thief (1955):
A retired cat burglar must prove his innocence in a series of heists.
A retired cat burglar must prove his innocence in a series of heists.
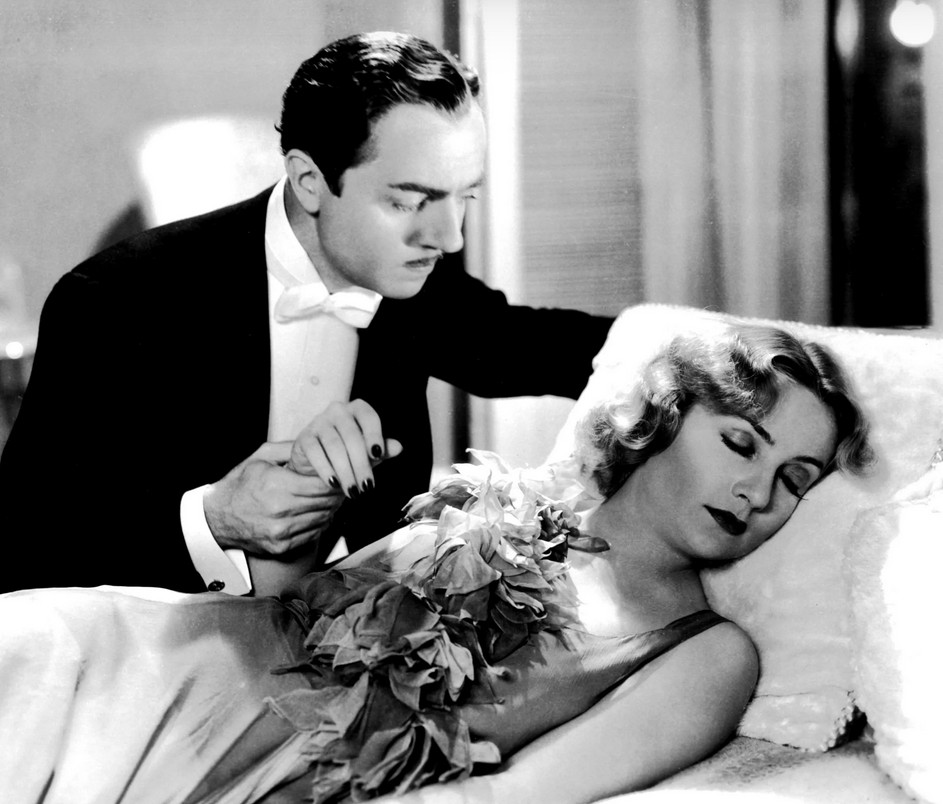
My Man Godfrey (1936):
A socialite hires a "forgotten man" to be her family's butler.
(won an Oscar)
A socialite hires a "forgotten man" to be her family's butler.
(won an Oscar)
Desk Set (1957):
A computer expert and a TV network researcher clash over automation.
A computer expert and a TV network researcher clash over automation.

Indiscreet (1958):
A love affair between a famous actress and a diplomat under false pretense.
A love affair between a famous actress and a diplomat under false pretense.
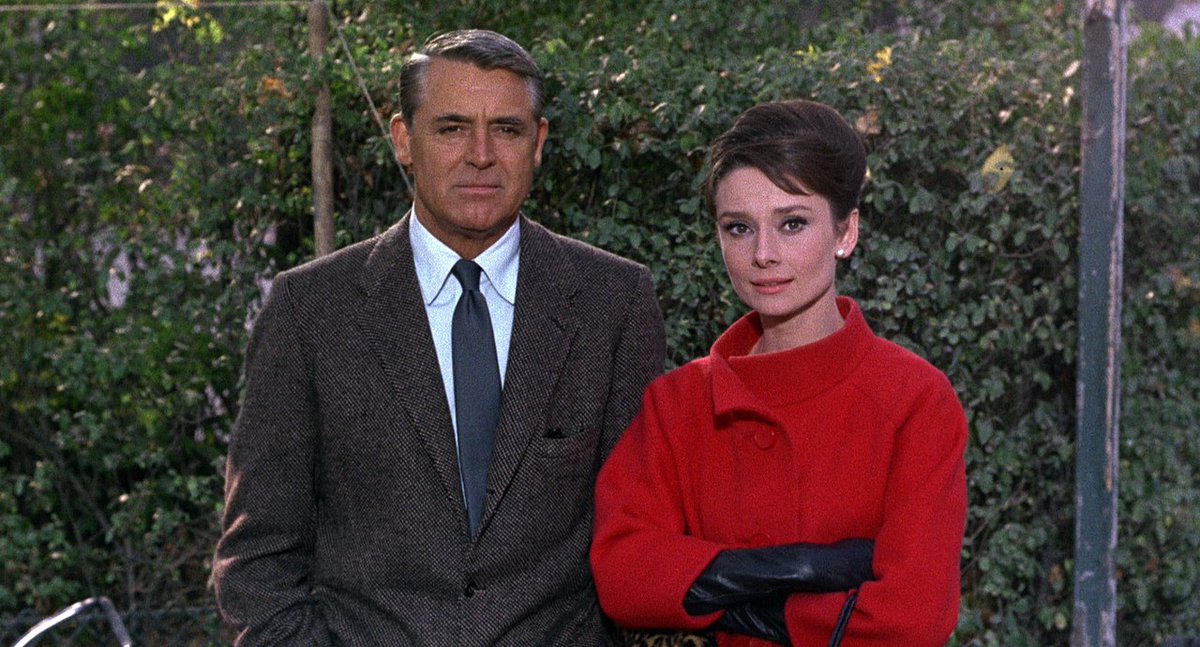
Charade (1963):
A widow is chased by men after her murdered husband's stolen fortune.
A widow is chased by men after her murdered husband's stolen fortune.
And now the dramas... 🎭
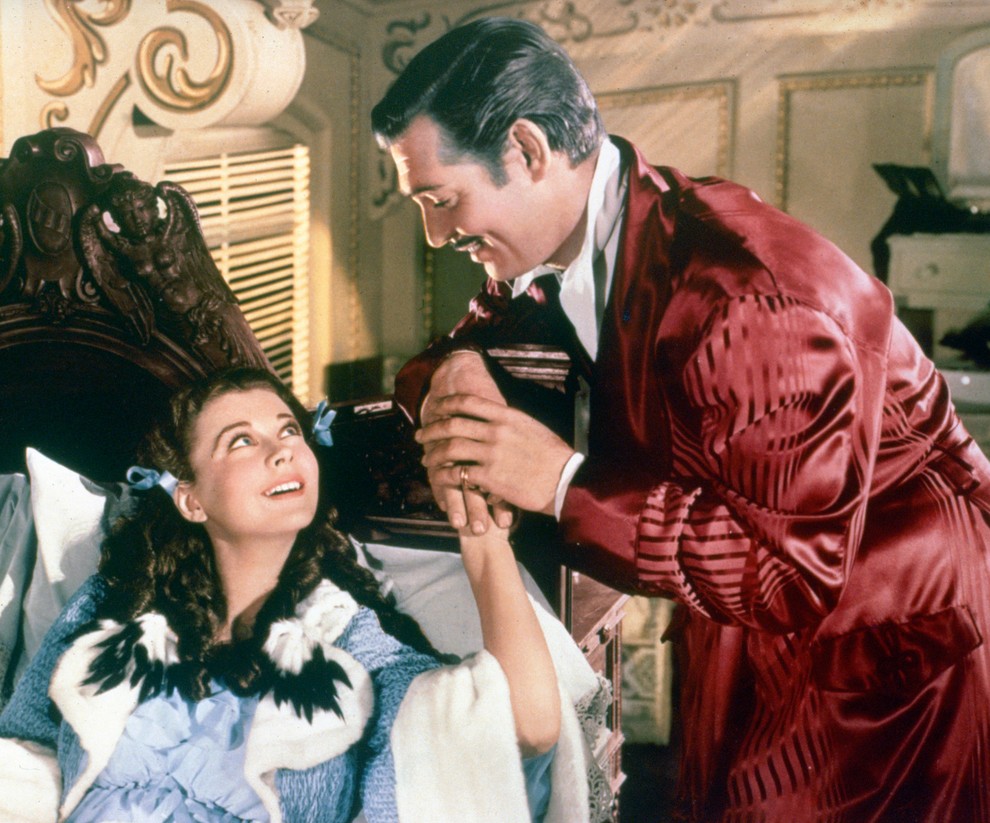
Gone With The Wind (1939):
A tumultuous love story set against the backdrop of the Civil War.
(won an Oscar)
A tumultuous love story set against the backdrop of the Civil War.
(won an Oscar)
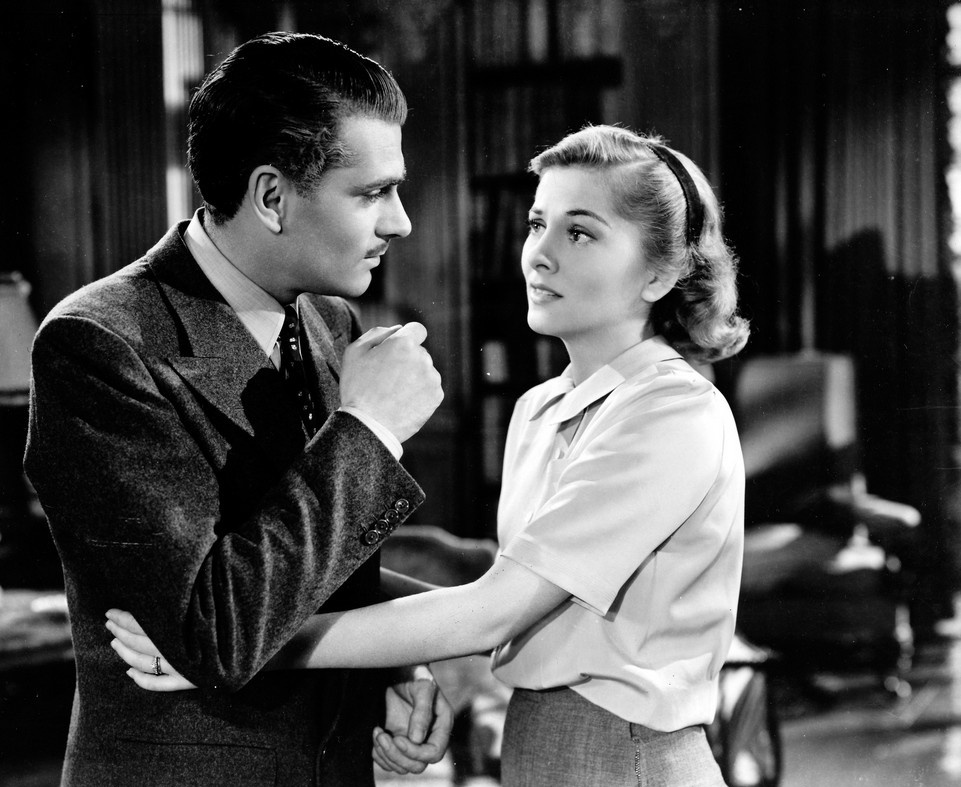
Rebecca (1940):
A young bride is haunted by her husband's glamorous first wife, Rebecca.
(won an Oscar)
A young bride is haunted by her husband's glamorous first wife, Rebecca.
(won an Oscar)
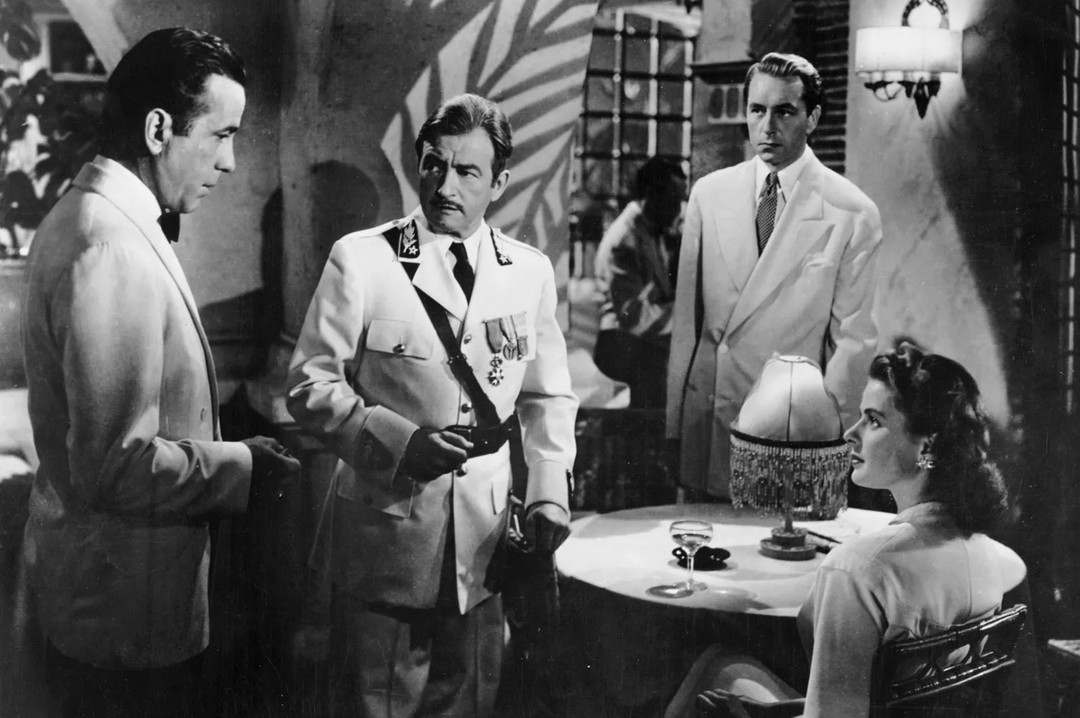
Casablanca (1942):
A nightclub owner faces past love in WWII Morocco.
(won an Oscar)
A nightclub owner faces past love in WWII Morocco.
(won an Oscar)
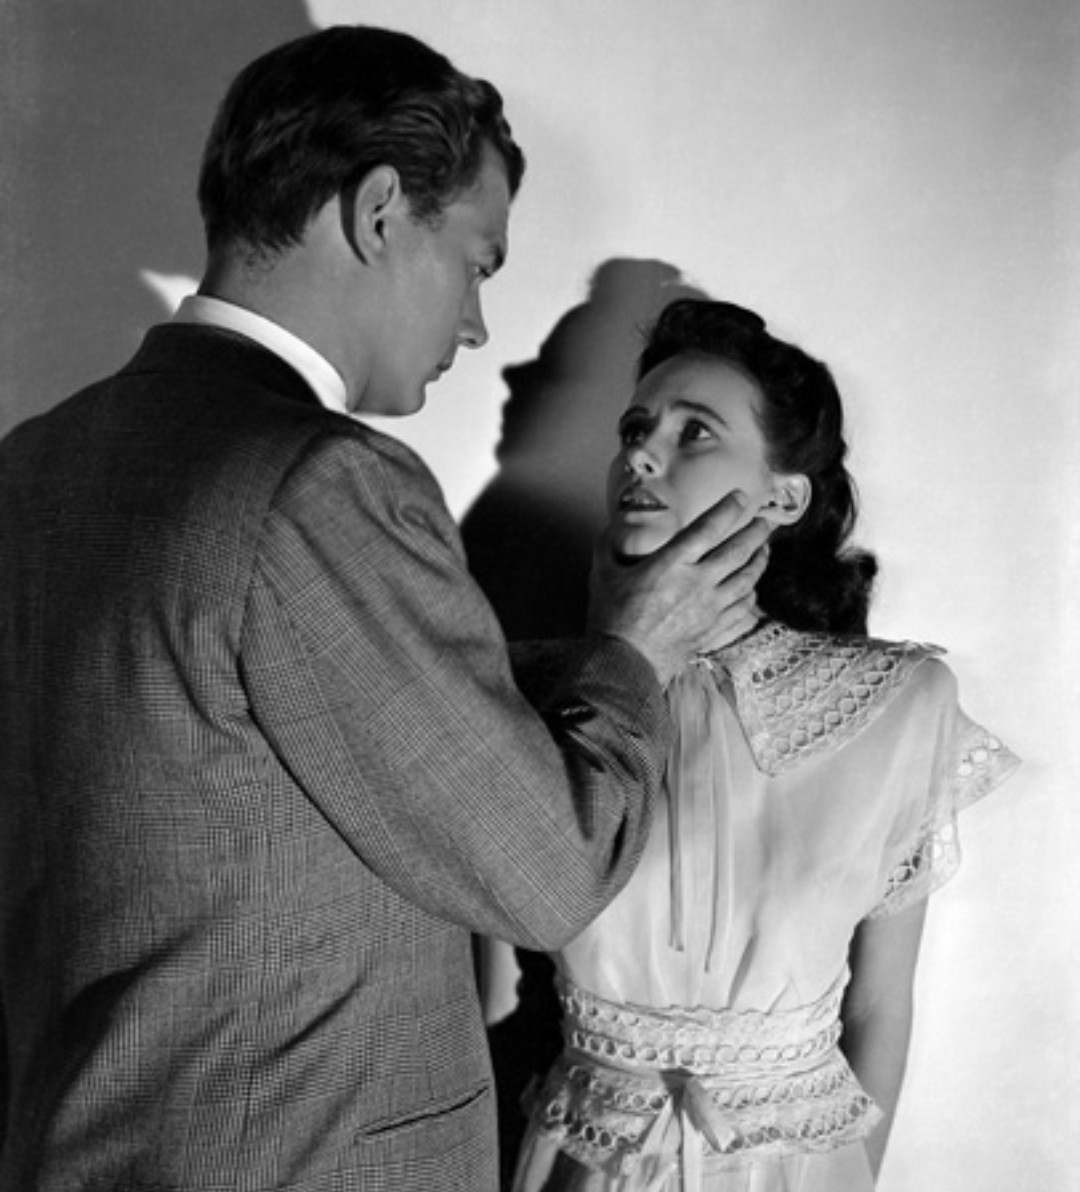
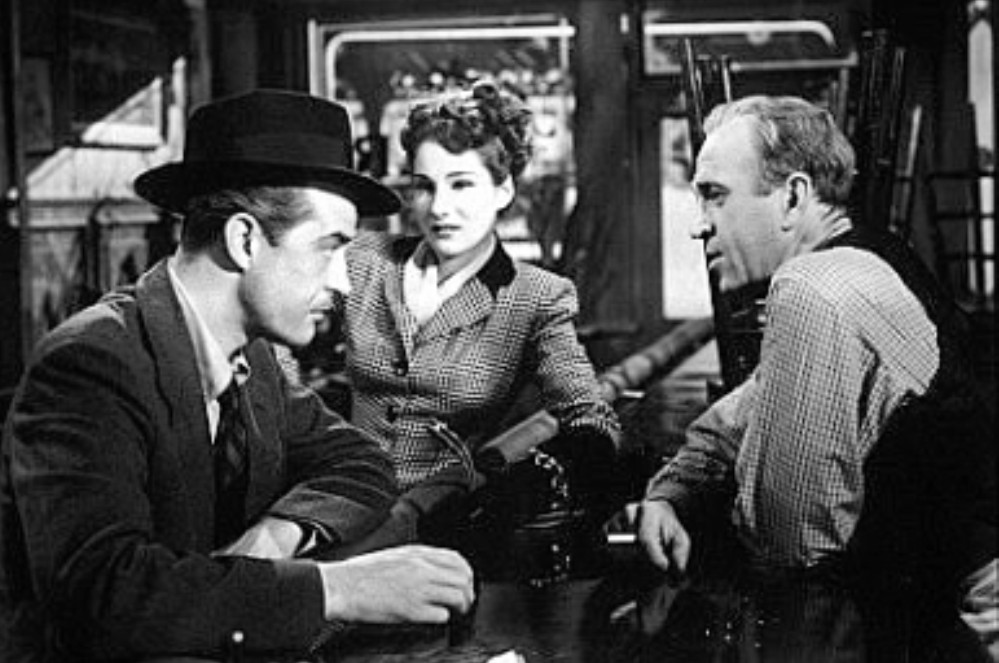
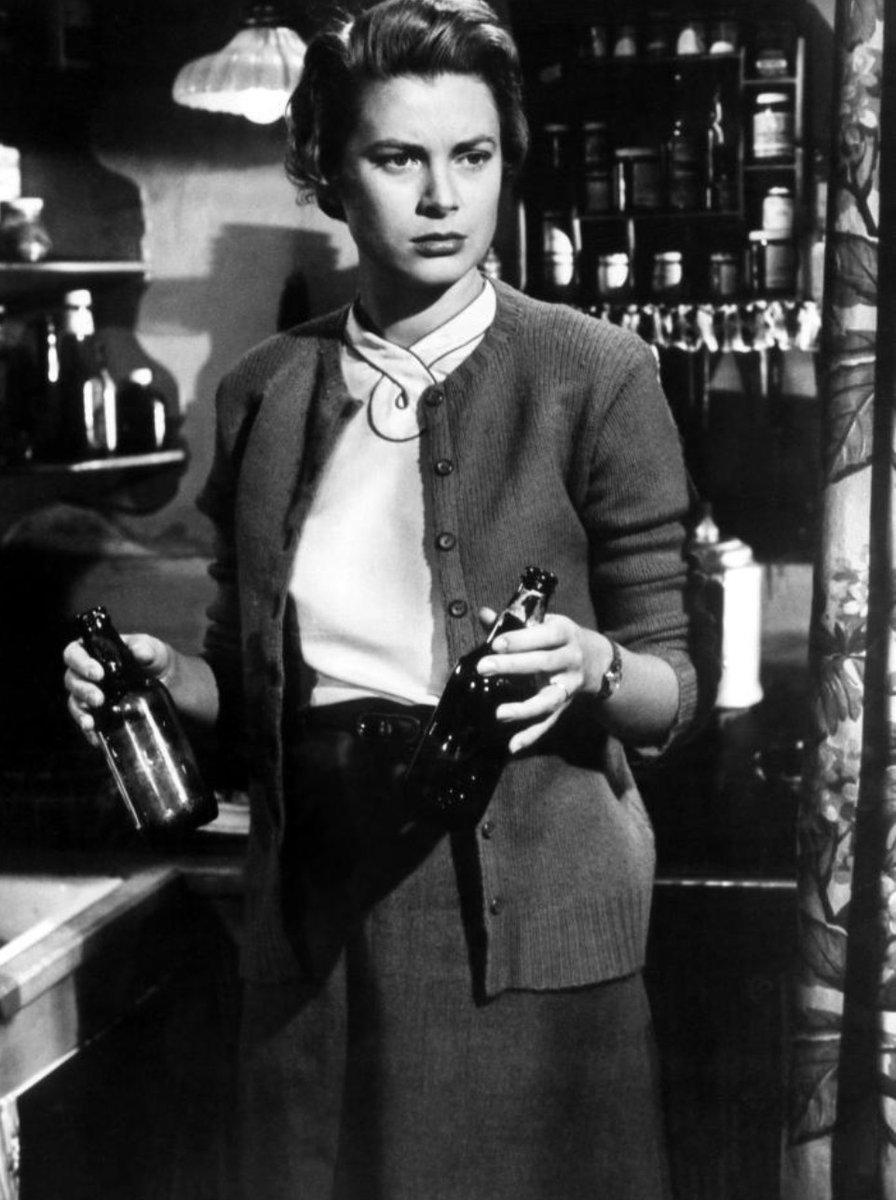
Shadow of a Doubt (1943):
A young woman suspects her uncle is a serial killer.
A young woman suspects her uncle is a serial killer.
The Lost Weekend (1945):
A four-day alcoholic bender leads to self-realisation.
(won an Oscar)
A four-day alcoholic bender leads to self-realisation.
(won an Oscar)
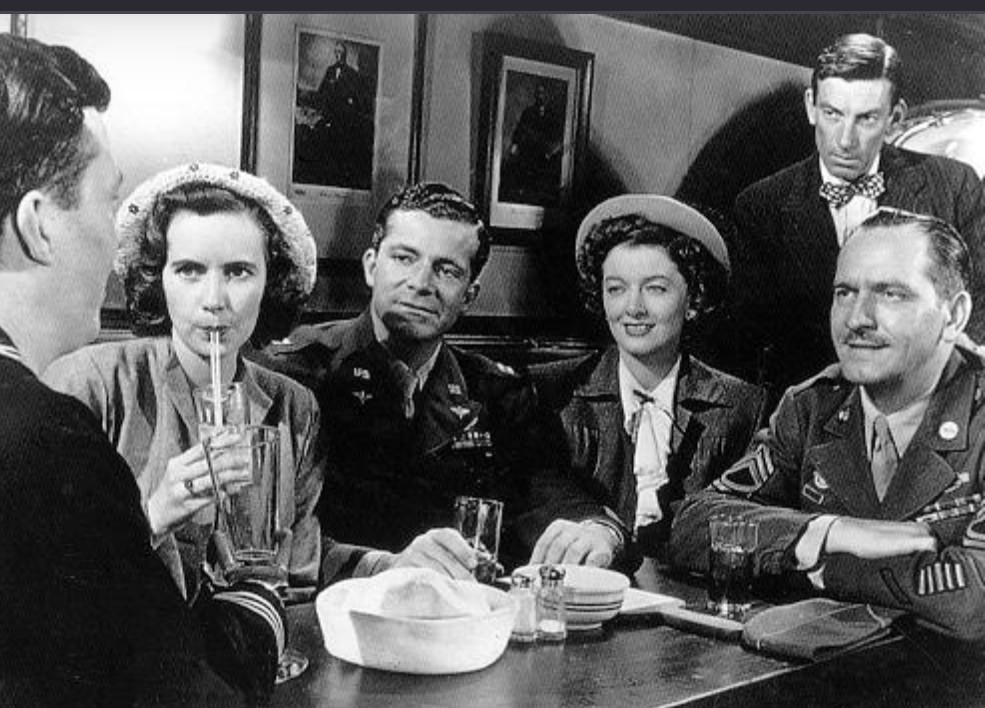
The Best Years of Our Lives (1946):
Three WWII veterans adjust to civilian life with changes and challenges.
(won an Oscar)
Three WWII veterans adjust to civilian life with changes and challenges.
(won an Oscar)
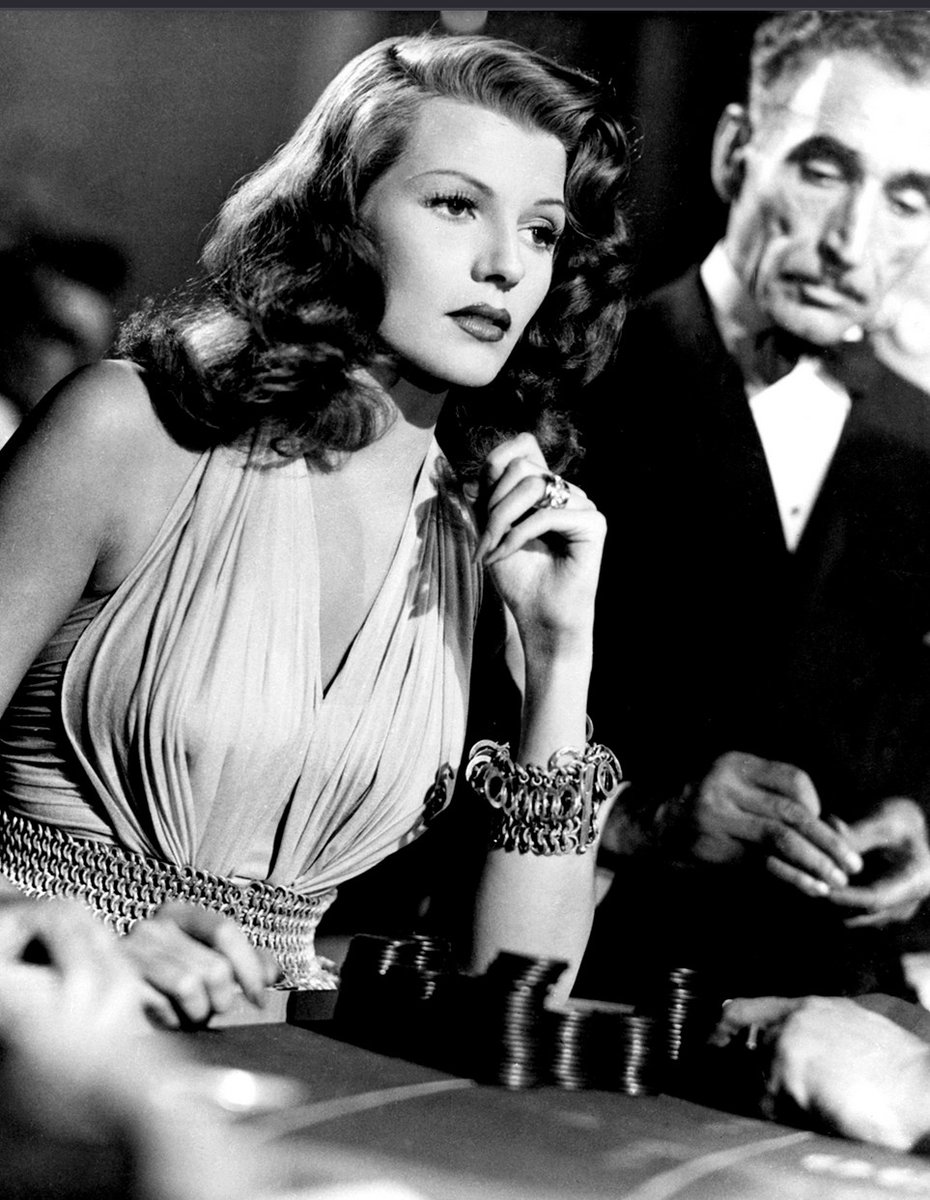
Gilda (1946):
A complex love triangle unfolds in a Buenos Aires casino.
A complex love triangle unfolds in a Buenos Aires casino.
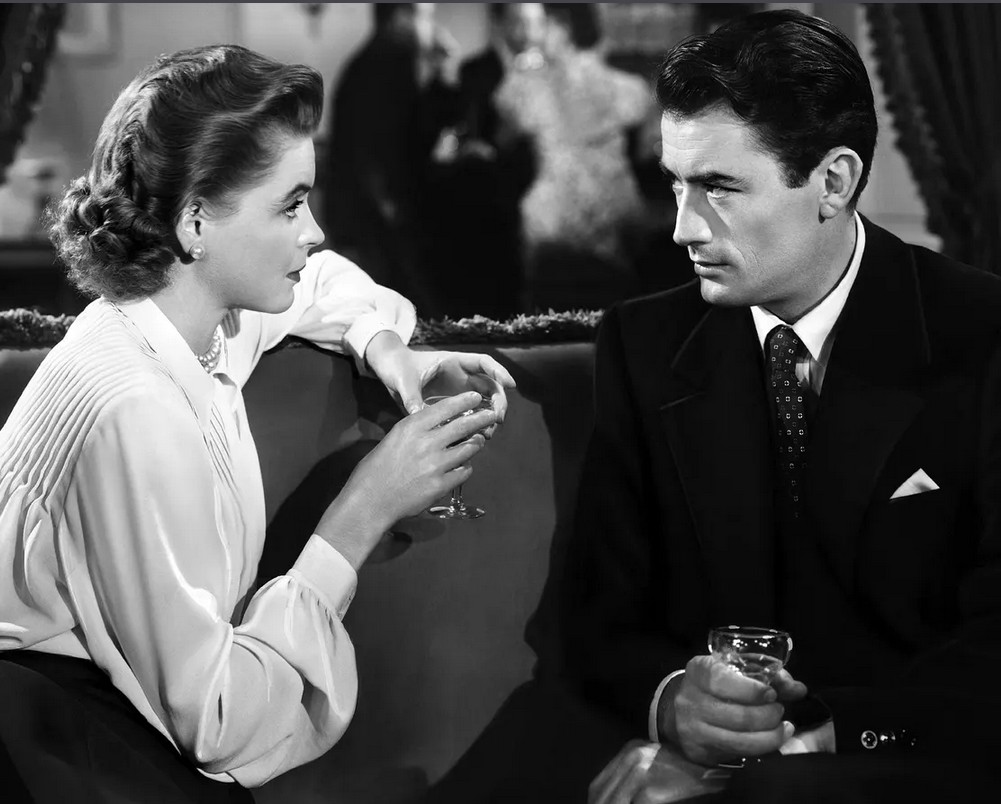
Gentleman's Agreement (1947):
A reporter pretends to be Jewish to expose antisemitism.
(won an Oscar)
A reporter pretends to be Jewish to expose antisemitism.
(won an Oscar)
High Noon (1952):
A marshal faces a gang alone as the townsfolk refuse to help.
(won an Oscar)
A marshal faces a gang alone as the townsfolk refuse to help.
(won an Oscar)

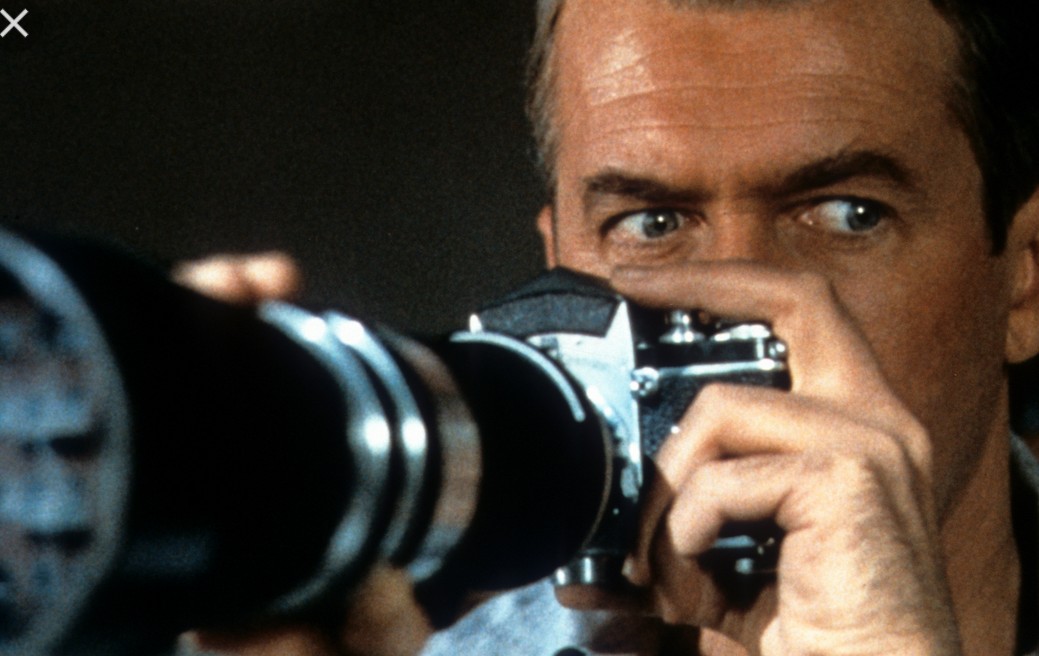
Rear Window (1954):
A wheelchair-bound photographer suspects a neighbour of murder.
A wheelchair-bound photographer suspects a neighbour of murder.
The Country Girl (1954):
A director helps a has-been actor and his wife face their demons.
(won an Oscar)
A director helps a has-been actor and his wife face their demons.
(won an Oscar)
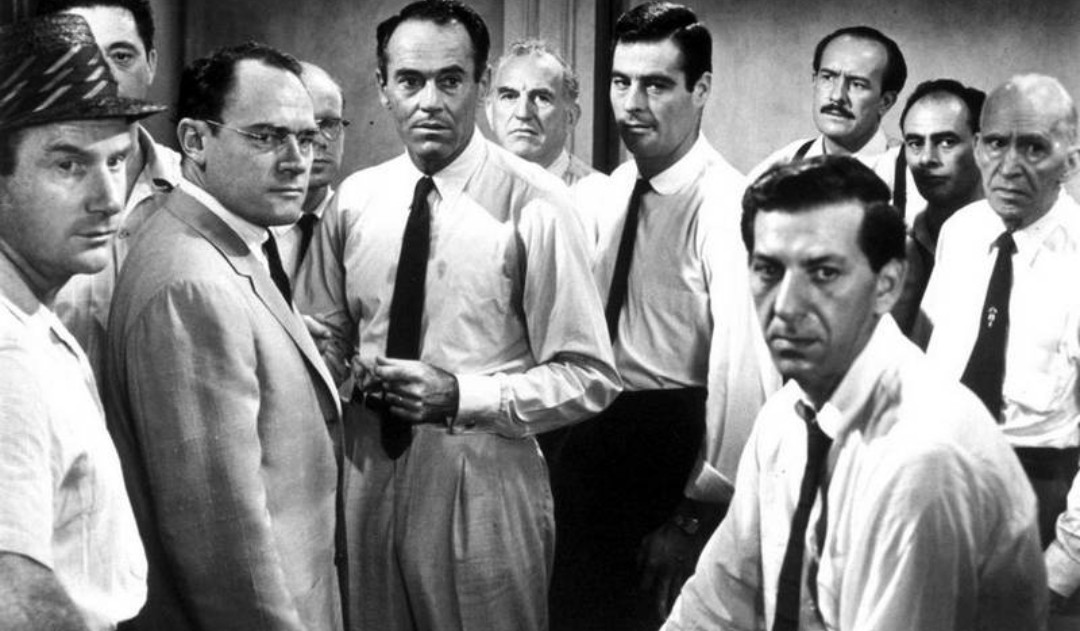
12 Angry Men (1957):
Jurors reconsider their decision in a murder trial.
Jurors reconsider their decision in a murder trial.
Witness For The Prosecution (1957):
A lawyer defends a man accused of murdering a wealthy widow.
A lawyer defends a man accused of murdering a wealthy widow.

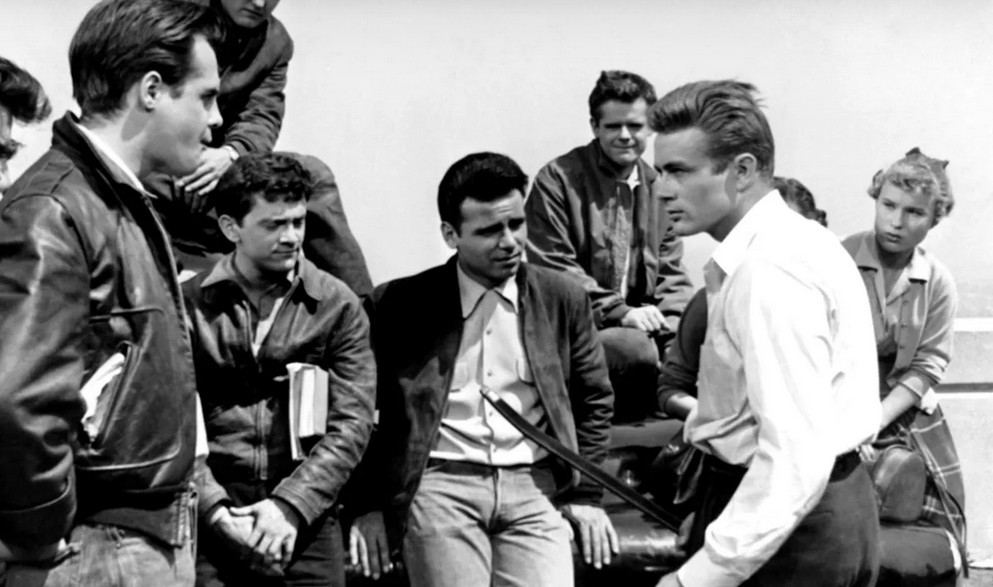
Rebel Without A Cause (1955):
A troubled teen forms deep connections while confronting the challenges of adolescence and authority.
A troubled teen forms deep connections while confronting the challenges of adolescence and authority.
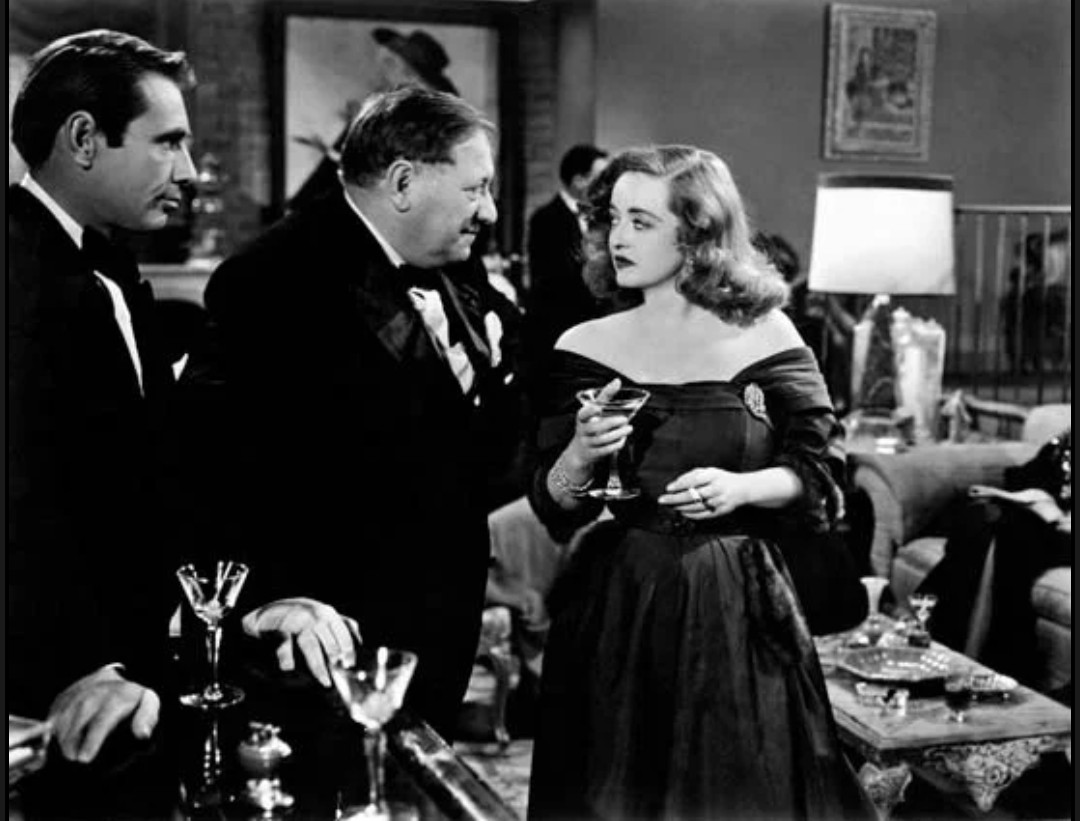
All About Eve (1950):
A ambitious young actress schemes to upstage an aging Broadway star.
(won an Oscar)
A ambitious young actress schemes to upstage an aging Broadway star.
(won an Oscar)
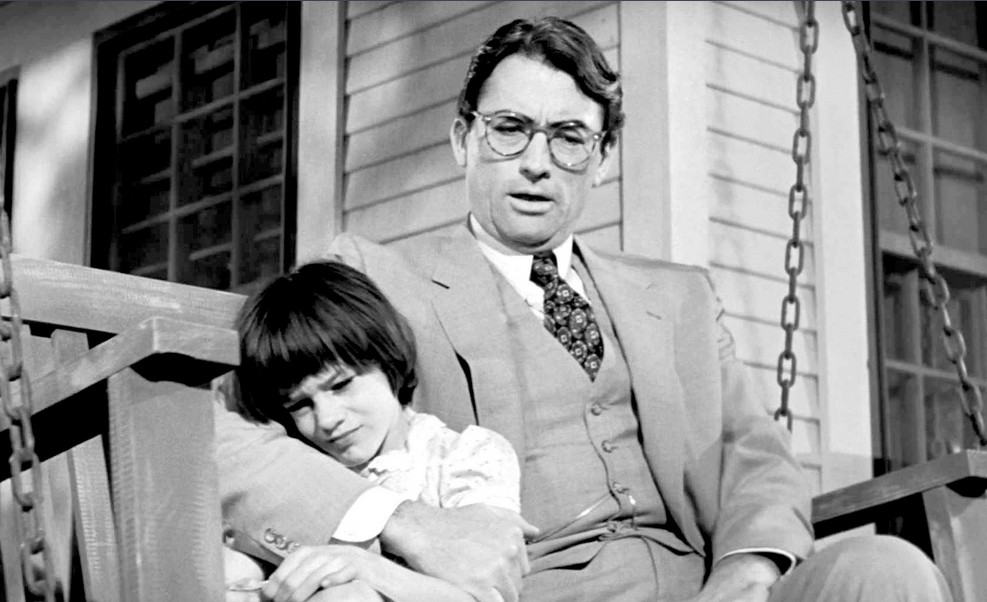
To Kill A Mockingbird (1962):
A lawyer defends an innocent black man accused of rape in the deep south.
(won an Oscar)
A lawyer defends an innocent black man accused of rape in the deep south.
(won an Oscar)
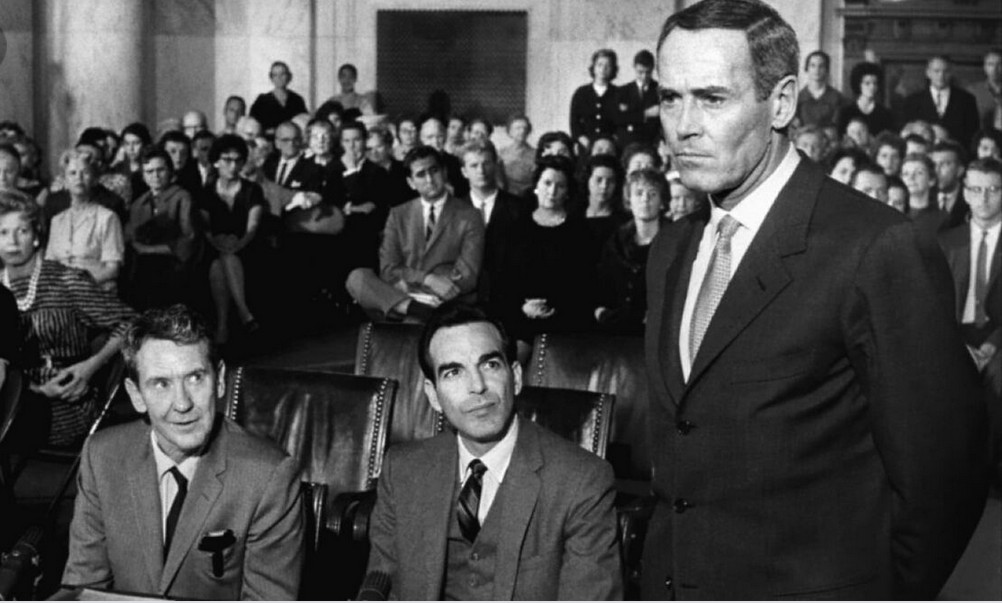
Advise and Consent (1962):
Political intrigue unfolds around a controversial Secretary of State nomination.
Political intrigue unfolds around a controversial Secretary of State nomination.
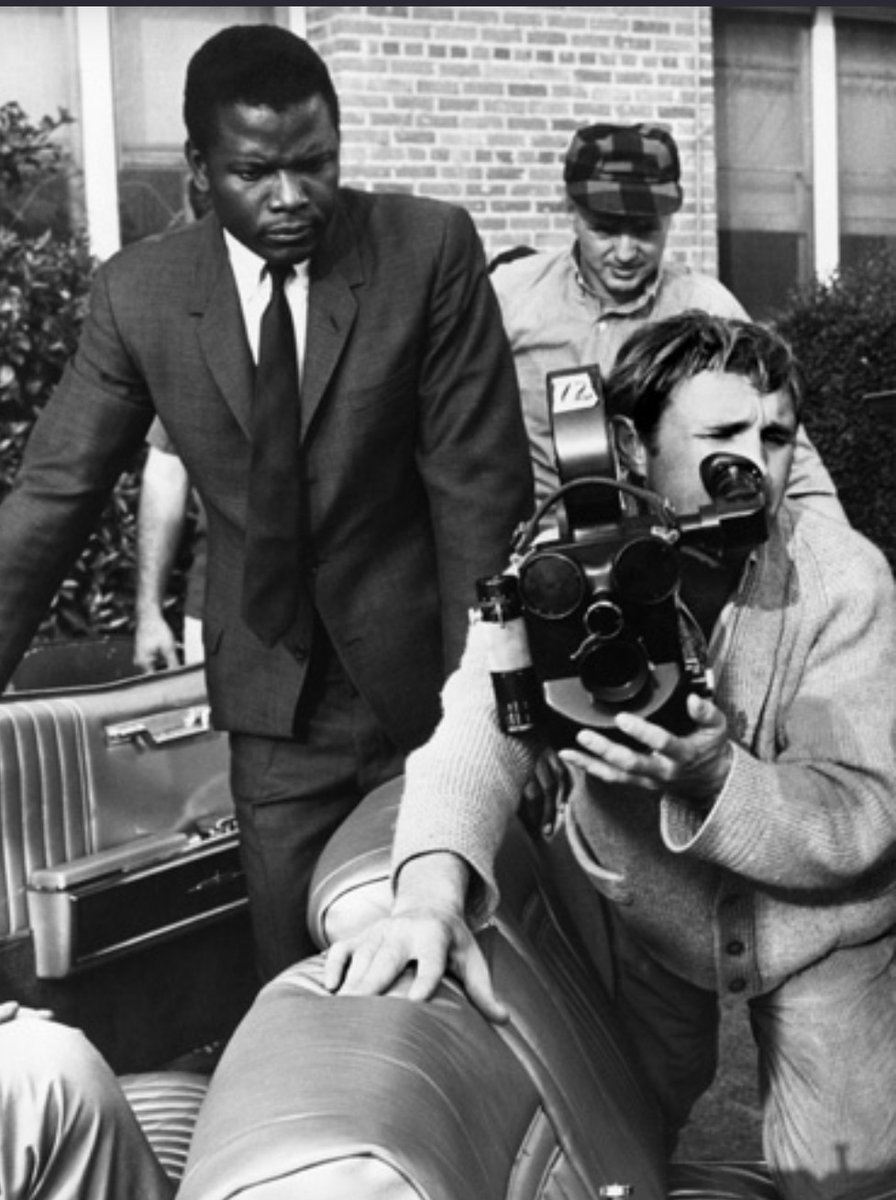
In the Heat of the Night (1967):
A black detective and a white chief of police solve a murder case in a racially tense Southern town.
(won an Oscar)
A black detective and a white chief of police solve a murder case in a racially tense Southern town.
(won an Oscar)
And that's all!
Did I miss any of your favourites?
I might not have seen them... yet 😅
I'm always looking for more to watch, so let me know below!
Did I miss any of your favourites?
I might not have seen them... yet 😅
I'm always looking for more to watch, so let me know below!
• • •
Missing some Tweet in this thread? You can try to
force a refresh