Blackburn submit 2023 accounts 🔑 figs
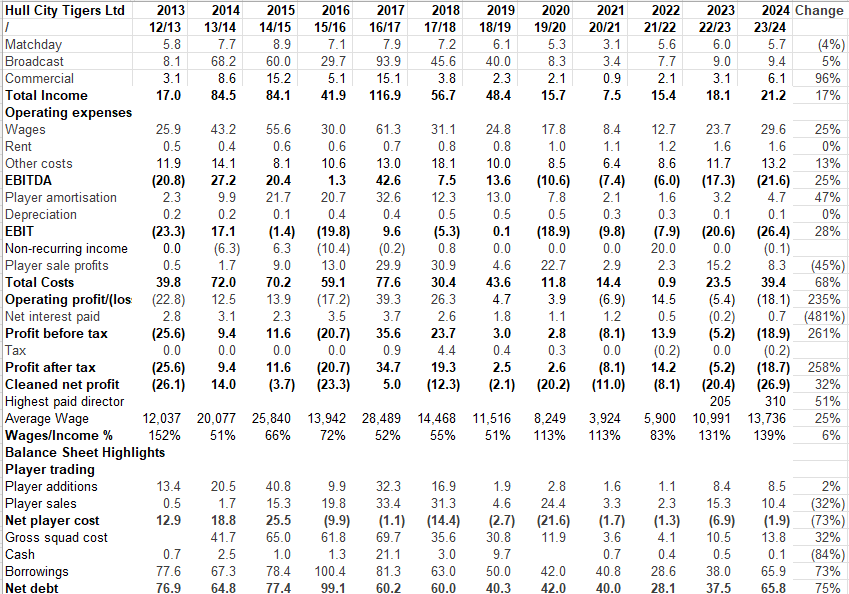
⚽️Revenue £21m ⬆️ 26%
⚽️Wages £26m ⬆️ 6%
⚽️Operating loss £21m ⬇️3%
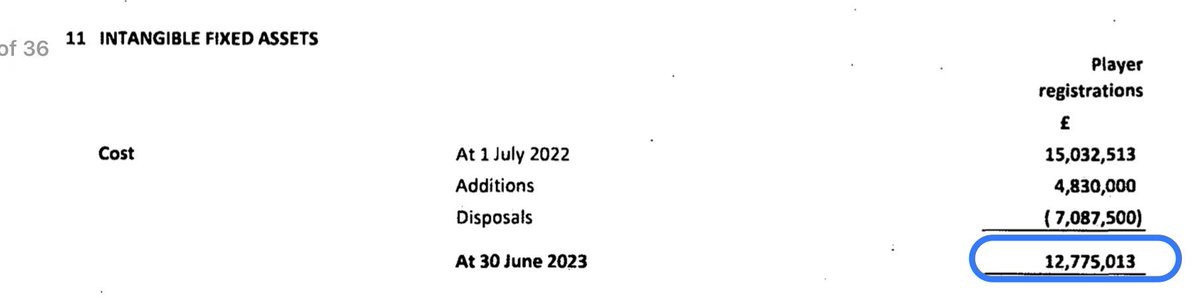
⚽️Player purchases £4.8m
⚽️Player sales £0.35m
⚽️Borrowings £141m
⚽️Revenue £21m ⬆️ 26%
⚽️Wages £26m ⬆️ 6%
⚽️Operating loss £21m ⬇️3%
⚽️Player purchases £4.8m
⚽️Player sales £0.35m
⚽️Borrowings £141m
Whilst #Rovers 🔑 revenue streams, matchday, broadcast & commercial all ⬆️ significantly. However general overheads ⬆️ too which meant no change to op losses. Sale of Armstrong in 21/22 halved losses


Both accounts & audit report reference that there is a material uncertainty over ability of club to trade as a going concern. Should no noted that audit report dated December 2023 & things may have improved since then


Total losses for Rovers now exceed £320 million

Because of difficulties in owners sending cash from India Rovers day to day cash management better than usual. Rovers only borrowed £400k in the year

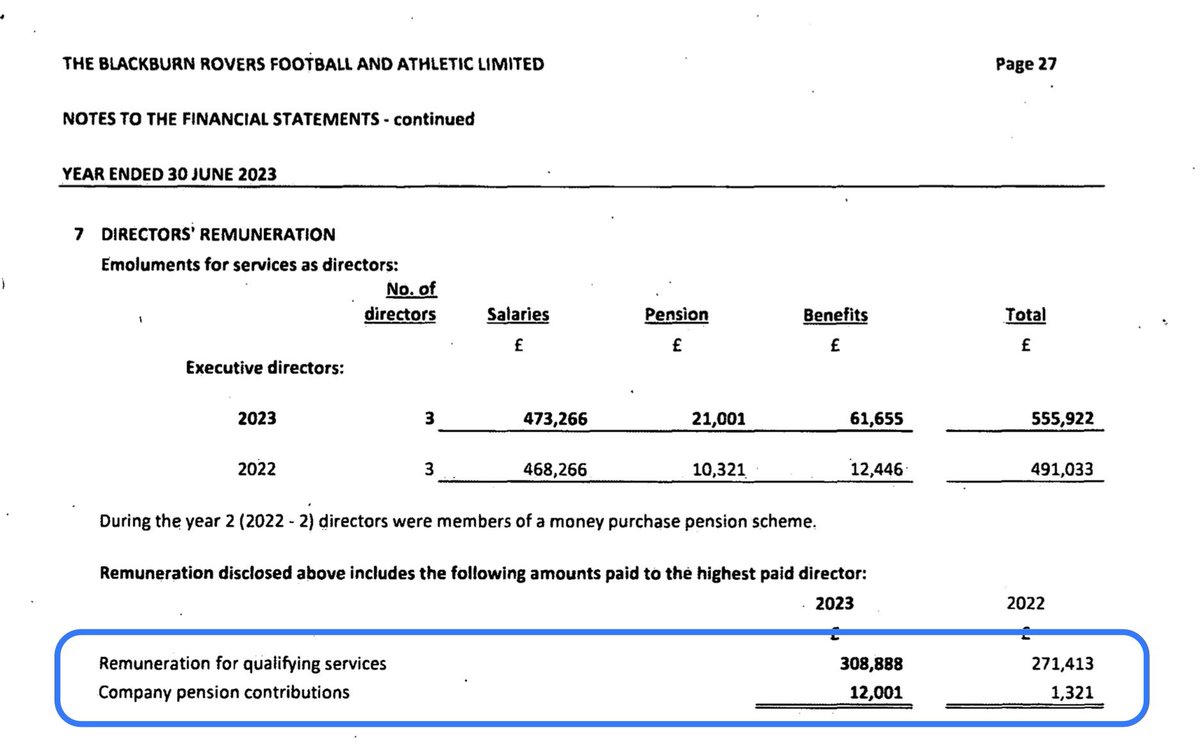
Main football costs (wages & amortisation) £140 for every £100 of income. Highest paid director package ⬆️ over £40k

Cost of putting together squad ⬇️ from £15m to £13m. Player who left the club originally cost over £7m but sales only brought in £349k.
Rovers only owed £50k from other clubs for transfer fees. Rovers owe over £4m on player purchase instalments. Loan from EFL should now be repaid. Venky’s wrote off £21m due to them by converting into shares.


Rovers may have to pay add ons of nearly £6m if certain conditions achieved.

Since 30 June Rovers have had net player sales of £3.4m

• • •
Missing some Tweet in this thread? You can try to
force a refresh