
1/7》GCP emission data shows 185.58 ppmv of fossil carbon emissions from 1959-2021 (plus a poorly constrained amt of non-fossil "land use change emissions"). Only about 5.56 ppmv (3%) was CO2 released from limestone [CaCO3] as it's baked to make cement.
https://twitter.com/ncdave4life/status/1753806747658051899
@Piyush__Tank @JessePeltan 2/7》It's estimated that, on average, as concrete weathers it absorbs roughly half as much CO2 as was released from the limestone when it was made. That halves the 3% (5.56 ppmv) figure to 1.5%. The process is akin to natural rock weathering:
sealevel.info/feedbacks.html…

sealevel.info/feedbacks.html…

3/7》It's often claimed that cement manufacturing causes "up to 8%" of anthropogenic CO2 emissions, but that figure includes estimated emissions from the fossil fuels burned to heat the kilns, typically accounting about half the total (though it varies according to how the kilns are fired).
cfdflowengineering.com/cfd-modeling-o…
cfdflowengineering.com/cfd-modeling-o…

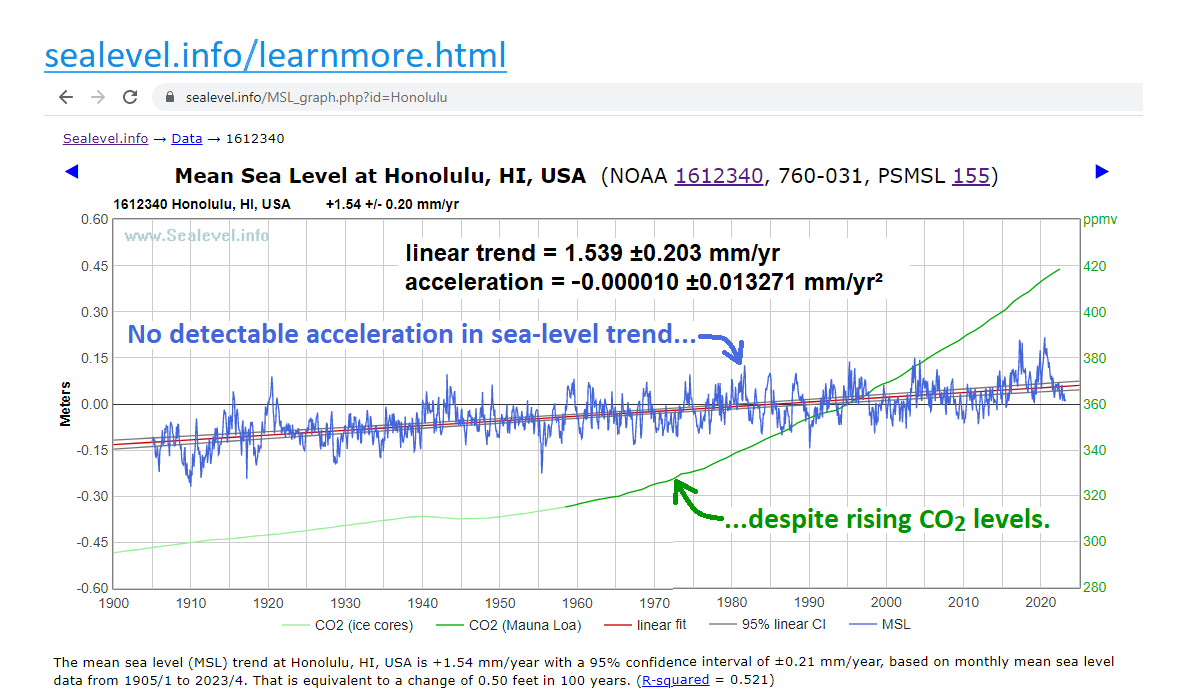
4/7》Note, though, that as mankind added that 185.58 ppmv of CO2 to the air (plus "land use change emissions"), the amount of CO2 in the air increased by only (416.41-315.24)= about 101 ppmv.
That's because "Nature" (the net sum of natural fluxes) simultaneously removed about 84 ppmv.
In fact, nature is currently removing an average net sum of about 2.5 ppmv of CO2 from the air each year (plus whatever you estimate our "land use change emissions" to be).sealevel.info/co2.html
That's because "Nature" (the net sum of natural fluxes) simultaneously removed about 84 ppmv.
In fact, nature is currently removing an average net sum of about 2.5 ppmv of CO2 from the air each year (plus whatever you estimate our "land use change emissions" to be).sealevel.info/co2.html
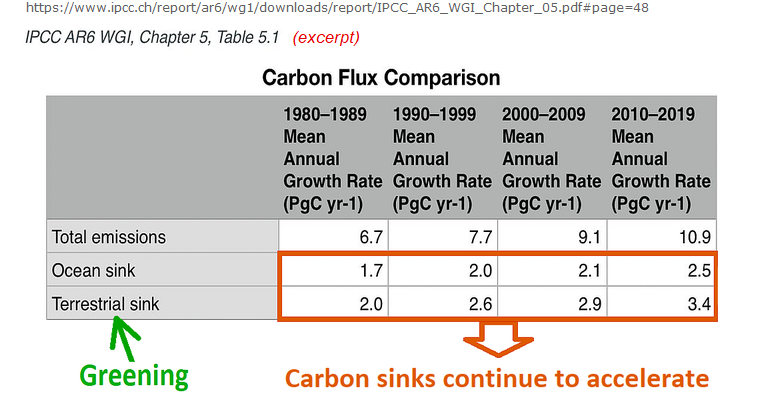
5/7》The higher CO2 levels in the atmosphere rise, the faster Nature removes CO2 from the air. For each 40-50 ppmv increase in the CO2 level, natural CO2 removals accelerate by about 1 ppmv/year.
This is one of the most important (albeit underappreciated) climate feedback mechanisms. It's really the combined effect of several feedbacks:
1. CO2 Fertilization Feedback (“greening”).
2. CO2 Absorption By Water Feedback.
3. CO2 Coccolithophore Feedback.
4. Rock Weathering Feedback.
sealevel.info/AR6_WG1_Table_…
sealevel.info/feedbacks.html…

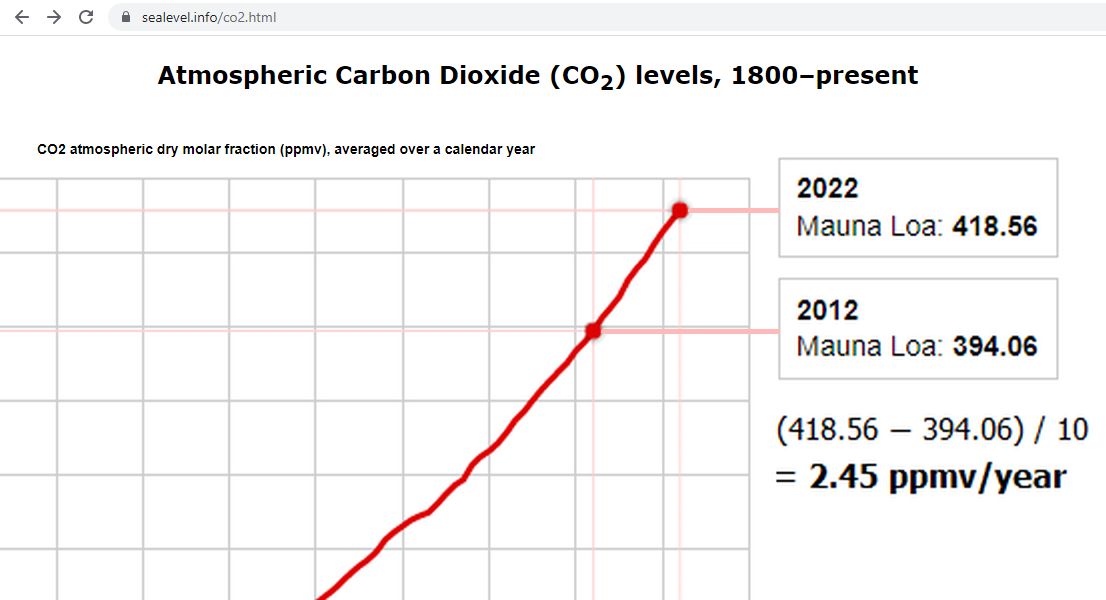
6/7》The atmospheric CO2 level is currently rising ≈2.45 ppmv/year.
That means if CO2 emissions were to continue at their current rate indefinitely, the atmospheric CO2 concentration would plateau at only 422 + (2.45 × (45±5)) ≅ 530 ppmv (which is 26% of a doubling).
(That's added to the 50% of doubling [280→420 ppmv] seen since the preindustrial late Little Ice Age, which has, so far, given us an estimated approximately 1°C of warming.)sealevel.info/co2_2012-2022_…
7/7》If any of this surprises you, you might not be getting balanced, accurate info. I'm here to help:
That resource list has:
● accurate introductory climatology info
● in-depth science from BOTH skeptics & alarmists
● links to balanced debates between experts on BOTH sides
● info about climate impacts
● links to the best blogs on BOTH sides of the climate debatesealevel.info/learnmore.html…
That resource list has:
● accurate introductory climatology info
● in-depth science from BOTH skeptics & alarmists
● links to balanced debates between experts on BOTH sides
● info about climate impacts
● links to the best blogs on BOTH sides of the climate debatesealevel.info/learnmore.html…
@Piyush__Tank @JessePeltan Compilation:
@ThreadReaderApp @Rattibha @threaddotblue unroll
@reSeeIt save threadtwitter-thread.com/t/177852264561…
@ThreadReaderApp @Rattibha @threaddotblue unroll
@reSeeIt save threadtwitter-thread.com/t/177852264561…
• • •
Missing some Tweet in this thread? You can try to
force a refresh


