
This tax day, let's address the populist myth that 𝐘𝐨𝐮 𝐀𝐫𝐞 𝐆𝐞𝐭𝐭𝐢𝐧𝐠 𝐒𝐜𝐫𝐞𝐰𝐞𝐝ᵀᴹ with the middle class paying all the taxes & the rich paying $0.
Yes, we can find individual examples, and maybe you wish the rich paid more. But they fund nearly all the govt.🧵
Yes, we can find individual examples, and maybe you wish the rich paid more. But they fund nearly all the govt.🧵

Previous chart showed the top-earning 20% paying nearly 70% of all federal taxes.
Below, their subset of federal income taxes is tilted to 90%.
Note the bottom-earning 40% of families now collectively pay negative income taxes.
Below, their subset of federal income taxes is tilted to 90%.
Note the bottom-earning 40% of families now collectively pay negative income taxes.

"Of course," critics respond, "the rich pay more of the income taxes over time only bc they are earning more of the income."
Not true. This chart holds income distribution constant by dividing each group's share of income taxes by share of income earned. Progressivity still⬆️
Not true. This chart holds income distribution constant by dividing each group's share of income taxes by share of income earned. Progressivity still⬆️

In fact, the average income tax rate paid by the top 1% has slightly risen since 1979. For lower-earners, average tax rates have dropped dramatically.
(Yes, these charts are actual taxes paid to IRS, including all deductions, loopholes, etc).
(Yes, these charts are actual taxes paid to IRS, including all deductions, loopholes, etc).

Overall, the federal govt has a very progressive tax code. The blue line is all federal taxes, the red is income taxes only. Again, these are actual taxes paid to the IRS.
The median earners pay an effective income tax rate of just 3%, higher earners pay much more on average.
The median earners pay an effective income tax rate of just 3%, higher earners pay much more on average.

In fact, in 2008 the OECD reported that the U.S. had the most progressive wage taxes in the OECD even controlling for income inequality.
And this understates the difference bc:
A) U.S. has become even progressive since, and
B) It excludes Europe's even more regressive VATs.
And this understates the difference bc:
A) U.S. has become even progressive since, and
B) It excludes Europe's even more regressive VATs.

But didn't the White House say the rich pay an 8% tax rate? Only if you redefine their income in a way no other country does, and also simply do not count the estate & corporate taxes the rich pay. In other words, its manipulated to produce a bogus stat.
wsj.com/articles/is-th…
wsj.com/articles/is-th…
This is how Washington was funded in 2023 (all taxes included, with each group's average combined rate embedded in the bars).
This is what a very progressive tax system looks like.
This is what a very progressive tax system looks like.

Put differently, the top 20% funded 209 days of federal spending in 2023. The bottom-earning 60% funded 24 days. Borrowing also funded 3 months.
This progressivity may be a good or bad thing, but let's not deny it exists.
This progressivity may be a good or bad thing, but let's not deny it exists.

But didn't tax rate cuts collapse revenues?
Well, since the 1950s the top income tax bracket fell from 91% to 28%, then up to current 37%.
And post-1980 income tax revenues (%GDP) have been ℎ𝑖𝑔ℎ𝑒𝑟 than in the high tax 1950s-1970s.
Tax rates aren't everything.
Well, since the 1950s the top income tax bracket fell from 91% to 28%, then up to current 37%.
And post-1980 income tax revenues (%GDP) have been ℎ𝑖𝑔ℎ𝑒𝑟 than in the high tax 1950s-1970s.
Tax rates aren't everything.

In 1961, all income tax brackets between 52% and 91% collectively brought in just 1% of income tax revenues compared to having a 50% top rate. That's how few people paid it. And accounting for econ effects may show a revenue 𝑑𝑒𝑐𝑙𝑖𝑛𝑒.
From me at: manhattan.institute/article/the-li…
From me at: manhattan.institute/article/the-li…

What about capital gains taxes? If we account for surtaxes and state taxes, even progressive economists concede they are near revenue-maximizing rates.
Over time, there is no positive correlation between capital gains rates and revenues.
Over time, there is no positive correlation between capital gains rates and revenues.

What about corporate tax rates? The 2017 tax reforms merely reduced the U.S. rate from #1 to above average in the OECD.
And, our effective corporate taxes paid are above average as well. More at manhattan.institute/article/the-li…
And, our effective corporate taxes paid are above average as well. More at manhattan.institute/article/the-li…

When you hear huge corporation X paid barely any taxes in a given year, it is often either:
A) Mostly foreign income that paid foreign income.
B) Much of the tax liability shifted across years.
C) They followed Washington incentives to invest/expand, R&D, or Biden energy credits.
A) Mostly foreign income that paid foreign income.
B) Much of the tax liability shifted across years.
C) They followed Washington incentives to invest/expand, R&D, or Biden energy credits.
What about left-wing Europe? America's top income, cap gains, corporate, and estate tax rates 𝗲𝘅𝗰𝗲𝗲𝗱 the OECD average and at times even left-wing Scandinavia.
And again, effective rates paid tell a similar story.
And again, effective rates paid tell a similar story.

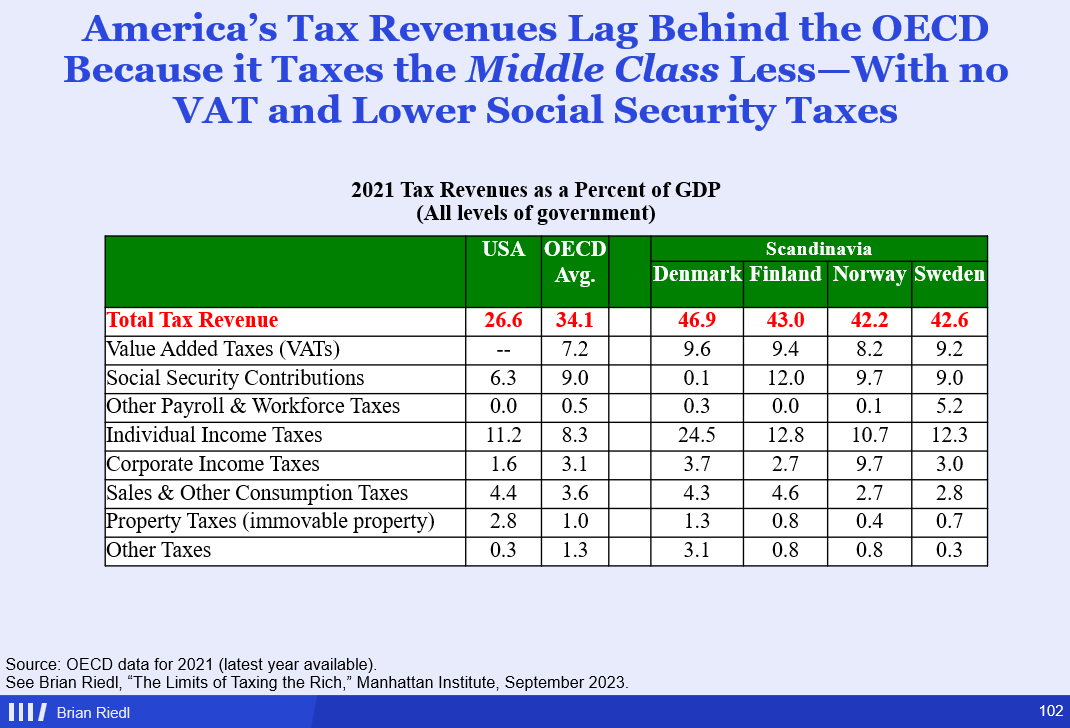
The reason the OECD revenues exceed the U.S. by 7.5% of GDP is because they raise 7.2% with VATs.
Scandinavia's larger overage is nearly all VATs & Social Security taxes.
Those are broad-based taxes, not extra taxes on the rich. Europe's taxes are less progressive than the U.S.
Scandinavia's larger overage is nearly all VATs & Social Security taxes.
Those are broad-based taxes, not extra taxes on the rich. Europe's taxes are less progressive than the U.S.
Overall, America taxes the rich and corporations similarly to OECD. But tax rates on middle- and low-earners have collapsed over the years, producing a more progressive tax code. Total revenues have remained mostly steady, with the overall burden shifting up the income ladder.

You are all free to endorse this progressivity and want even more. I'm not taking sides here.
But the lazy populist narrative that the middle class is getting buried in federal taxes while the rich pay little-to-nothing is simply false.
You are not getting screwed. Sorry.
(/F)
But the lazy populist narrative that the middle class is getting buried in federal taxes while the rich pay little-to-nothing is simply false.
You are not getting screwed. Sorry.
(/F)
*paid foreign income 𝑡𝑎𝑥𝑒𝑠.
• • •
Missing some Tweet in this thread? You can try to
force a refresh


