pedma Profile picture
Apr 20, 2024 26 tweets 7 min read Read on X
Every industry has a few books that will teach you 90% of what you need to know about it.

Here are the 24 books in systematic trading:

(ranging from learning basic python to advanced quantitative analysis)
1) Python for Data Analysis by Wes McKinney Image
2) Python for Finance by Yves Hilpisch Image
3) Quantitative Trading: How to Build Your Own Algorithmic Trading Business by Ernie Chan Image
4) Advances in Financial Machine Learning by Marcos López de Prado Image
5) Trading Systems: A New Approach to System Development and Portfolio Optimisation by Tomasini and Jaekle Image
6) The Evaluation and Optimization of Trading Strategies by Robert Pardo Image
7) Algorithmic Trading: Winning Strategies and Their Rationale by Ernie Chan Image
8) Systematic Trading: A unique new method for designing trading and investing systems by Robert Carver Image
9) Building Winning Algorithmic Trading Systems by Kevin Davey Image
10) The Science of Algorithmic Trading and Portfolio Management by Robert Kissell Image
11) Machine Learning for Algorithmic Trading by Stefan Jansen Image
12) Quantitative Momentum by Wesley R. Gray and Jack R. Vogel Image
13) Quantitative Value by Wesley R. Gray and Tobias E. Carlisle Image
14) Inside the Black Box: A Simple Guide to Quantitative and High-Frequency Trading by Rishi K. Narang Image
15) Financial Signal Processing and Machine Learning by Ali N. Akansu, Sanjeev R. Kulkarni, and Dmitry M. Malioutov Image
16) High-Frequency Trading: A Practical Guide to Algorithmic Strategies and Trading Systems by Irene Aldridge Image
17) Statistical Arbitrage: Algorithmic Trading Insights and Techniques by Andrew Pole Image
18) Time Series Analysis: Forecasting and Control by George E.P. Box, Gwilym M. Jenkins, and Gregory C. Reinsel Image
19) The Quants: How a New Breed of Math Whizzes Conquered Wall Street and Nearly Destroyed It by Scott Patterson Image
20) Flash Boys: A Wall Street Revolt by Michael Lewis Image
21) The Man Who Solved the Market: How Jim Simons Launched the Quant Revolution by Gregory Zuckerman Image
22) Market Wizards series by Jack D. Schwager Image
23) Expected Returns: An Investor's Guide to Harvesting Market Rewards by Antti Ilmanen Image
24) The Handbook of Portfolio Mathematics by Ralph Vince Image
Finding viable ideas for trading strategies is extremely hard.

I've decided to build a database of them.

Here's what you'll find:
- New strategy every week (52/year)
- Python code for each
- Access to the full archive

Join over 4,000 readers here:
pedma.carrd.co

• • •

Missing some Tweet in this thread? You can try to force a refresh
 

Keep Current with pedma

pedma Profile picture

Stay in touch and get notified when new unrolls are available from this author!

Read all threads

This Thread may be Removed Anytime!

PDF

Twitter may remove this content at anytime! Save it as PDF for later use!

Try unrolling a thread yourself!

how to unroll video
  1. Follow @ThreadReaderApp to mention us!

  2. From a Twitter thread mention us with a keyword "unroll"
@threadreaderapp unroll

Practice here first or read more on our help page!

More from @pedma7

Jul 6
delta-neutral cross sectional momentum in crypto.

this week I've been integrating the optionality of making my testing/prod portfolio delta-neutral.

this is an exploration thread into this topic, and my thoughts as I am designing it. Image
xs momo & delta-neutral models have been around for long time, there's nothing new here.

however the idea of a portfolio benefiting from delta-neutral exposure on reversals is quite interesting to test.

@ScottPh77711570 has interesting points below.

the initial challenge was integrating it with my current backend.

here's roughly the workflow I had:

> calculate signals for all assets (within universe)
> rank signals
> pick from top/bottom ranked signals for today's exposures
> adjust daily exposures based on threshold diff from expected exposures

however, to be truly delta-neutral at all times, I need to be continuously evaluating signal based on current holdings.

for example, if I am going long/short the top/bottom deciles, I only care for signal before it is ranked, since after I will go short even if the signal is positive, to achieve that neutrality (there's different methods but for now I will keep this).

in a highly correlated asset class like crypto, its unlikely I can have quality equal amount of long/short momo signals in the top 100 by market cap (or wtv threshold you use), so we need to force it.

so I had to design almost a secondary signal to infer my allocation, on my current design of inventory management.
Read 12 tweets
Mar 3
I will continue this thread here.

to finish the continuous positioning simulation, I have to debug. on each given day, I need to find out:

> the target size
> the actual size
> adjustments to the size
> costs of the adjustment
> balance adjustment

this is boring but necessary Image
lets look at the first day.

the weight of the signal tells me to allocate roughly 99% of size.
the realized volatility is around 68%.

so the target position size is (target_vol / max_pos) / current_vol * port_size * signal weight

(0.4 / 1) / 0.68 * 100 * 1 = $59 Image
the quantities align , and dont need any adjustment , because we are using a daily buffer of 10% between our target size and the actual size on any given day. Image
Read 7 tweets
Mar 2
so the next task is how I turn this trend signal into a weight I can allocate to.

I remember this tweet from macrocephalopod where he mentions a sigmoid function.

it's pretty straight forward so let's implement it to the signal.

Image
now once this mapping is done , I don't know when to change my allocations.

in a perfect world of no costs, we'd do this as much as we could, every second if possible.

but trading costs money so we need to trade when we have to.

by the way, this is a continuation of the thread below as we are looking at a simple sma trend signal in crypto.

I've measured the correlation with future returns, and now I want to know , how to trade around it, with a continuous forecast.

Read 17 tweets
Mar 2
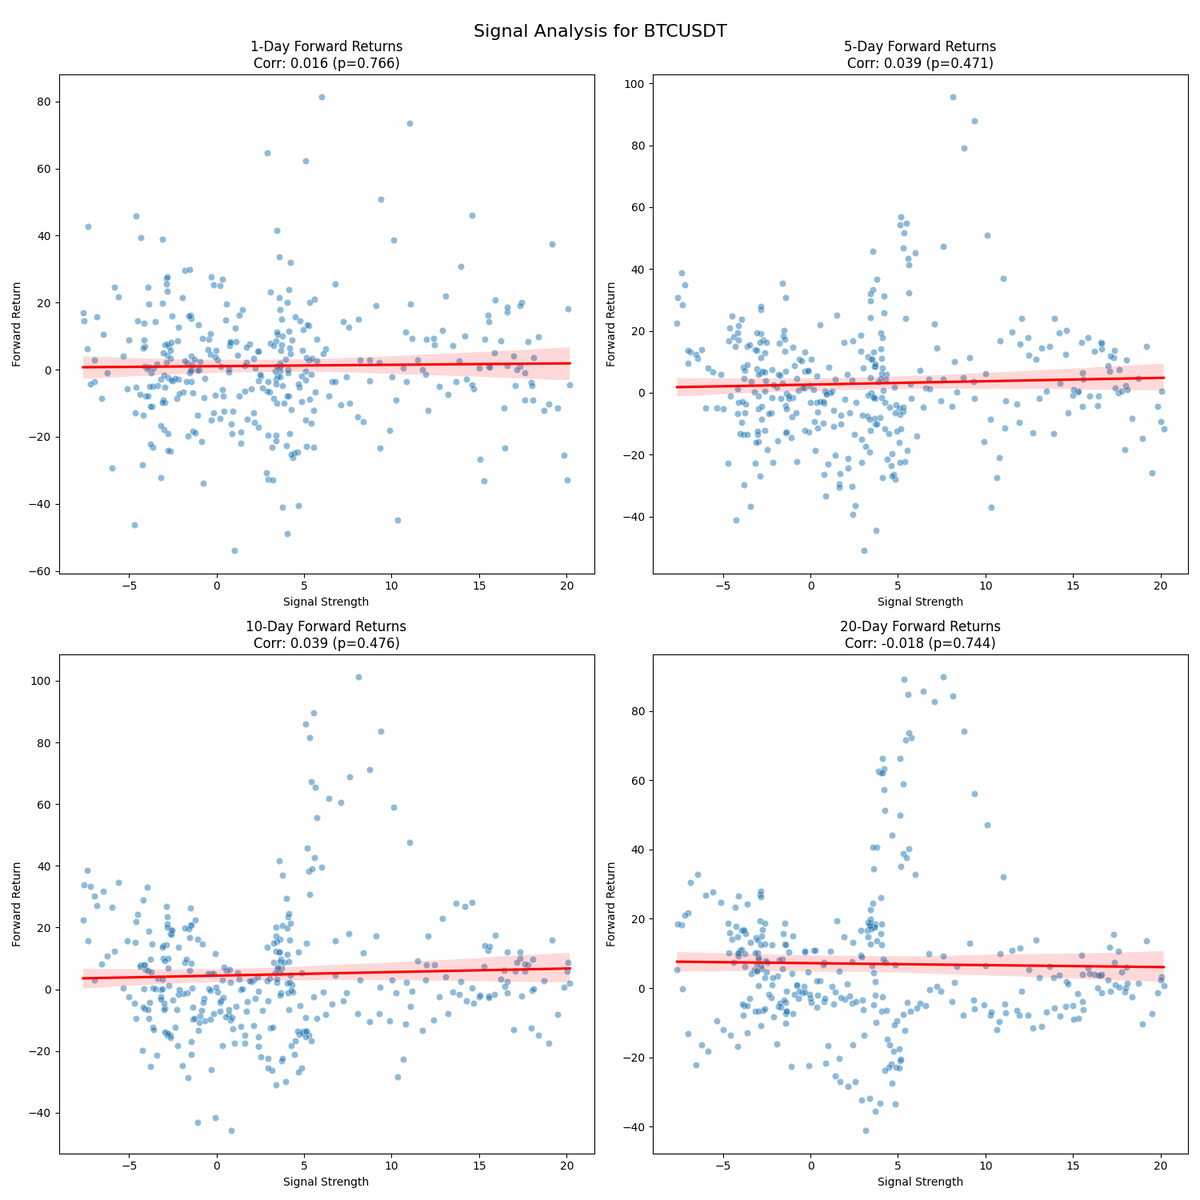
so if we measure the continuous signal of a simple ma crossover (for simplicity) , I can see that it is pretty noisy.

there seems to be some relationship there, especially on the tails , but pretty weak close to 0, as expected. Image
however there's something missing here.

I am measuring forward absolute returns, which is influenced by the asset's own volatility at the time.

earlier points will have higher vol as market caps were lower and things were a lot more jumpy.
I noticed that I was scaling the ma_distance into a -1 , 1 range, which is fine, but I dont want to do that yet.

I reverted it back to a sma absolute distance, and this is what it looks like.

however, as I am normalizing the return, I think I should also normalize the distance, to make sure it is fairly measured across different regimes and assets.Image
Read 10 tweets
Feb 13
3,923% compounded returns from this crypto strategy.

Not from gambling or luck, but from a simple systematic approach.

The best part? It only had a -27% max drawdown.

Here's the full breakdown of this strategy: Image
1/ Total returns comparison:

• Strategy return: +3,923%
• Benchmark return: +2,541%
• Market return: +1,610%

Strategy outperformed the market by 2.4x and benchmark by 1.5x over the testing period. Image
2/ Risk-adjusted performance:

• Strategy Sharpe: 1.50
• Market Sharpe: 0.89
• Benchmark Sharpe: 0.98

Higher Sharpe ratio indicates better returns per unit of risk taken. Image
Read 10 tweets
Nov 26, 2024
You are being lied to about your trading strategy's returns.

Traders waste 1000's of hours coming up with strategies to beat benchmarks like the S&P500.

But even when they find them, do they really beat it?

Here's what traders should be looking at instead: 🧵 Image
1) What is Beta?

Let's start with something that a lot of people misunderstand.

If every time that SPY goes up by 1%, your strategy goes up by 2%, your strategy has a beta of 2 to SPY.

Simple enough, but let's go deeper.
Beta tells us how much of our returns are just amplified market moves.

It's like having a "multiplier" to whatever the benchmark we are using does.

So far it might look trivial, but this can potentially destroy your portfolio. Image
Read 15 tweets

Did Thread Reader help you today?

Support us! We are indie developers!


This site is made by just two indie developers on a laptop doing marketing, support and development! Read more about the story.

Become a Premium Member ($3/month or $30/year) and get exclusive features!

Become Premium

Don't want to be a Premium member but still want to support us?

Make a small donation by buying us coffee ($5) or help with server cost ($10)

Donate via Paypal

Or Donate anonymously using crypto!

Ethereum

0xfe58350B80634f60Fa6Dc149a72b4DFbc17D341E copy

Bitcoin

3ATGMxNzCUFzxpMCHL5sWSt4DVtS8UqXpi copy

Thank you for your support!

Follow Us!

:(