💵 Liquidity moves markets.
⬇️ And markets were hit by a substantial drop in liquidity last week.
📉 Not surprisingly, markets struggled.
📝 Let me show you exactly what happened - and 3⃣ things to look out for next: 🧵👇
⬇️ And markets were hit by a substantial drop in liquidity last week.
📉 Not surprisingly, markets struggled.
📝 Let me show you exactly what happened - and 3⃣ things to look out for next: 🧵👇

Total Global Liquidity (TGL) is what ultimately matters the most for asset prices - but an important component of TGL is Net Federal Reserve Liquidity (liquidity from Federal Reserve sources).
Net Fed Liquidity has been rising since early 2023.
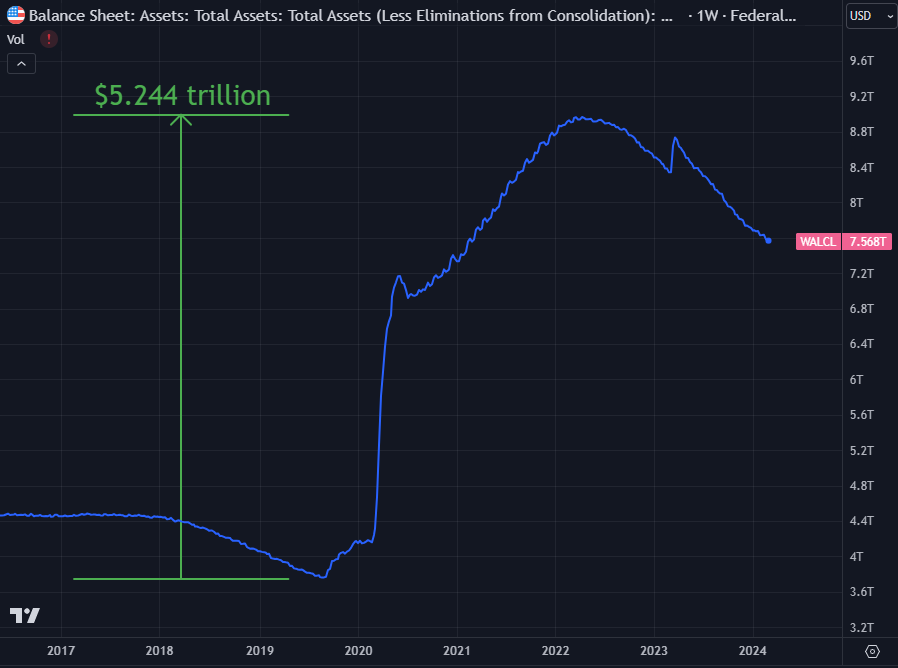
The Federal Reserve is officially "tightening" and reducing its balance sheet.
But through the back door it has actually been juicing markets with liquidity, alongside the US Treasury.
Rising Net Fed liquidity has coincided with a rise in asset prices.
The price of the S&P, gold and bitcoin have all soared [picture 1].
Rising Net Fed liquidity is particularly correlated to the price of bitcoin [picture 2]. It doesn't track perfectly on a tick-by-tick basis. However, periods of generally declining Net Fed Liquidity coincide with $BTC down or flat, while periods of generally rising Net Fed Liquidity coincide with $BTC up.
Net Fed Liquidity has been rising since early 2023.
The Federal Reserve is officially "tightening" and reducing its balance sheet.
But through the back door it has actually been juicing markets with liquidity, alongside the US Treasury.
Rising Net Fed liquidity has coincided with a rise in asset prices.
The price of the S&P, gold and bitcoin have all soared [picture 1].
Rising Net Fed liquidity is particularly correlated to the price of bitcoin [picture 2]. It doesn't track perfectly on a tick-by-tick basis. However, periods of generally declining Net Fed Liquidity coincide with $BTC down or flat, while periods of generally rising Net Fed Liquidity coincide with $BTC up.


It had been expected that Net Fed Liquidity was likely to drop in Q2 2024.
And this could be a serious headwind for asset prices.
A large part of this drop in liquidity has now occurred.
Let's take a closer look...
And this could be a serious headwind for asset prices.
A large part of this drop in liquidity has now occurred.
Let's take a closer look...
FED LIQUIDITY FALLING
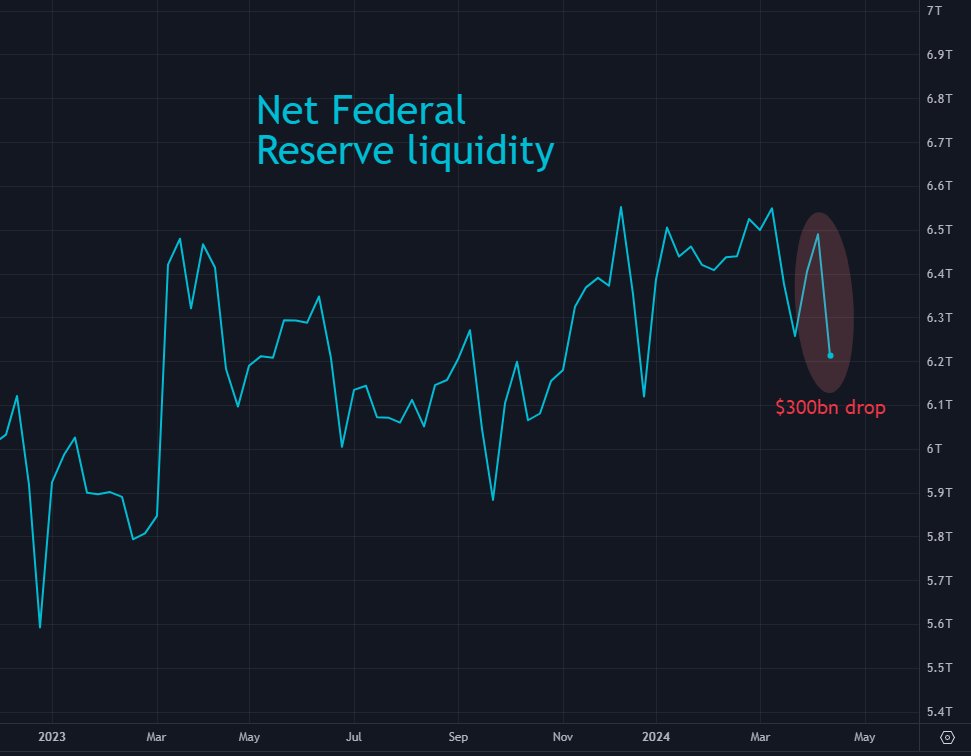
Net Fed Liquidity took a serious nosedive last week.
It dropped by around $300bn.
It has now fallen to its lowest level so far in 2024.
(How I calculate Net Fed Liquidity using TradingView: WALCL - WDTGAL - RRPONTSYD + H41RESPPALDKNWW + WLCFLPCL)
Net Fed Liquidity took a serious nosedive last week.
It dropped by around $300bn.
It has now fallen to its lowest level so far in 2024.
(How I calculate Net Fed Liquidity using TradingView: WALCL - WDTGAL - RRPONTSYD + H41RESPPALDKNWW + WLCFLPCL)
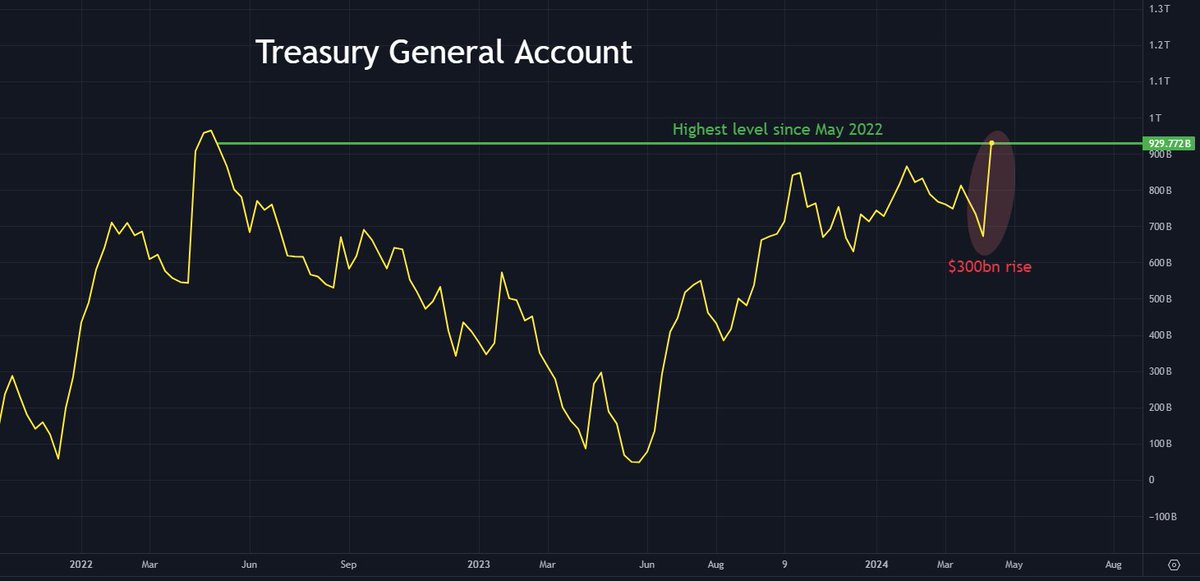
TGA SWELLING
This drop in Net Fed Liquidity was due to taxes being paid in the US, with the cash now filling up the Treasury General Account (TGA).
This is a drain of liquidity from markets.
The TGA has jumped from $672bn to $929bn - its highest level since May 2022.
It may continue to climb a little further over the next few weeks as excess tax cash trickles in.
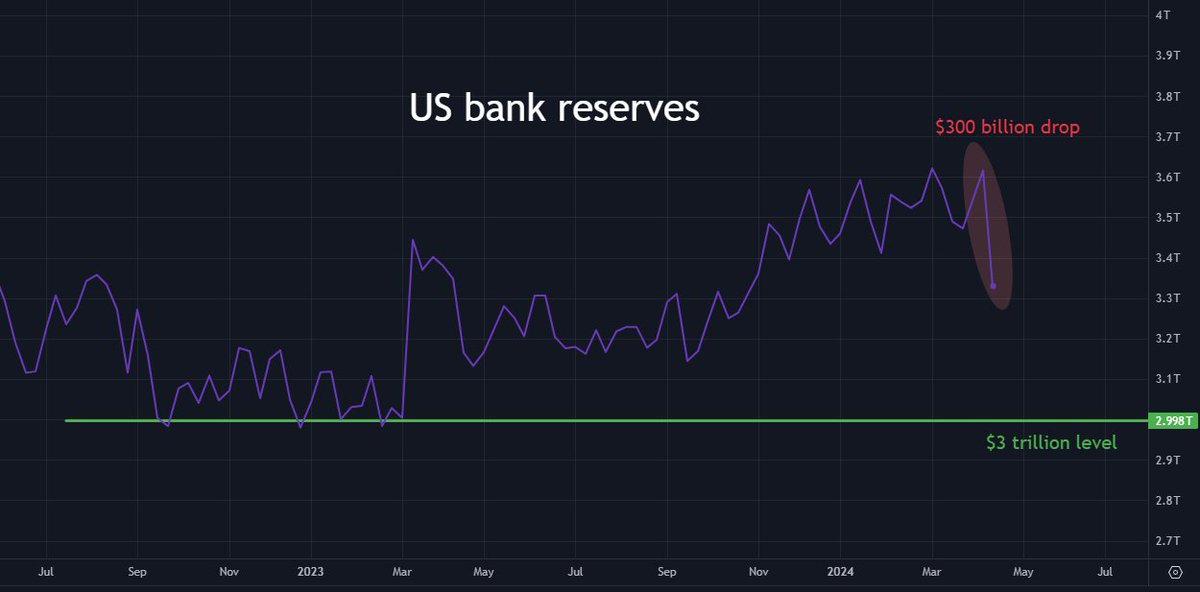
BANK RESERVES FALLING
The liquidity drain can also be seen in US bank reserves.
Around $300bn moved out of US bank reserves over the past week as taxes were paid.
That's a drop of around 8%, from $3.615tr to $3.329tr.
Banks use these reserves to buy bonds from each other - meaning higher reserves push liquidity into the market and drive investors into riskier assets.
A fall in bank reserves can generally be viewed as bad news for asset prices.
And a fall in bank reserves could also spark trouble in the banking sector.
The Federal Reserve is acutely aware of the need to keep bank reserves above an "adequate threshold", but it is unclear exactly where that threshold is.
It is estimated that it could stand at around $3 trillion, which is where the Fed stepped in to provide liquidity in Q1 2023 amid the US regional banking crisis.
WHAT TO LOOK OUT FOR?
Both the Federal Reserve and the Treasury know they need to maintain an adequate amount of liquidity and keep bank reserves above the "adequate threshold".
It's likely that some combination of the below actions will be taken over the coming weeks/months.
Look out for:
Both the Federal Reserve and the Treasury know they need to maintain an adequate amount of liquidity and keep bank reserves above the "adequate threshold".
It's likely that some combination of the below actions will be taken over the coming weeks/months.
Look out for:
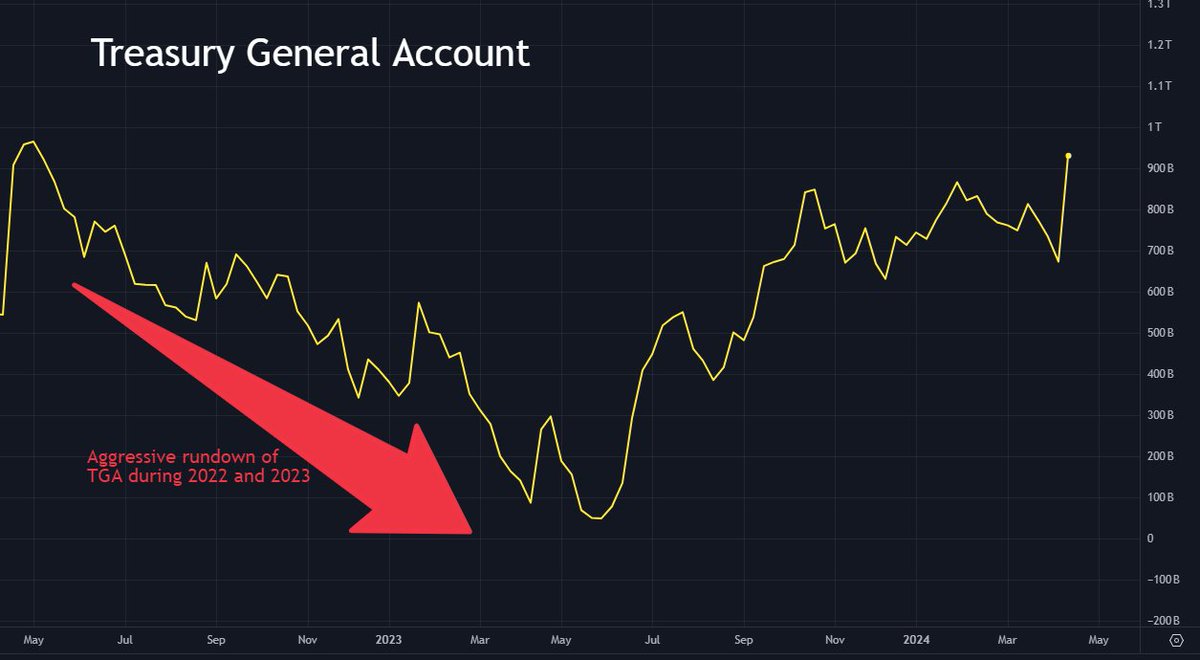
1⃣ TGA SPLURGE
After May 2022, when the TGA was as high as it is now, Treasury Secretary Janet Yellen aggressively spent down the TGA, splurging nearly $1 trillion (sending massive amounts of liquidity into markets).
It's expected that at least some of the TGA will be spent down again in the coming months.
Although, how much is spent remains to be seen.
Yellen could be inclined to run it down aggressively again in the all-important run-up to the US election to juice asset markets and help to alleviate any liquidity issues within Treasury markets.
She's done it before - so she might just do it again.
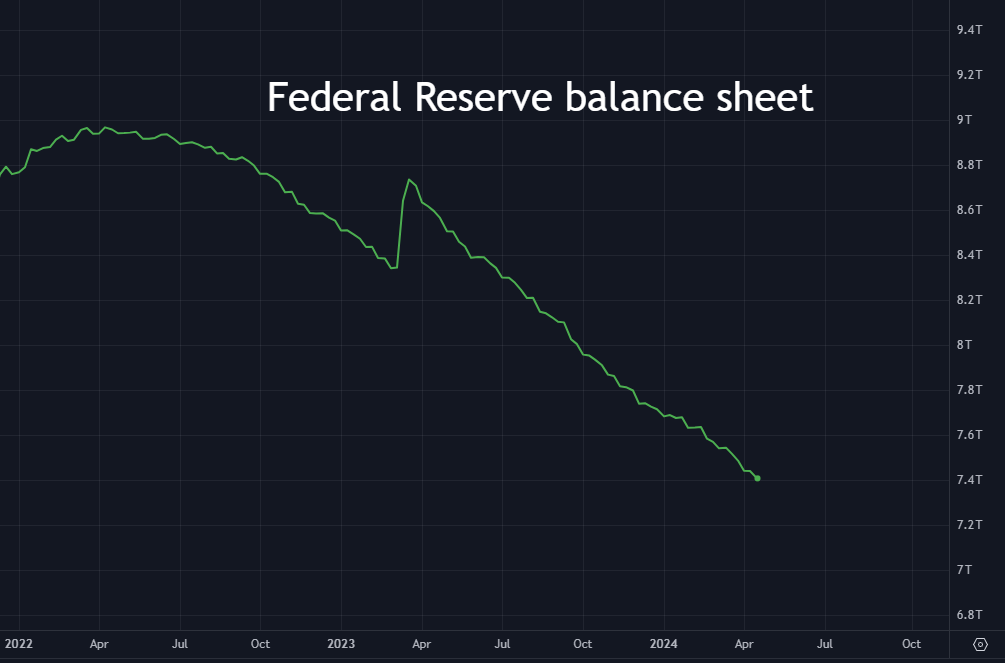
2⃣ QT TAPER
The Fed has been reducing or "running off" its balance sheet (Quantitative Tightening) for two years, offloading about $1.5 trillion in assets.
This process removes liquidity from markets as overall Fed demand for Treasuries and Mortgage Backed Securities falls.
The Fed is expected to taper (slow the pace of) its QT by 50% at some point this year (which will help ease liquidity pressures).
FOMC members began to discuss this at the last meeting in March.
However, QT tapering has not yet started (many believe it's likely to begin in May or June).
3⃣ QRA shenanigans
The Treasury will issue its Quarterly Refunding Announcement (QRA) next week.
This is important and will be a market-moving event - because of how the Treasury has utilized (weaponized) its debt issuance recently.
Without going into too much detail (I might do a separate thread breaking this down for those interested), the Treasury may decide to cut back on Treasury coupon issuance and increase T-bill issuance again.
This would be a liquidity positive development for asset markets.
If you enjoyed this thread and want to see more just like it, follow me @TomasOnMarkets.
I craft regular threads on markets and macroeconomics.
I craft regular threads on markets and macroeconomics.
• • •
Missing some Tweet in this thread? You can try to
force a refresh