Learn about the 3 financial statements, and how they are all connected
In just a few minutes, I'm going to teach you the most important concepts behind the Financial Statements...
and we're going to have a TON of fun along the way...
In just a few minutes, I'm going to teach you the most important concepts behind the Financial Statements...
and we're going to have a TON of fun along the way...

The 3 financial statements are:
1. The Profit & Loss
2. The Balance Sheet
3. The Statement of Cash Flows
You may also hear of the Statement of Changes in Equity, and Notes to the financial statements, but those aren't as commonly included
1. The Profit & Loss
2. The Balance Sheet
3. The Statement of Cash Flows
You may also hear of the Statement of Changes in Equity, and Notes to the financial statements, but those aren't as commonly included
Before we dive into each statement...
It's important to understand the difference between:
the CASH basis
→ treats money in as income
→ money out as expenses
the ACCRUAL basis
→ treats amounts EARNED as income
→ amounts INCURRED as expenses
It's important to understand the difference between:
the CASH basis
→ treats money in as income
→ money out as expenses
the ACCRUAL basis
→ treats amounts EARNED as income
→ amounts INCURRED as expenses

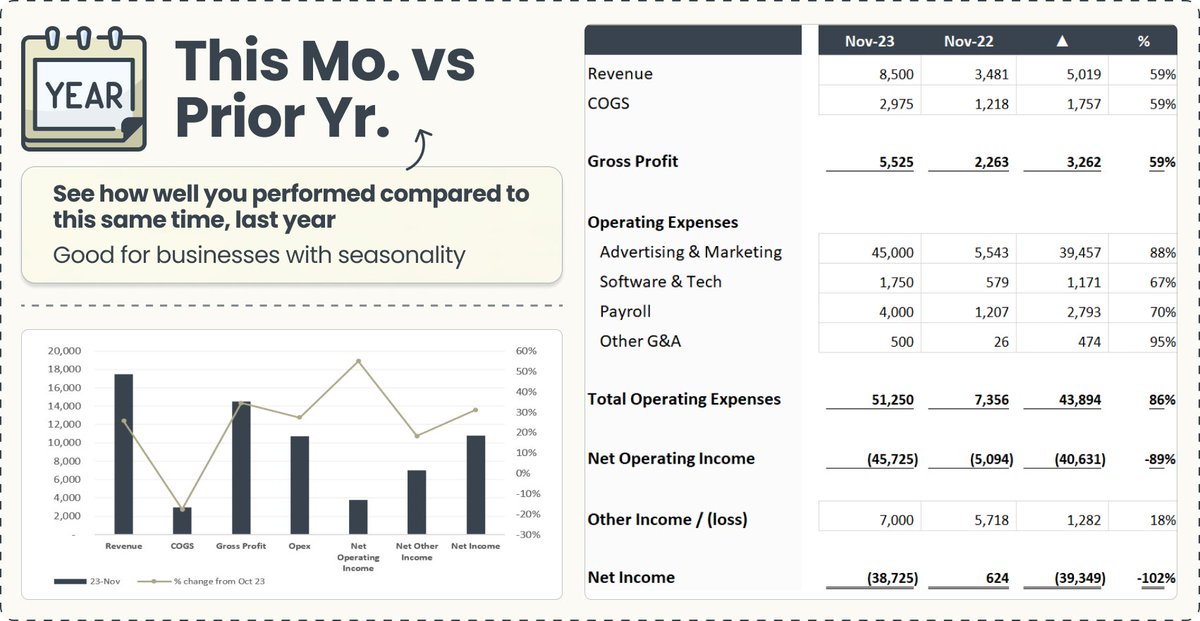
Statement #1: The Profit & Loss
Also referred to as the Income Statement
This tells you what you about your
INCOME
EXPENSES
and PROFITS
it sums up the data from the start & end date selected
Let's do a deep dive on each section 👇
Also referred to as the Income Statement
This tells you what you about your
INCOME
EXPENSES
and PROFITS
it sums up the data from the start & end date selected
Let's do a deep dive on each section 👇
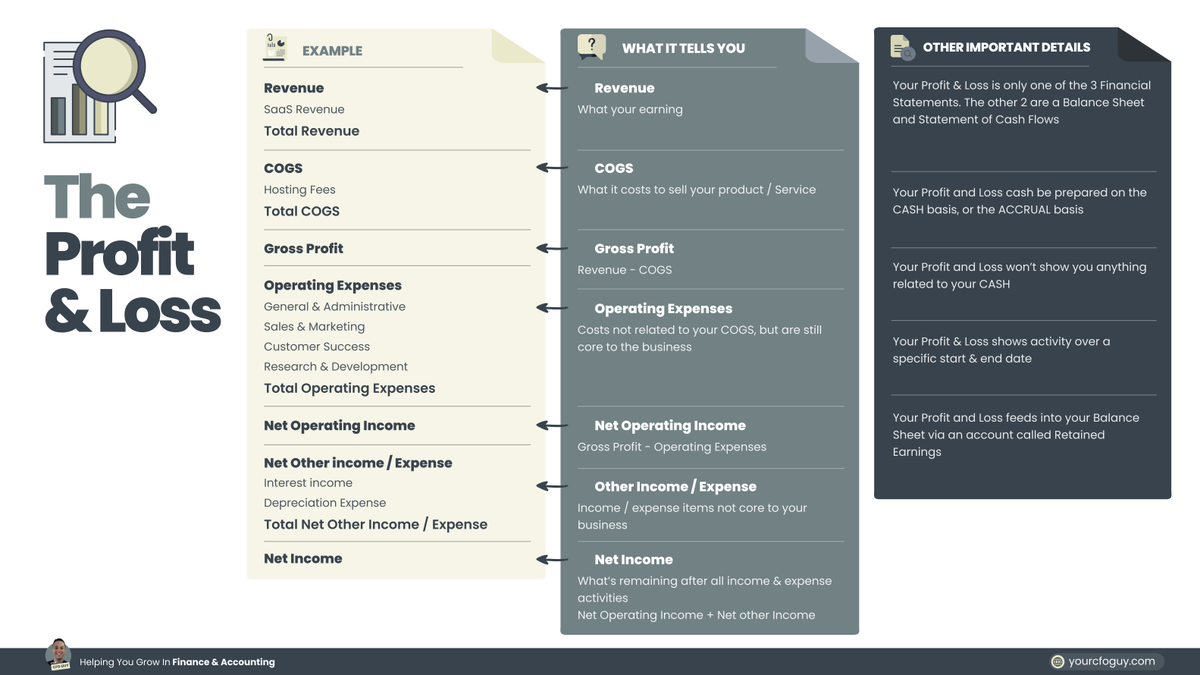
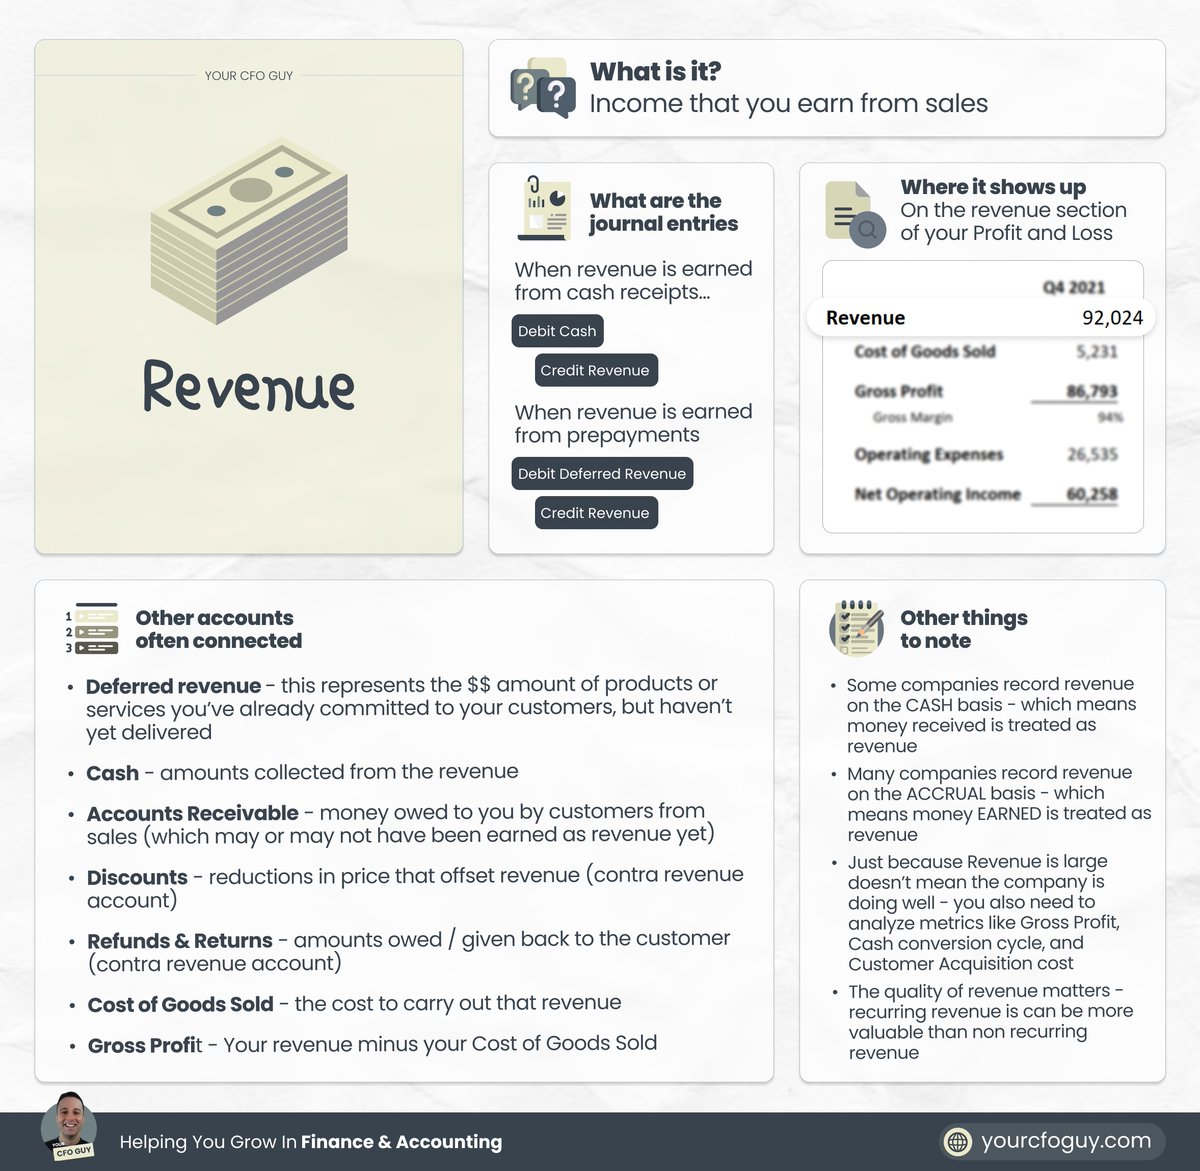
Revenue
This is how much you are generating in income from your customers
Under the accrual basis of accounting, this reflects the amounts EARNED by delivering your product or service
Under the cash basis, this would reflect amounts RECEIVED from customers
This is how much you are generating in income from your customers
Under the accrual basis of accounting, this reflects the amounts EARNED by delivering your product or service
Under the cash basis, this would reflect amounts RECEIVED from customers
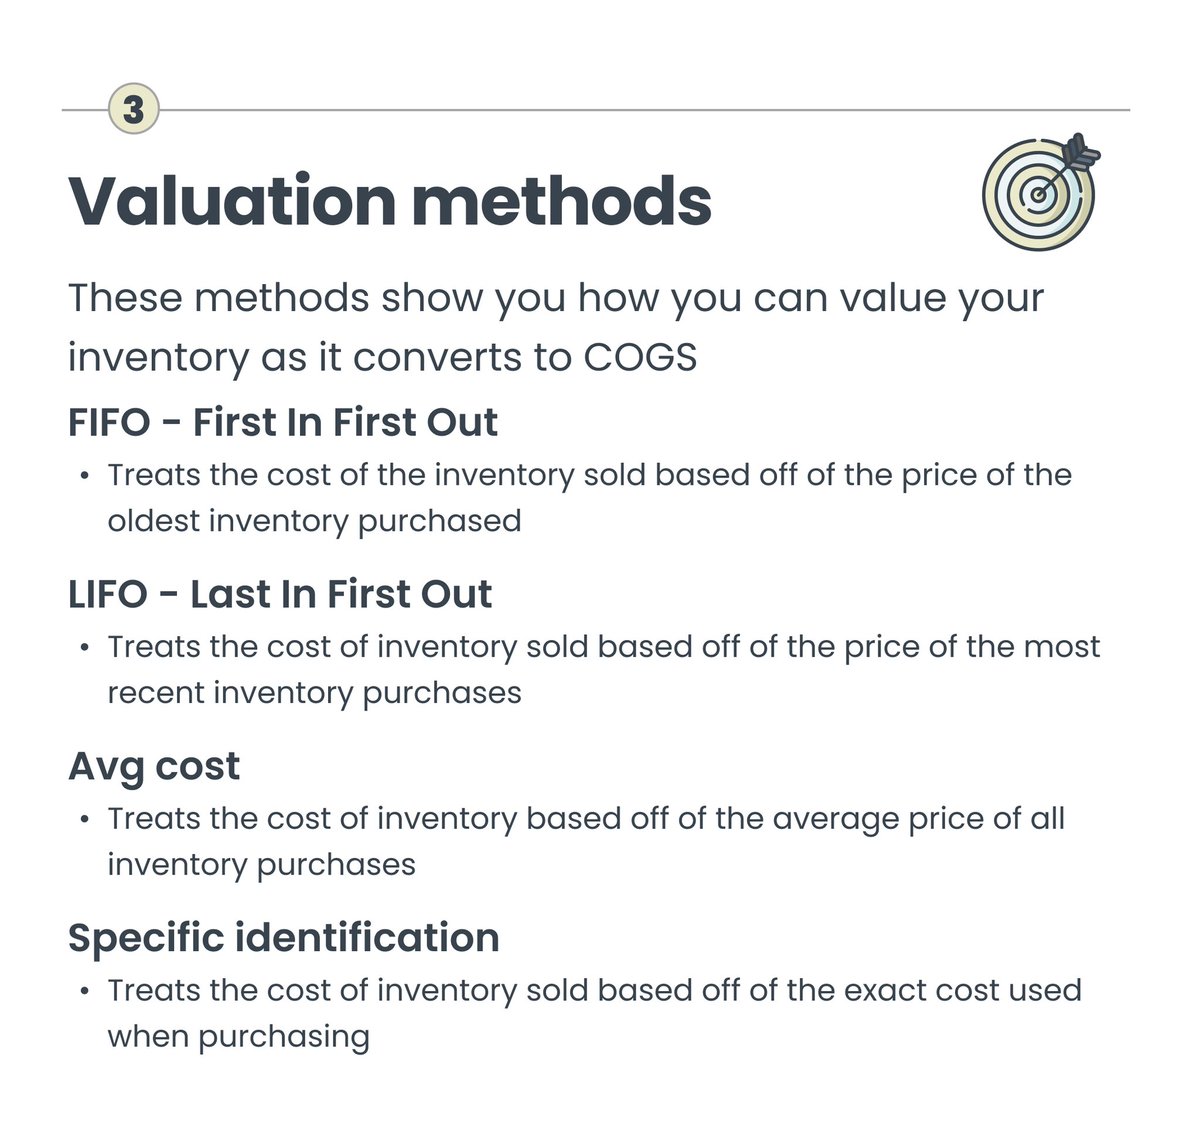
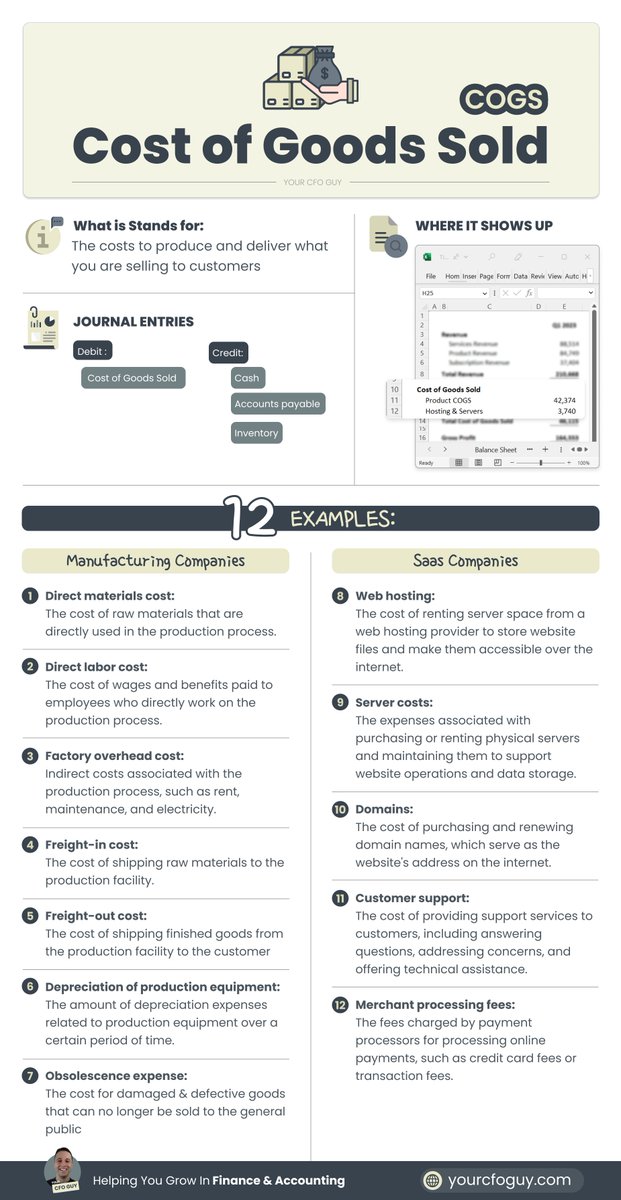
Cost of Goods Sold (COGS)
This represents the cost to produce & deliver your product or service
If you sell widgets, this would be the cost associated with producing the widget
If you sell software, this would include the cost to host your tech
This represents the cost to produce & deliver your product or service
If you sell widgets, this would be the cost associated with producing the widget
If you sell software, this would include the cost to host your tech
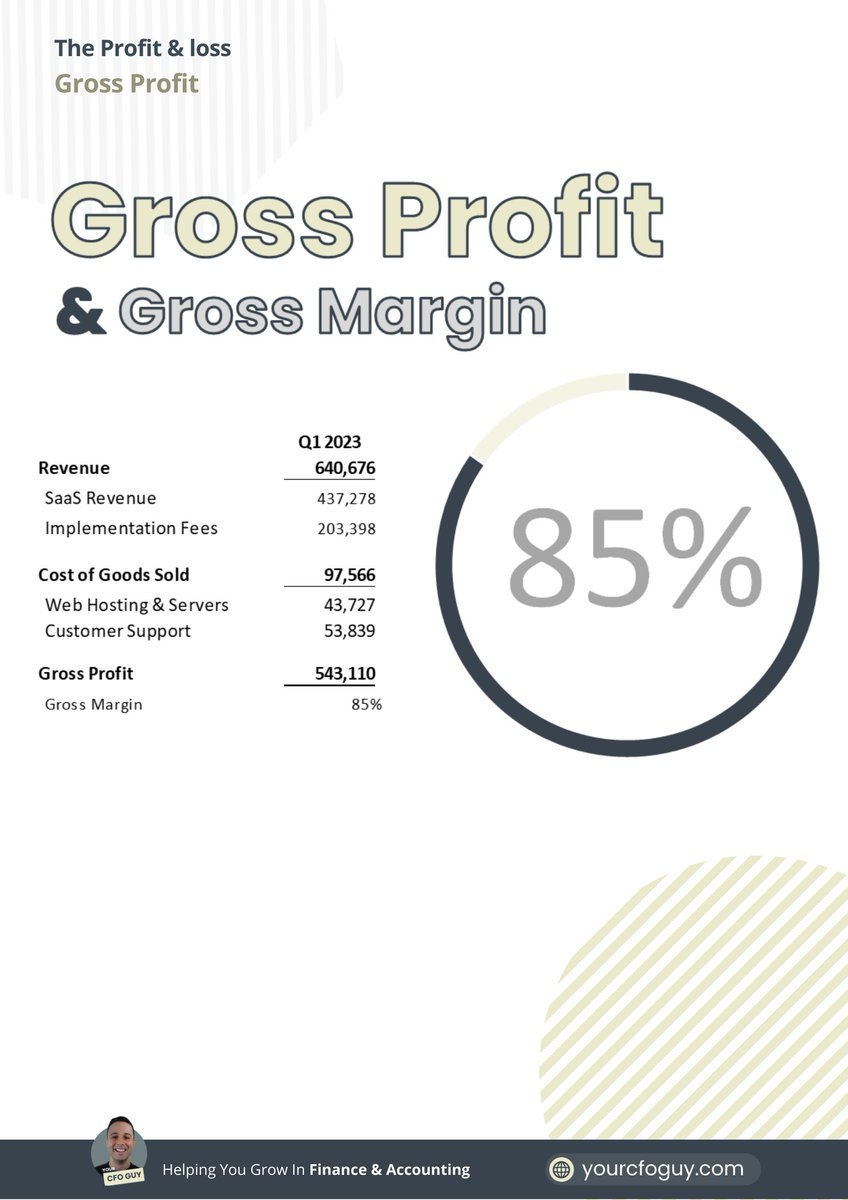
Gross Profit
Now we get to our first profitability metric...Gross profit
Formula → Revenue - COGS
This tells you how much you are netting after each sale
The higher the gross profit, the more you can invest into all other areas of your business
Now we get to our first profitability metric...Gross profit
Formula → Revenue - COGS
This tells you how much you are netting after each sale
The higher the gross profit, the more you can invest into all other areas of your business
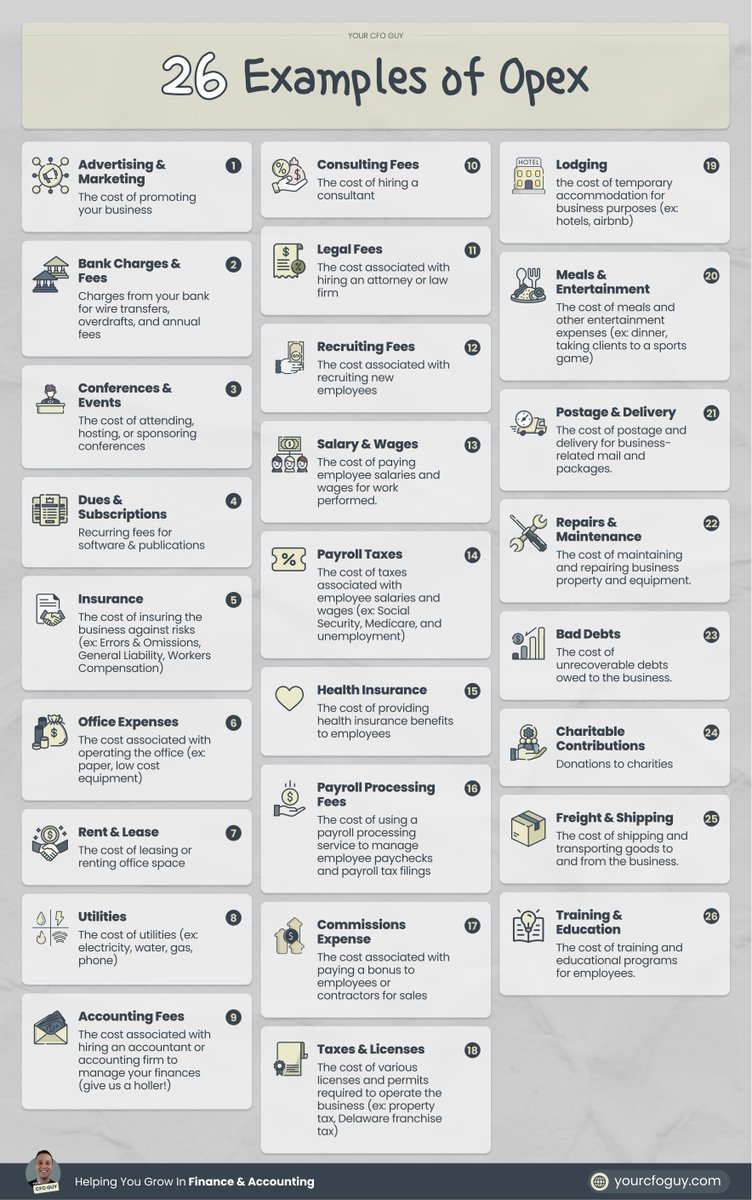
Operating Expenses (opex)
These represent the cost to operate your business
Most common ones are payroll, rent, and sales & marketing
These represent the cost to operate your business
Most common ones are payroll, rent, and sales & marketing
Net Operating Income
Here comes our 2nd profitability metric
Formula → Gross Profit - Opex
This shows how much is left over from your sales after subtracting out the costs to operate your business
Here comes our 2nd profitability metric
Formula → Gross Profit - Opex
This shows how much is left over from your sales after subtracting out the costs to operate your business

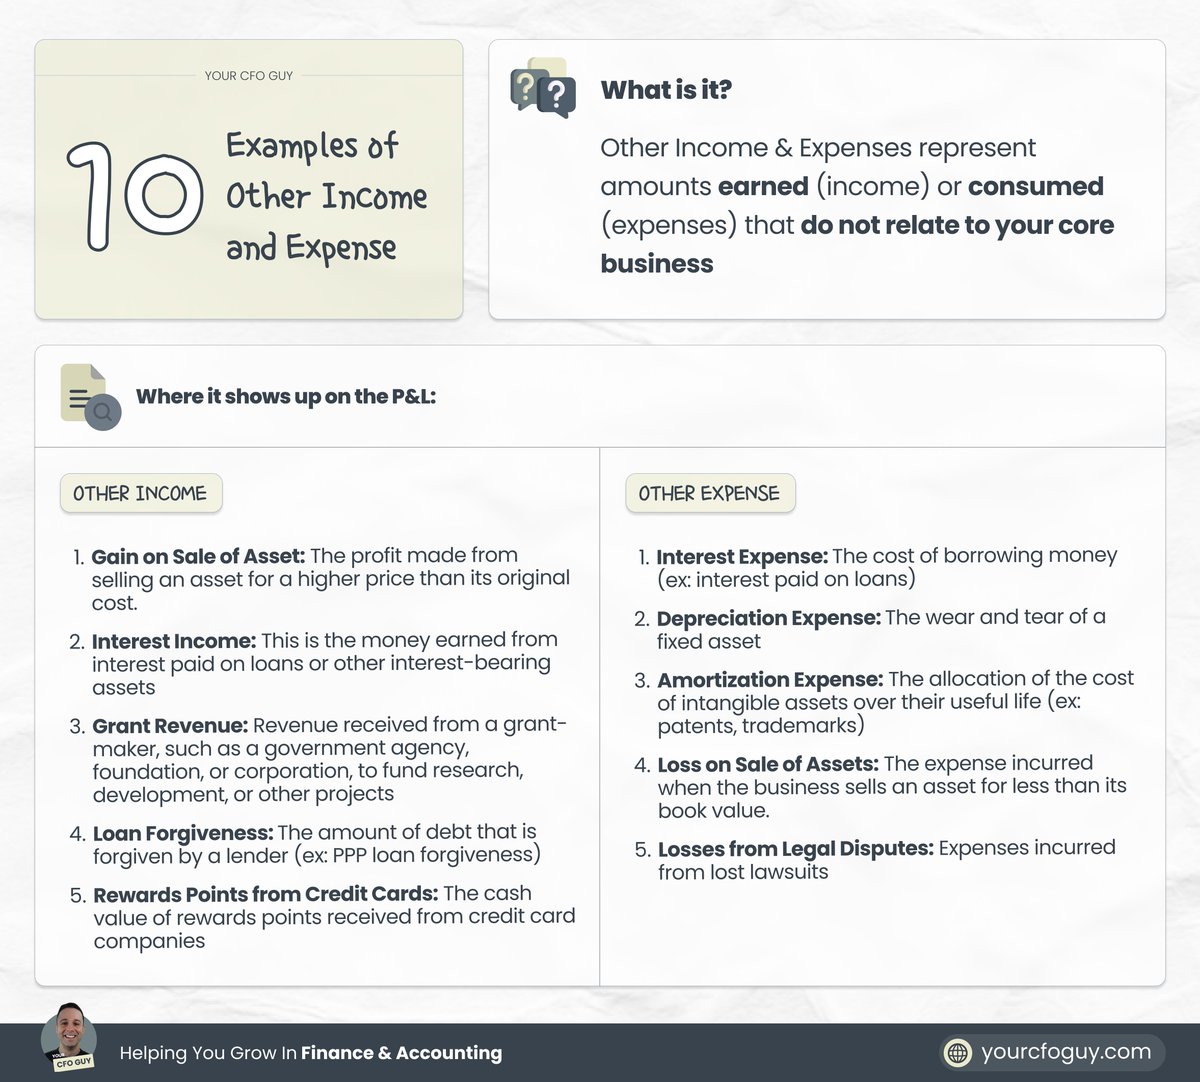
Other Income / Other Expense
Now we get to our "other" items
These are income & expense items that don't relate to your core business, but still are part of your business activity
Together, they make up your net operating income
Formula → Other Income - Other Expense
Now we get to our "other" items
These are income & expense items that don't relate to your core business, but still are part of your business activity
Together, they make up your net operating income
Formula → Other Income - Other Expense
Net Income
Here comes the grand daddy profitability metric
This shows you your total income - your total expenses
it can be shown before tax, or after tax
and this feeds into your retained earnings (more on that soon)
Here comes the grand daddy profitability metric
This shows you your total income - your total expenses
it can be shown before tax, or after tax
and this feeds into your retained earnings (more on that soon)

Statement #2: The Balance Sheet
Also referred to as the Statement of Financial Position
this shows you a SNAPSHOT of your business, and it's net worth
It is shown on a CUMULATIVE basis...
and is separated by:
Assets
Liabilities
Owners Equity
Let's dive into each 👇
Also referred to as the Statement of Financial Position
this shows you a SNAPSHOT of your business, and it's net worth
It is shown on a CUMULATIVE basis...
and is separated by:
Assets
Liabilities
Owners Equity
Let's dive into each 👇
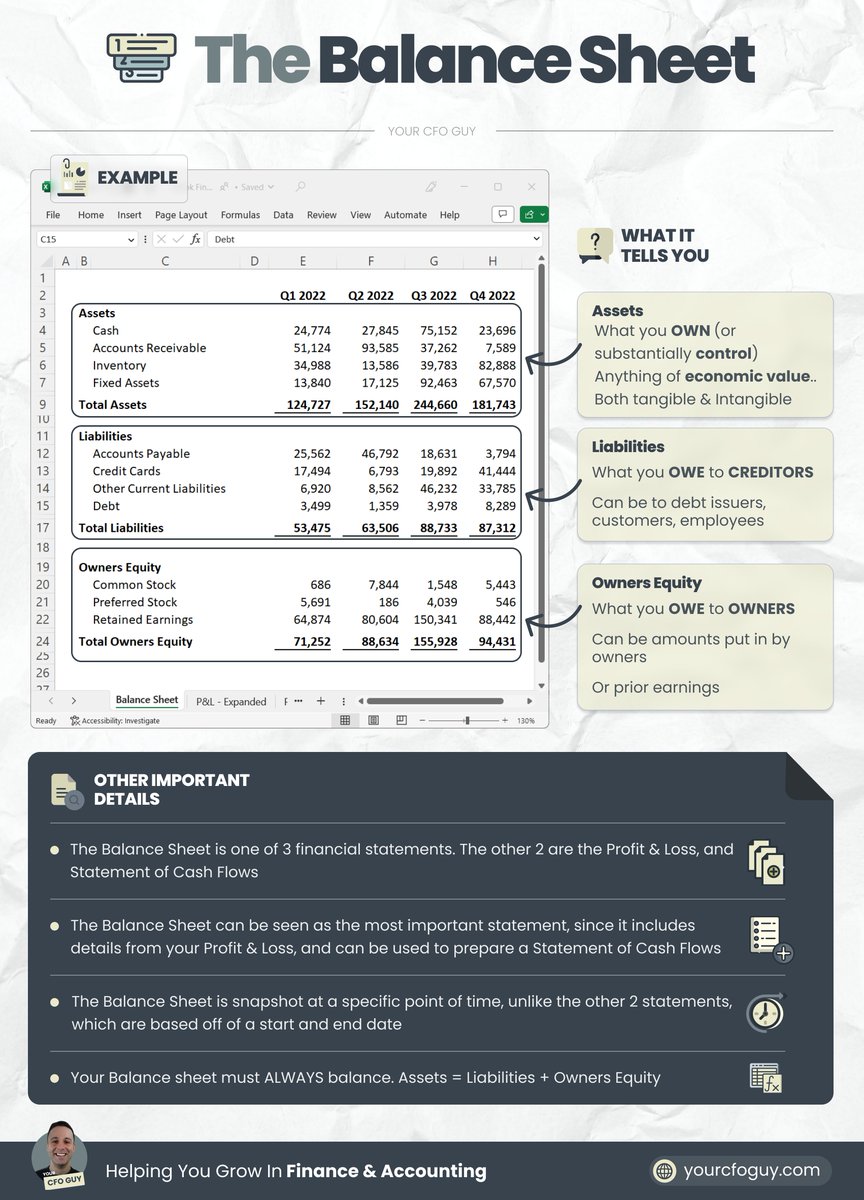
Assets
These are items of ECONOMIC VALUE (physical and intangible)
that the business OWNS
or substantially CONTROLS
These are items of ECONOMIC VALUE (physical and intangible)
that the business OWNS
or substantially CONTROLS

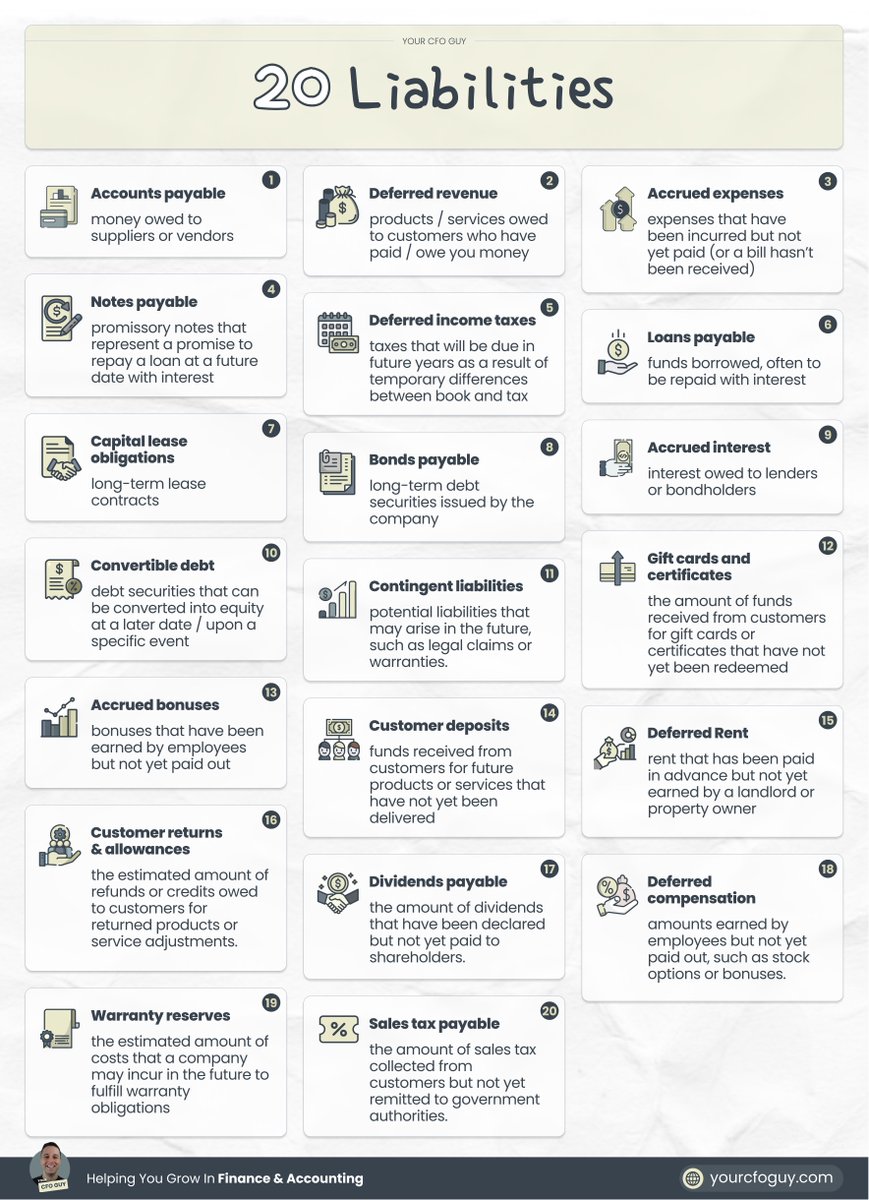
Liabilities
These are amounts owed to CREDITORS
These creditors can be:
→ vendors (IE, you purchased something)
→ customers (IE, you owe them your product / service)
→ employees (IE, payroll)
→ owners (IE, if it's a loan)
These are amounts owed to CREDITORS
These creditors can be:
→ vendors (IE, you purchased something)
→ customers (IE, you owe them your product / service)
→ employees (IE, payroll)
→ owners (IE, if it's a loan)
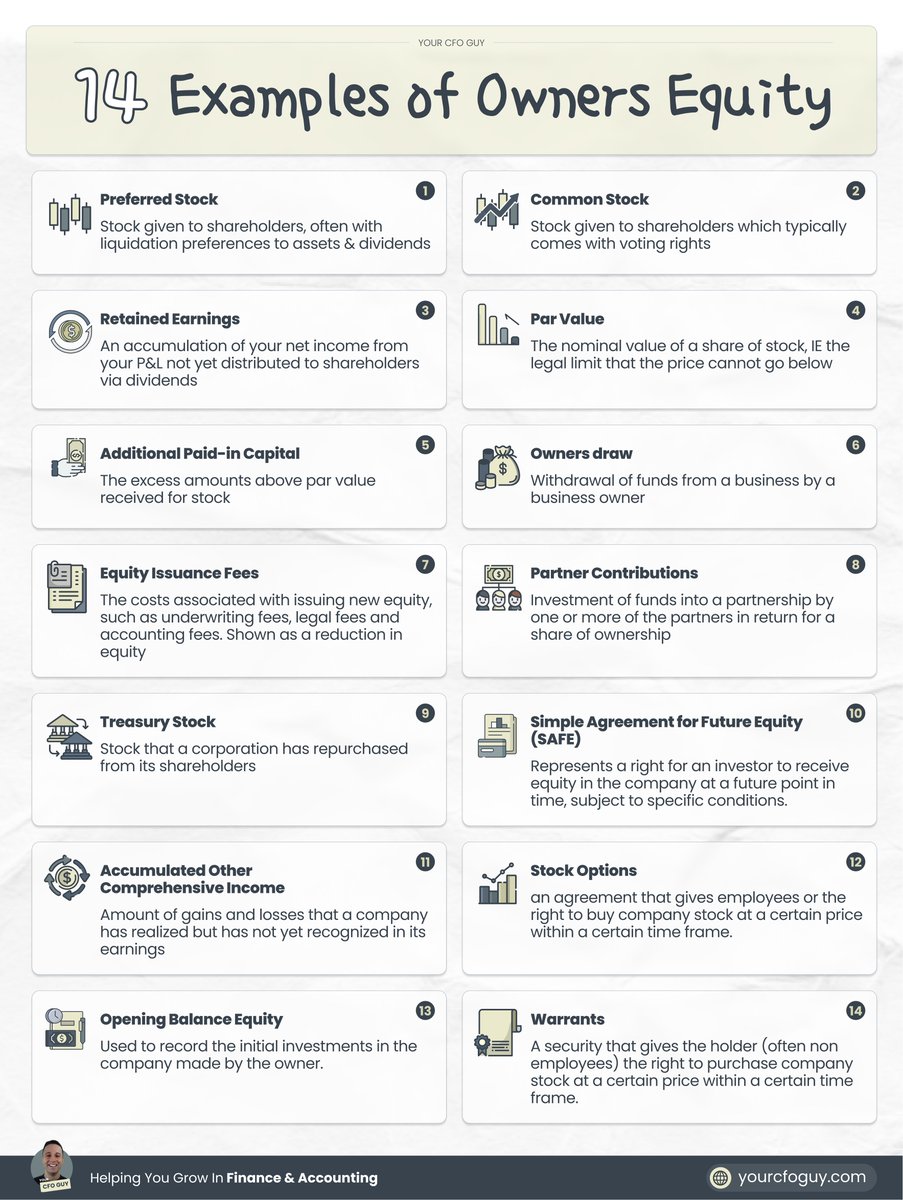
Owners Equity
The final section of the balance sheet
Shows you what you owe to the OWNERS of the business based off of:
→ amounts contributed
→ prior earnings & losses not yet distributed
the key thing is that Owners Equity is UNCAPPED....
while Liabilities are CAPPED
The final section of the balance sheet
Shows you what you owe to the OWNERS of the business based off of:
→ amounts contributed
→ prior earnings & losses not yet distributed
the key thing is that Owners Equity is UNCAPPED....
while Liabilities are CAPPED
3rd statement: Statement of Cash Flows
This statement has one purpose:
To tell you where your cash went
It can be presented based off of:
the DIRECT method
and the INDIRECT method
and is split between cash from:
OPERATING activities
INVESTING activities
FINANCE activities
This statement has one purpose:
To tell you where your cash went
It can be presented based off of:
the DIRECT method
and the INDIRECT method
and is split between cash from:
OPERATING activities
INVESTING activities
FINANCE activities

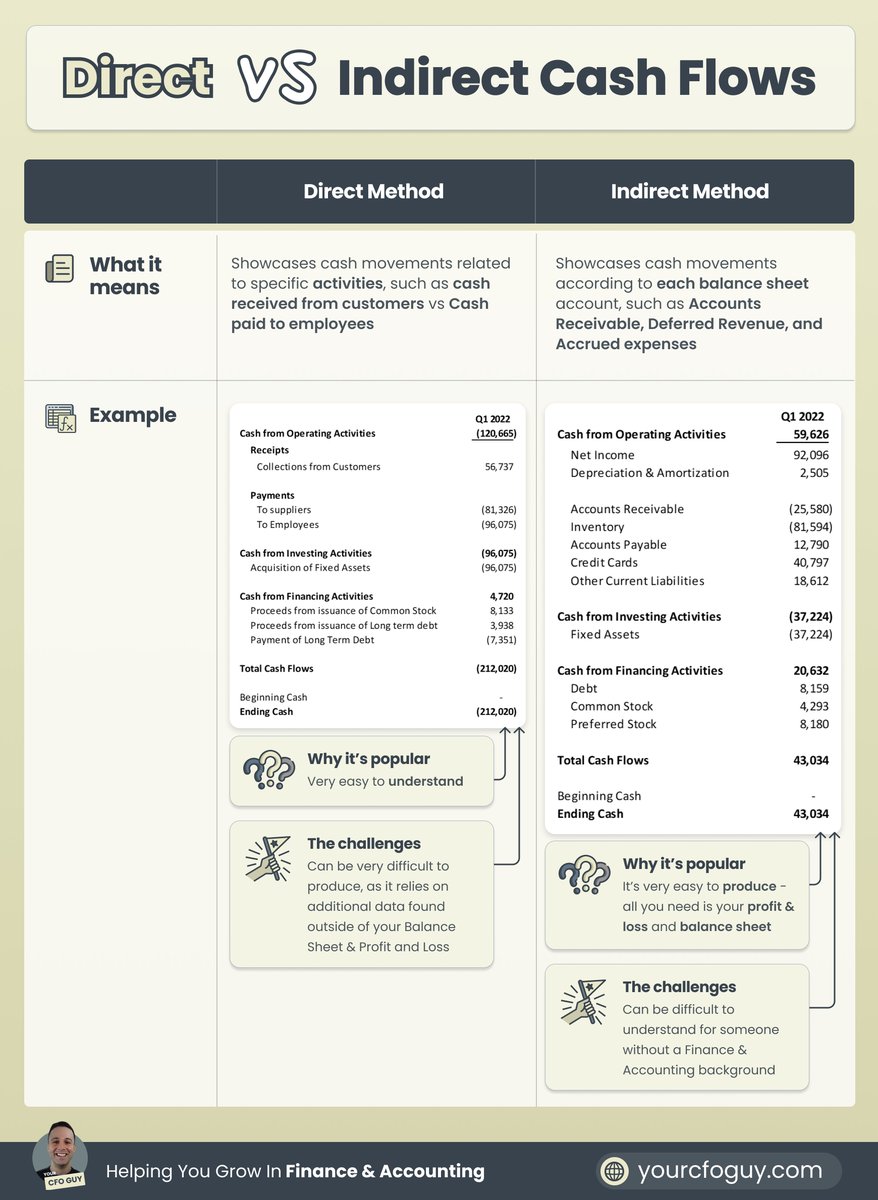
Direct method vs Indirect Method
DIRECT method → easy to understand format, but is very difficult to produce
INDIRECT method → less intuitive format, but way easier to produce
Indirect method is most commonly used, and just requires your P&L and BS to produce
DIRECT method → easy to understand format, but is very difficult to produce
INDIRECT method → less intuitive format, but way easier to produce
Indirect method is most commonly used, and just requires your P&L and BS to produce
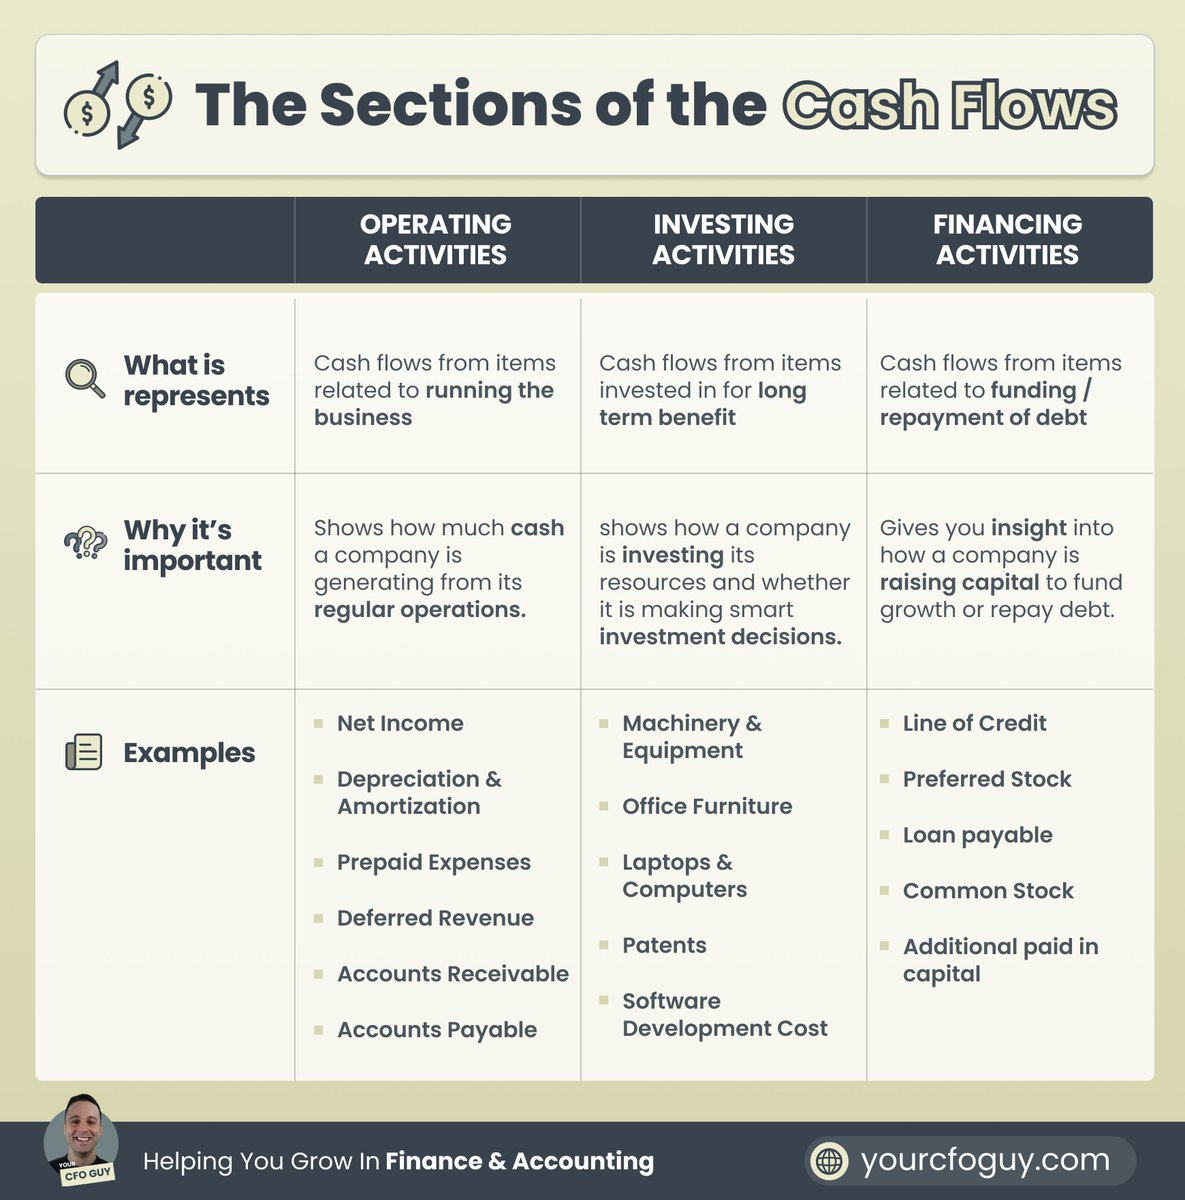
Sections of the Statement of Cash Flows
Operating → cash movements related to operating your business
Investing → cash movements from assets you've invested in long term
Financing → cash movements from debt or fundraises
Operating → cash movements related to operating your business
Investing → cash movements from assets you've invested in long term
Financing → cash movements from debt or fundraises
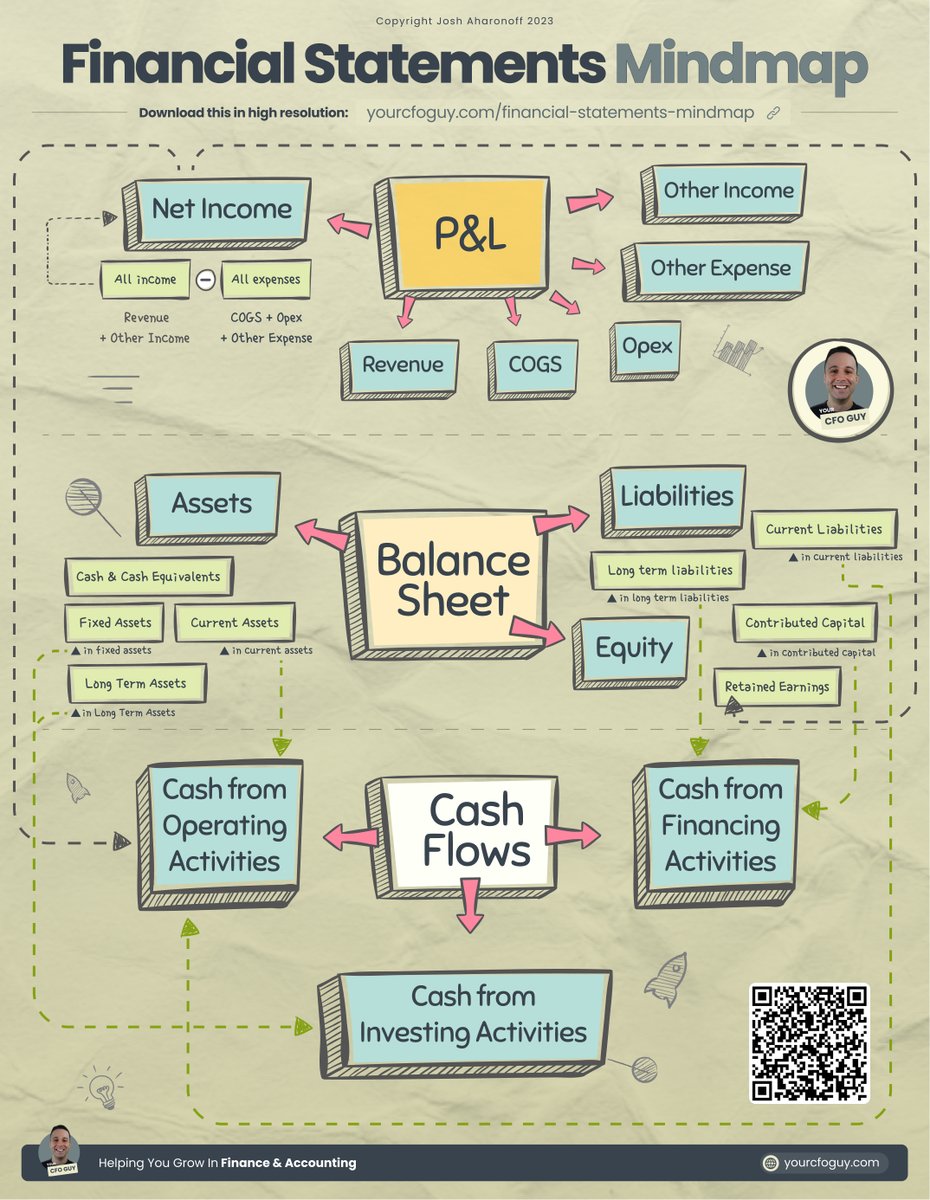
How all 3 statements are connected
The Balance Sheet PULLS from the P&L
Net Income from P&L → goes to Retained Earnings on Balance Sheet
There are also a number of shared journal entries...
such as depreciation / accumulated depreciation (more in the infographic below)
The Balance Sheet PULLS from the P&L
Net Income from P&L → goes to Retained Earnings on Balance Sheet
There are also a number of shared journal entries...
such as depreciation / accumulated depreciation (more in the infographic below)

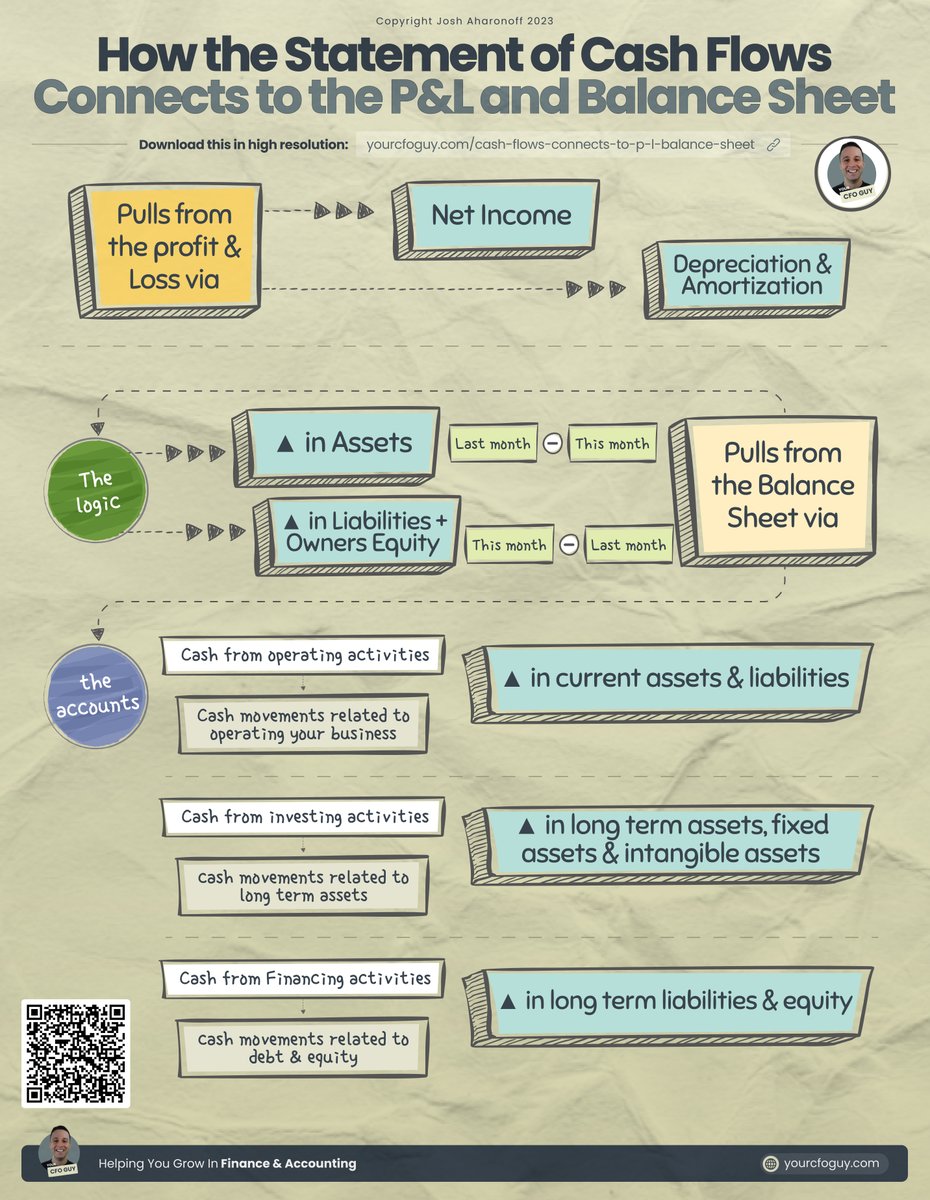
The Statement of Cash Flows PULLS from both the
Balance Sheet → all accounts other than cash, accumulated depreciation / amortization, and retained earnings
Income Statement → Net Income, Depreciation, and Amortization
More details in the infographic below
Balance Sheet → all accounts other than cash, accumulated depreciation / amortization, and retained earnings
Income Statement → Net Income, Depreciation, and Amortization
More details in the infographic below
TL;DR
The 3 statements are the:
Profit & Loss → shows your income / expenses / net profits
Balance Sheet → shows your cumulative net worth
Statement of Cash flows → shows where your cash is going
See infographic below on how they are all connected
The 3 statements are the:
Profit & Loss → shows your income / expenses / net profits
Balance Sheet → shows your cumulative net worth
Statement of Cash flows → shows where your cash is going
See infographic below on how they are all connected
𝗔𝗻𝗱 𝘁𝗵𝗮𝘁'𝘀 𝗮 𝘄𝗿𝗮𝗽! 🚩🚩
𝗠𝗮𝗻...𝘁𝗵𝗮𝘁 𝘁𝗼𝗼𝗸 𝗮 𝗟𝗢𝗡𝗚 𝘁𝗶𝗺𝗲 𝘁𝗼 𝗽𝗿𝗼𝗱𝘂𝗰𝗲
𝗜𝗳 𝘆𝗼𝘂 𝗲𝗻𝗷𝗼𝘆𝗲𝗱 𝘁𝗵𝗶𝘀, 𝗰𝗼𝗻𝘀𝗶𝗱𝗲𝗿 j𝗼𝗶𝗻𝗶𝗻𝗴 𝗺𝘆 𝗻𝗲𝘄𝘀𝗹𝗲𝘁𝘁𝗲𝗿 yourcfoguy.com/newsletter
𝗠𝗮𝗻...𝘁𝗵𝗮𝘁 𝘁𝗼𝗼𝗸 𝗮 𝗟𝗢𝗡𝗚 𝘁𝗶𝗺𝗲 𝘁𝗼 𝗽𝗿𝗼𝗱𝘂𝗰𝗲
𝗜𝗳 𝘆𝗼𝘂 𝗲𝗻𝗷𝗼𝘆𝗲𝗱 𝘁𝗵𝗶𝘀, 𝗰𝗼𝗻𝘀𝗶𝗱𝗲𝗿 j𝗼𝗶𝗻𝗶𝗻𝗴 𝗺𝘆 𝗻𝗲𝘄𝘀𝗹𝗲𝘁𝘁𝗲𝗿 yourcfoguy.com/newsletter
• • •
Missing some Tweet in this thread? You can try to
force a refresh