I’ve traded for 6 years and tried everything:
- Penny stocks
- Smart Money Concepts
- RSI/MACD
-Supply/Demand
- ICT
This 3 step “Box” strategy beats ALL of them by a mile: 🧵
- Penny stocks
- Smart Money Concepts
- RSI/MACD
-Supply/Demand
- ICT
This 3 step “Box” strategy beats ALL of them by a mile: 🧵
Before we dive in, bookmark the tweet above so you can come back to it later 👆🏻
I'm going to show you the exact entry/stop/target plan for this strategy so you'll want to save it for the future
Ok, let's start with Step 1! 👇🏻
I'm going to show you the exact entry/stop/target plan for this strategy so you'll want to save it for the future
Ok, let's start with Step 1! 👇🏻
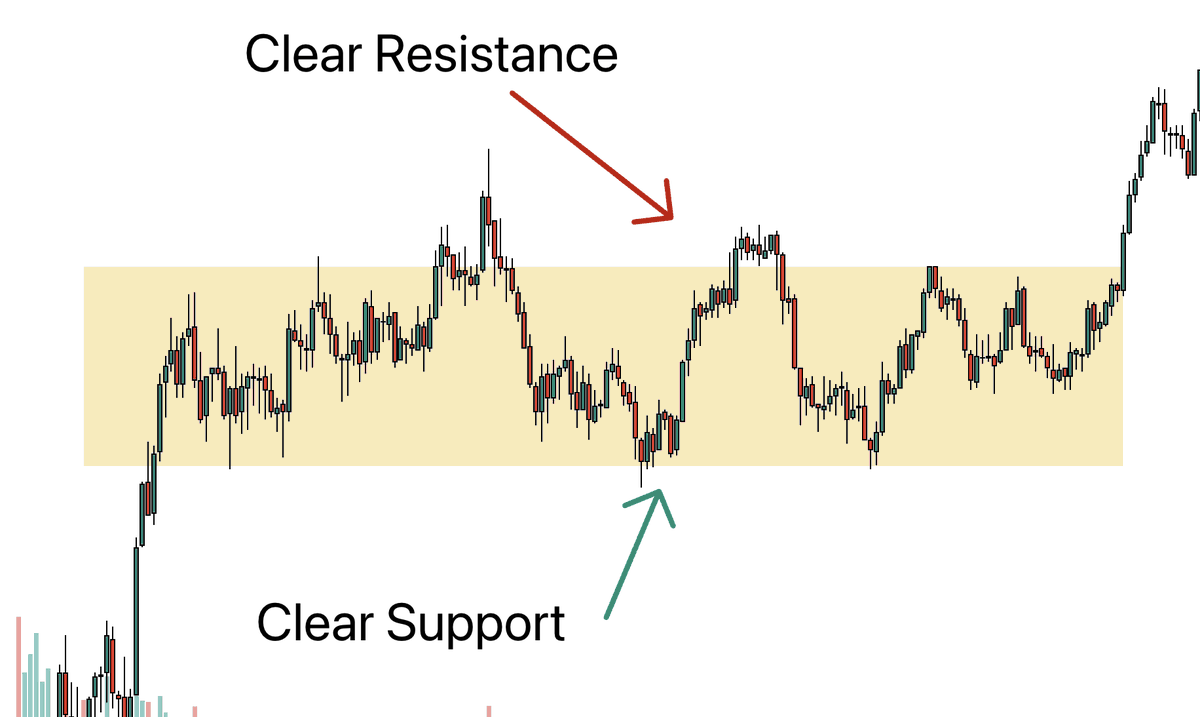
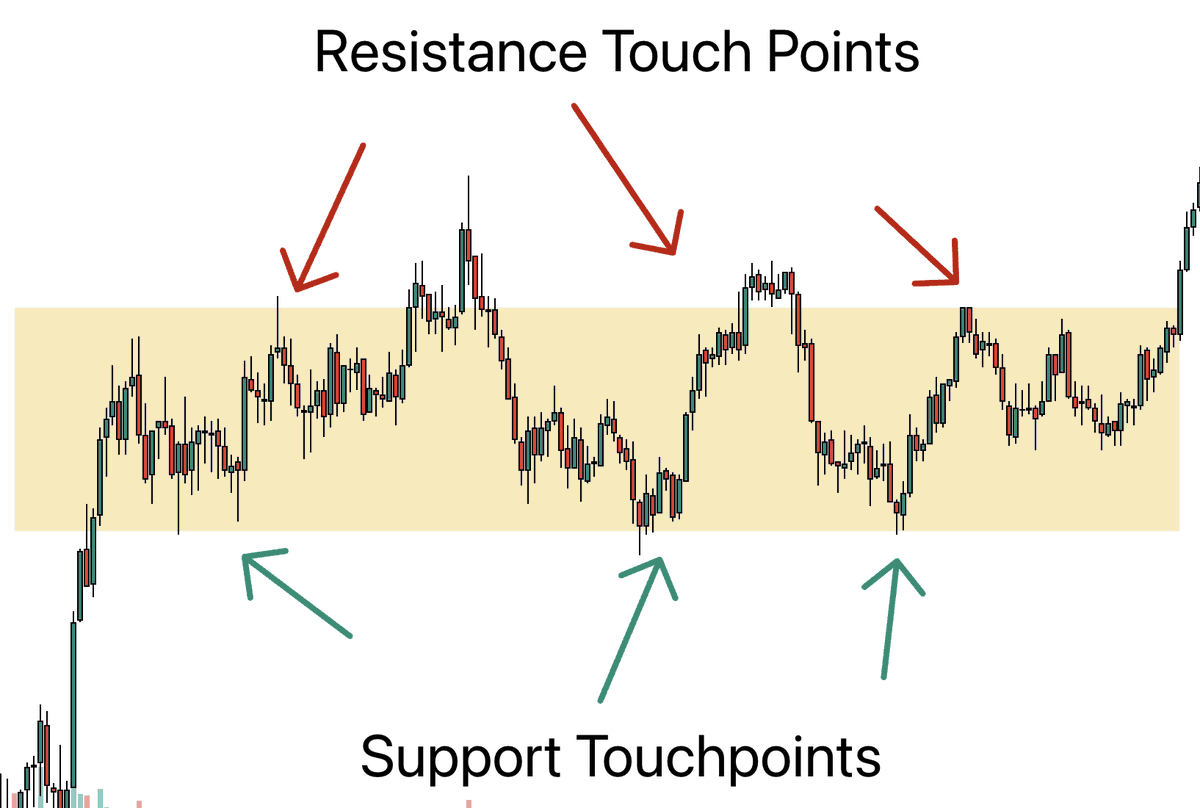
Step 1) Identify a "balance zone"
A balance zone is simply an area of price where there's a clear horizontal channel
It's easiest to spot when there's a clear support and resistance area on both sides
A balance zone is simply an area of price where there's a clear horizontal channel
It's easiest to spot when there's a clear support and resistance area on both sides
These "balance zones" usually has price action that is:
1. Choppy
2. Slow
3. All over the place
You want to draw this yellow "balance zone" by finding at least 2-3 support/resistance touch points on both sides and use them as the edges of your box
1. Choppy
2. Slow
3. All over the place
You want to draw this yellow "balance zone" by finding at least 2-3 support/resistance touch points on both sides and use them as the edges of your box
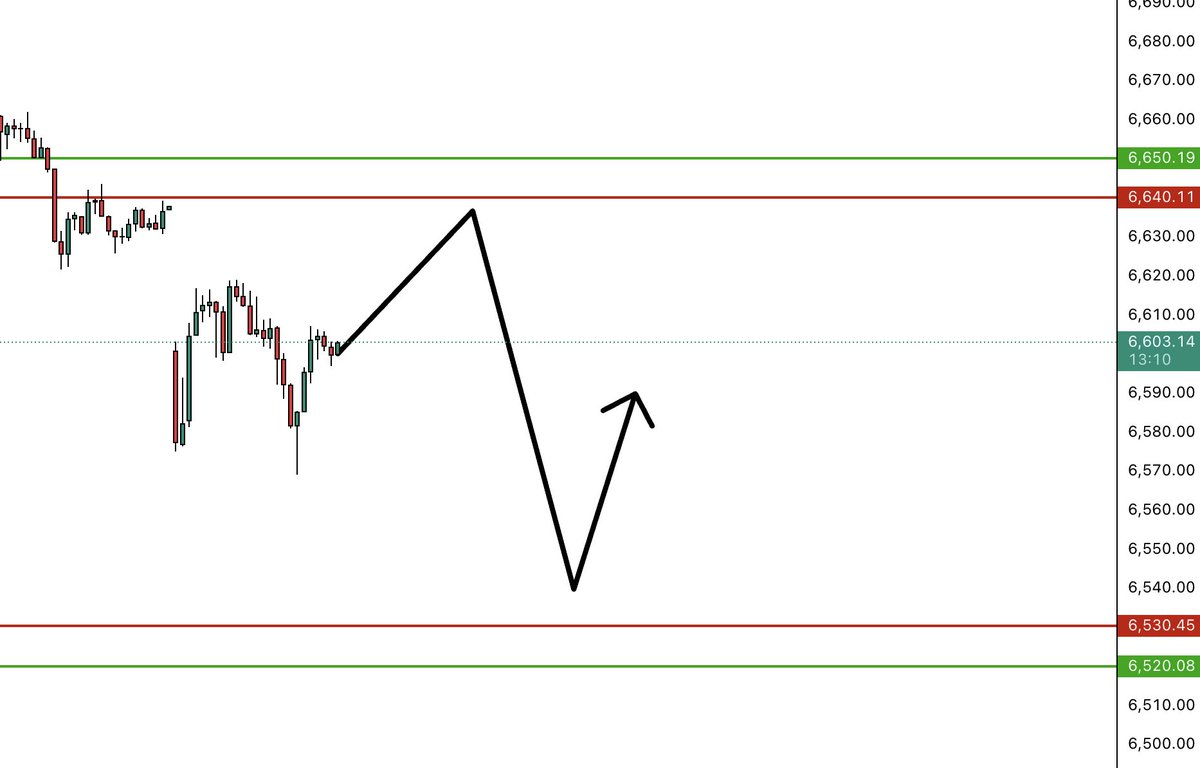
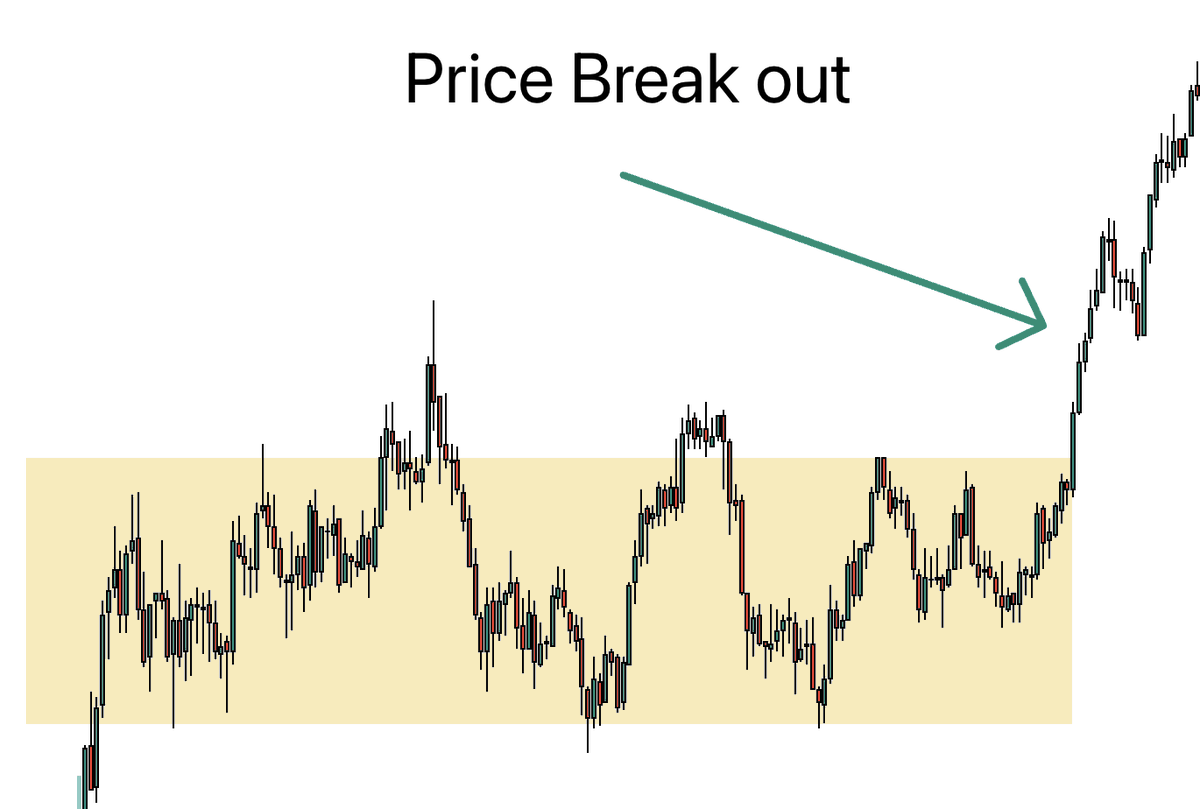
Step 2) Wait for price to make this pattern
After a balance zone forms, price will try and break out on either side
This is where only 2 things can happen
1. Price will breakout and continue pushing
2. Price will false breakout and reverse
After a balance zone forms, price will try and break out on either side
This is where only 2 things can happen
1. Price will breakout and continue pushing
2. Price will false breakout and reverse
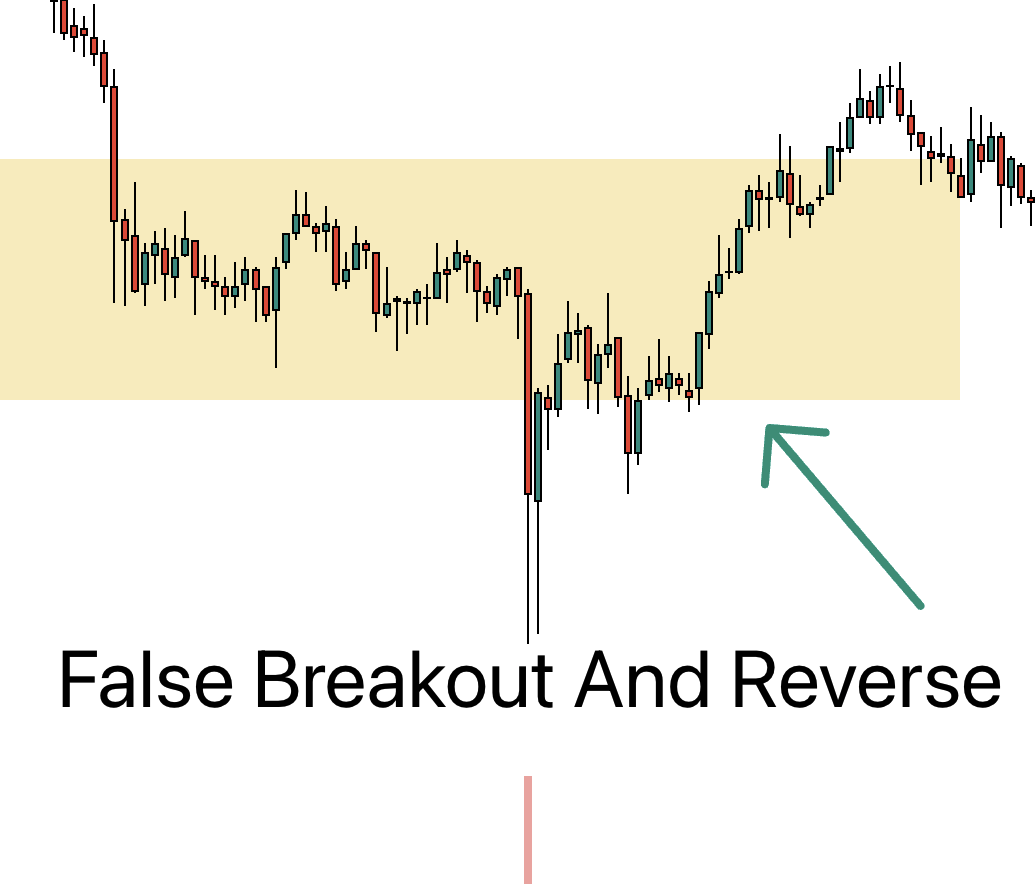
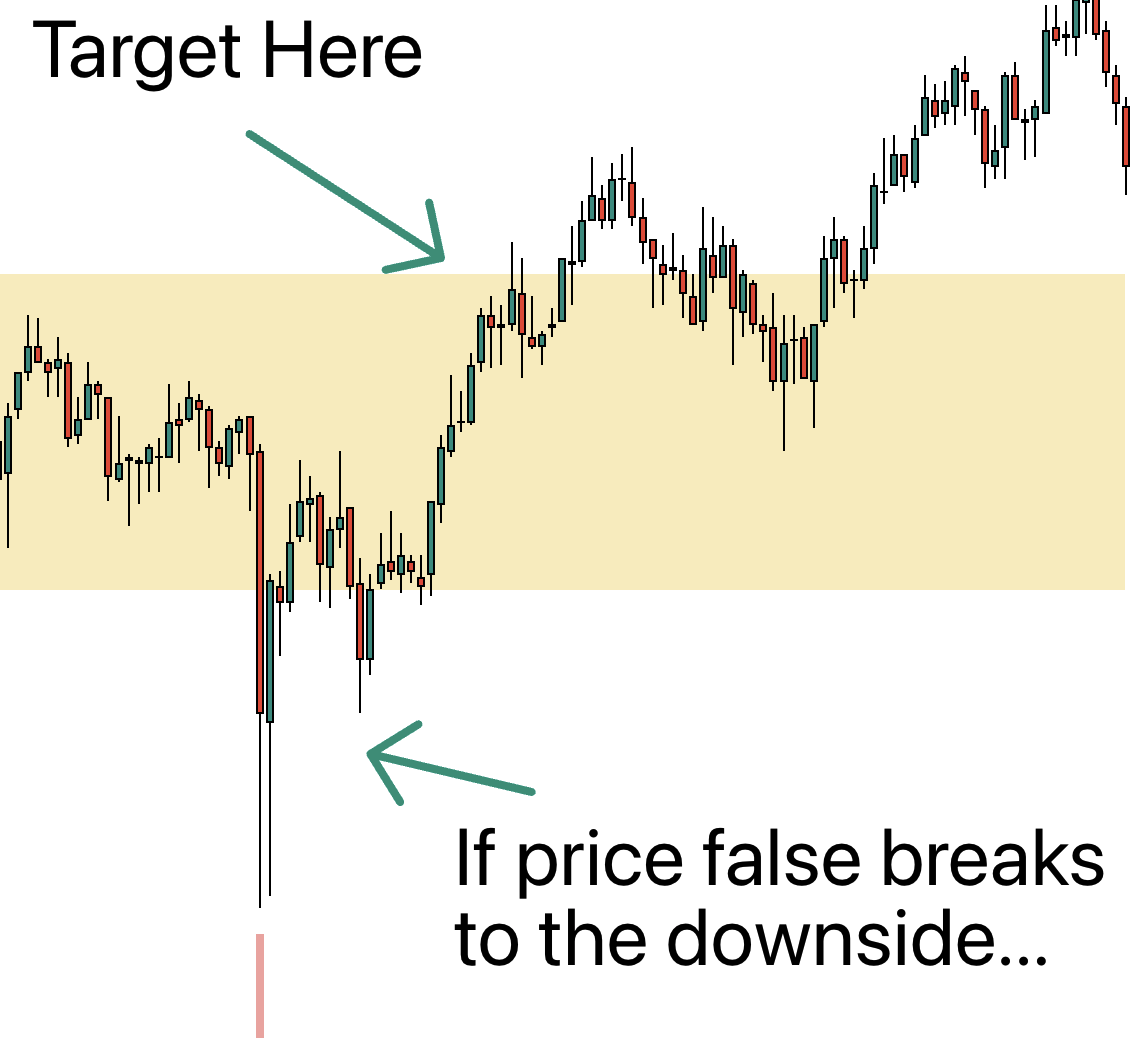
The pattern we are looking for is the "False Breakout" or also known as a "stop hunt"
After you see this pattern form, you'll be ready for step 3
But first, I need to share the 2 confirmations I look for to determine a false breakout 👇🏻
After you see this pattern form, you'll be ready for step 3
But first, I need to share the 2 confirmations I look for to determine a false breakout 👇🏻
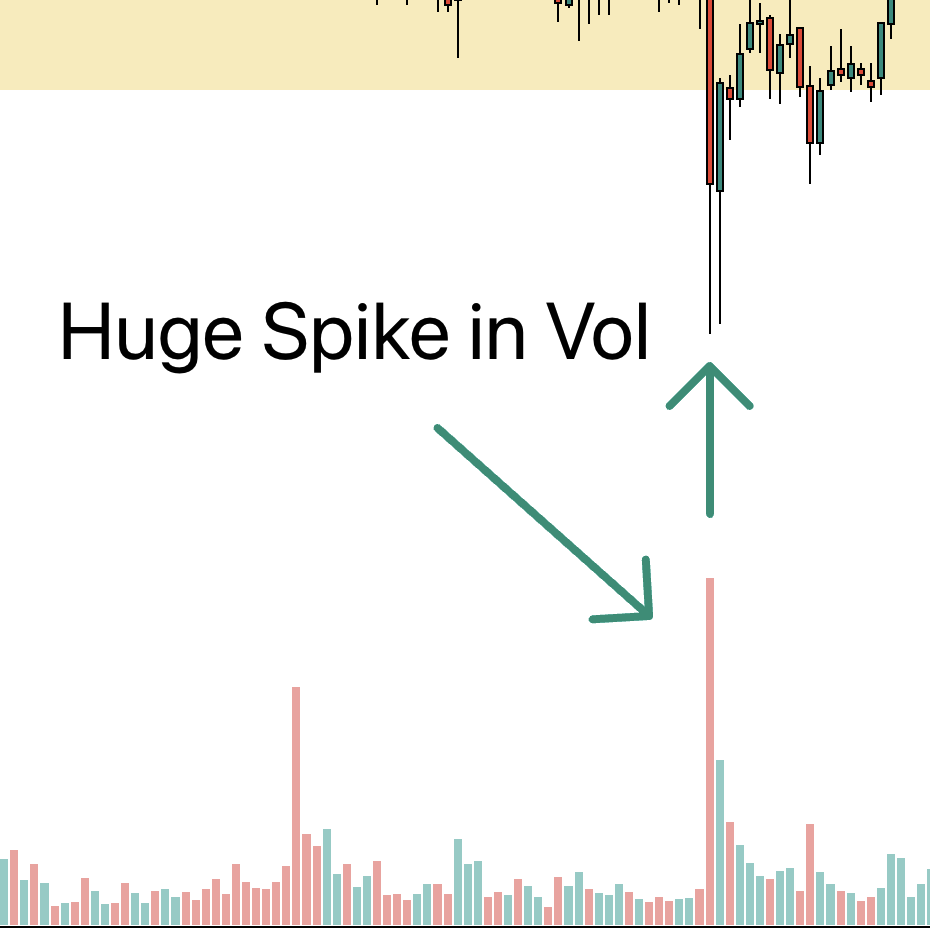
1. Volume
The first way to know is that when price breaks out, you'll see an increase in volume
You can see in the picture below relative to all the other volume, there was a huge spike when price tried to break out of the box
The first way to know is that when price breaks out, you'll see an increase in volume
You can see in the picture below relative to all the other volume, there was a huge spike when price tried to break out of the box
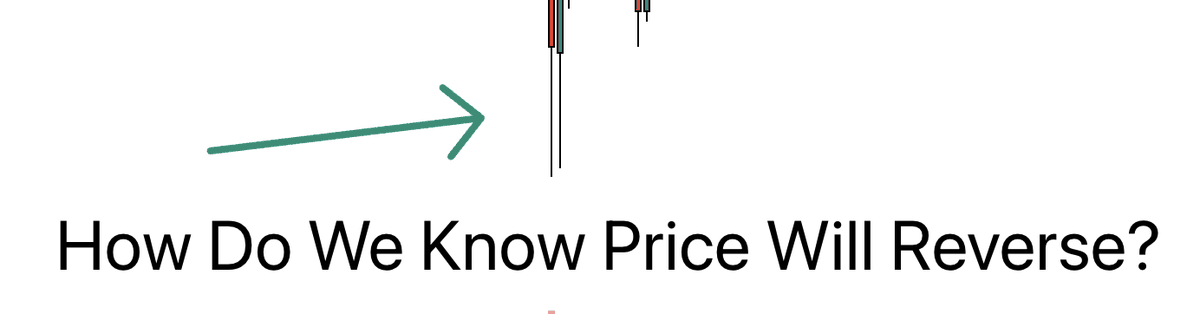
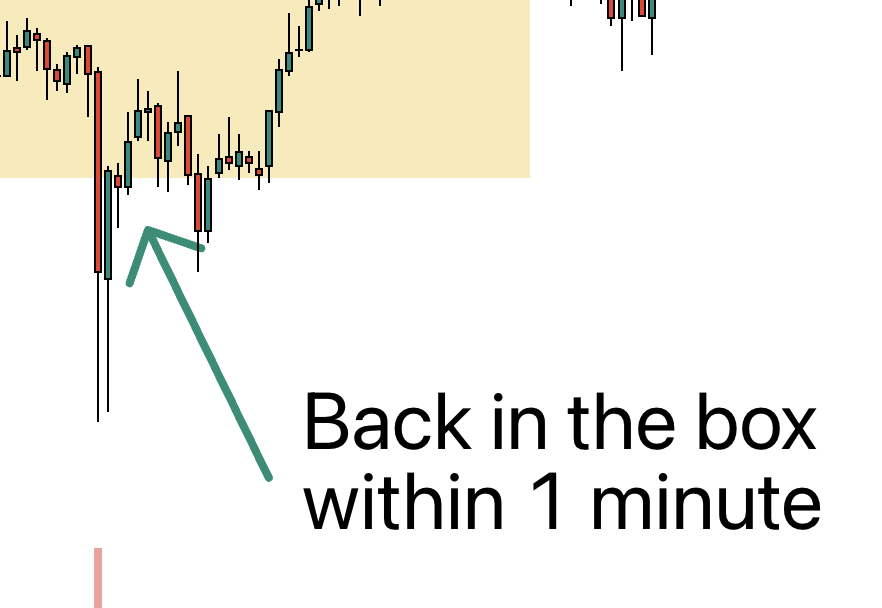
2. Speed
The best false breakouts reverse QUICKLY and almost instantly
You don't want to see price consolidate after a break out
You want to see it come outside the box, then immediately back inside (timeframe dependent)
The best false breakouts reverse QUICKLY and almost instantly
You don't want to see price consolidate after a break out
You want to see it come outside the box, then immediately back inside (timeframe dependent)
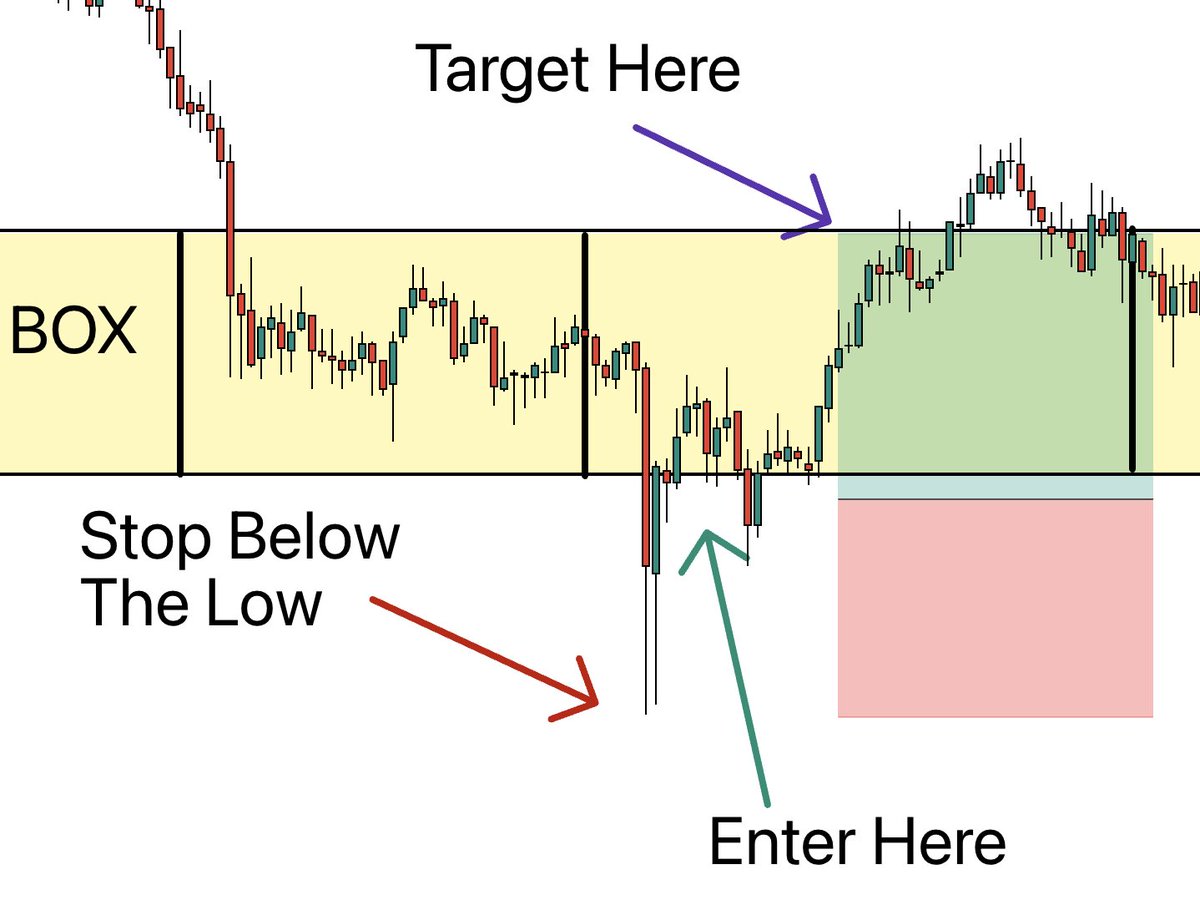
Step 3) Execute The Trade
After you've identified a balance zone AND have seen price false break from it, you can now get into the trade
Before getting into entries and stops, I first look at my Target
My Target is ALWAYS the other side of the box
After you've identified a balance zone AND have seen price false break from it, you can now get into the trade
Before getting into entries and stops, I first look at my Target
My Target is ALWAYS the other side of the box
Your entry is going to be when price gets back inside the box
Your stop loss will be at the low/high of the false breakout
So your trade plan will look something like this 👇🏻
Your stop loss will be at the low/high of the false breakout
So your trade plan will look something like this 👇🏻
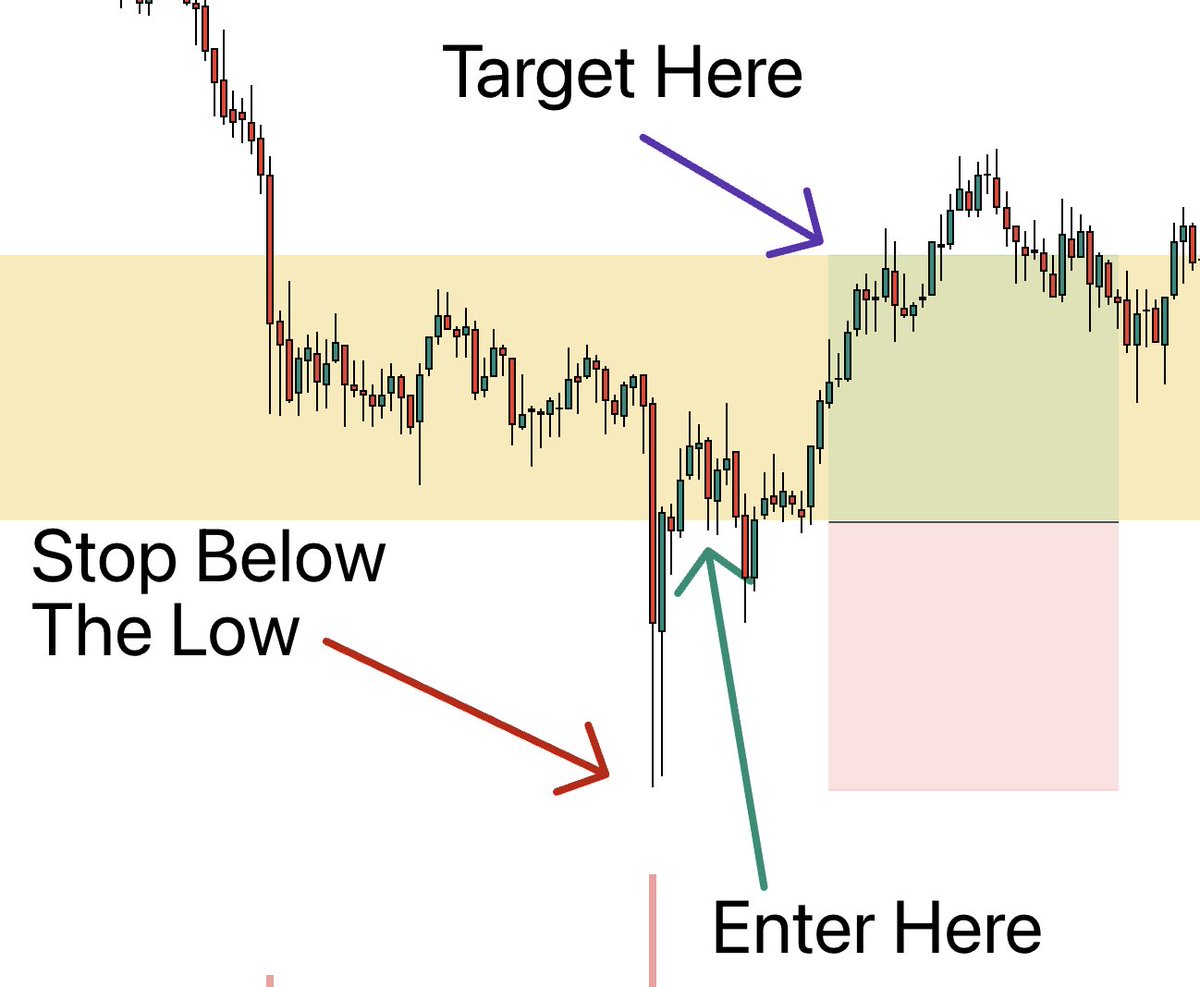
This specific example only ended up being a 1:1 R/R
But most of the time, you can find good setups with a 1:2 or 1:3 risk/reward trades
This strategy works on ALL timeframes but you MUST have a good understanding of price action for this to work
Which is why...
But most of the time, you can find good setups with a 1:2 or 1:3 risk/reward trades
This strategy works on ALL timeframes but you MUST have a good understanding of price action for this to work
Which is why...
I am inviting you to my FREE community called The Vault
Where I'll teach you how to trade profitably with:
- 5+ Price Action Courses
- Live trading each week from a 6 figure trader
- 4,000+ Trading Community
- Scanners/Tools I personally Use
Join now 👇🏻
freedomteamtrade.com/vault?sl=threa…
Where I'll teach you how to trade profitably with:
- 5+ Price Action Courses
- Live trading each week from a 6 figure trader
- 4,000+ Trading Community
- Scanners/Tools I personally Use
Join now 👇🏻
freedomteamtrade.com/vault?sl=threa…

Hope you found this helpful!
Follow me @FT__Trading for more threads on trading insights from a full-time trader
Comment below what other kinds of threads you want!
Follow me @FT__Trading for more threads on trading insights from a full-time trader
Comment below what other kinds of threads you want!
https://twitter.com/1022819912451059712/status/1800645314719736242
ANYONE can become consistently profitable in 8 weeks without relying on alerts or trading more than 1 hour a day
Here's how👇🏻
freedomteamtrade.com/trade?sl=twitt…
Here's how👇🏻
freedomteamtrade.com/trade?sl=twitt…
• • •
Missing some Tweet in this thread? You can try to
force a refresh