Early data can be misleading. And in MH3 we have a great case study for that.
Dimir.
On the face of it, it has a middling 54% win rate. In the middle of the pack of 6 lowest win rate archetypes. But scratch the surface and you might have a diamond in there.
1/6
Firstly, despite the decks winning only 54% of the games, individual cards do well. 8 commons have a GiH WR >59%.
Pairs with similar WR don’t reach this level. UG has 5 such commons. BR - 2. UR, BG and WB only 1. That is a significant difference.
2/6
And some of those commons have impressive win rates. Deem Inferior is at 62.5% , Sneaky Snacker, Accursed Marauder and Serum Visionary are over 60%. Those are solid numbers for cards that go late in draft. Kind of numbers that suggest a well drafted UB deck is competitive.
3/6
And the uncommons also deliver. Depth Defiler and Marionette Apprentice clock at >62% and some late going uncommons like Mindless Conscription and Brainsurge Do well over 58% too.
And yet win rate is low. Why is it so?
4/6
The most likely explanation? Bad builds dominate the data. And they cover archetype win rate. But bad builds don’t have the right cards in them, so individual card win rates shine. 5/6
Dimir shows promise and also shows us that looking at the color pair win rates can potentially be misleading - yet again turns out context is key.
UB won’t be the top archetype but data suggests it is much further from the bottom than data suggests if you know what you’re doing.
• • •
Missing some Tweet in this thread? You can try to
force a refresh
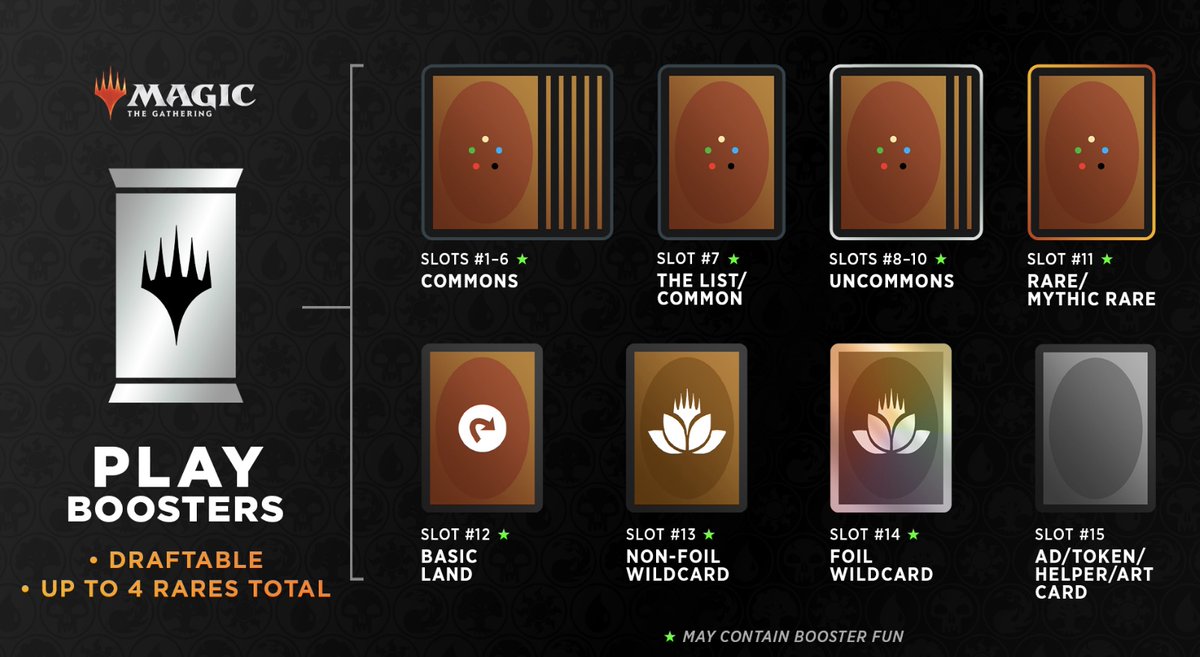
WotC announced a new type of product that will combine Set Boosters and Draft Boosters. We don't have 100% info, but there is a significant chunk we do know. How will the new product impact draft? Not by much at first sight. 1/12
Firstly, WotC focused on the fact that you could potentially open up to 4 rares in a pack. Yes, theoretically it is true. But realistically - it probably is a once several boxes experience. To look at it, we need to see what would need to happen. 2/12
One rare/mythic slot is a given. You also have the common/list slot. It is a regular common 87.5% of the time - 7 times per 8 packs. So on average in 3 packs per draft you will open something else. But even in those cases, you will still open mostly commons.
Main complaint about data in Magic are absolute opinions. "This card is busted because it has a high wr". You hear such arguments all the time. Using data as a hammer to quench any discussion annoys me too. This thread aims to look at win rate with a bit more subtlety. 1/19
First - let's rethink what a win rate is. In its simplified view it will frequently look like this: Titanic Growth has a good Game in Hand Win Rate in RG decks. It is the 4th best common in those decks so I guess it is just a good RG card. 2/19
This simplified view will sometimes be true. Some cards are just good and you should always play them. But sometimes it is not. And that is where the problems start arising. In order to avoid falling into this trap, what helps me is to reimagine what win rate is. 3/19
March of the Machine is arguable a set with the most complex booster pack architecture. No dedicated rare slot, instead a double sided slot, single sided slot, Battle slot, land slot and a multiverse legend. How can this impact draft? 🧵 1/11
Thanks to the infinite kindness of @17Lands team I got some early access data to try and figure out what is the impact of the pack collation on the card frequency. Firstly let's look at how packs look like in a regular set: Simple 1 rare/mythic, 3 uncommons and 10 commons. 2/11
@17Lands But in MOM things get a bit more complicated. There are more than 1 rares/mythic per pack on average, over 4 uncommons and only 8.4 commons. And the basic land/gain land slot. Even on a small dataset I worked on that split was almost a perfect 50:50. 3/11
Often people claim to have a signature build, something others don't do in a Limited format. And often they are right. But such "special builds", sub-archetypes are notoriously hard to find using data. For many reasons. In Magic Numbers #69 I try to find such builds in ONE 🧵 1/x
First difficulty is to find those builds. But over time I developed a toolbox to do it. And weirdly, I use methods from my day job to do so.
I am a microbial ecologist, studying how microbial communities function and which species make them tick. 2/x
To do so, I need to often compare different ecosystems. And to be able to do that, I convert the list of species and their quantities in my ecosystems into numbers and plot them in 2-dimensional space.
Decks are similar to ecosystems, only instead of microbial, 3/x
If you wanted a worrying graph about ONE draft - here is one.
Most color pairs don't have commons that perform OK. I usually use a 56% GiH WR cut off to measure OK cards. In ONE 6 color pairs have <10 commons that have that WR. In BRO it was 0, DMU - 1, NEO - 2. 1/x
Yes, part of it is because some archetypes have an appalling win rate. But that is a problem in itself. Bottom 4 color pairs in this dataset are all from ONE. It would be easy to blame it on players who just didn't figure out the right builds, and in part it is probably true. 2/x
In large part imho the fault is on the side of players for getting stuck in drafting poor colors (black) and leaving red mostly uncontested. In fact when you look at top 10 commons in each color and relation of their win rate and ALSA it is a mad house. x/3
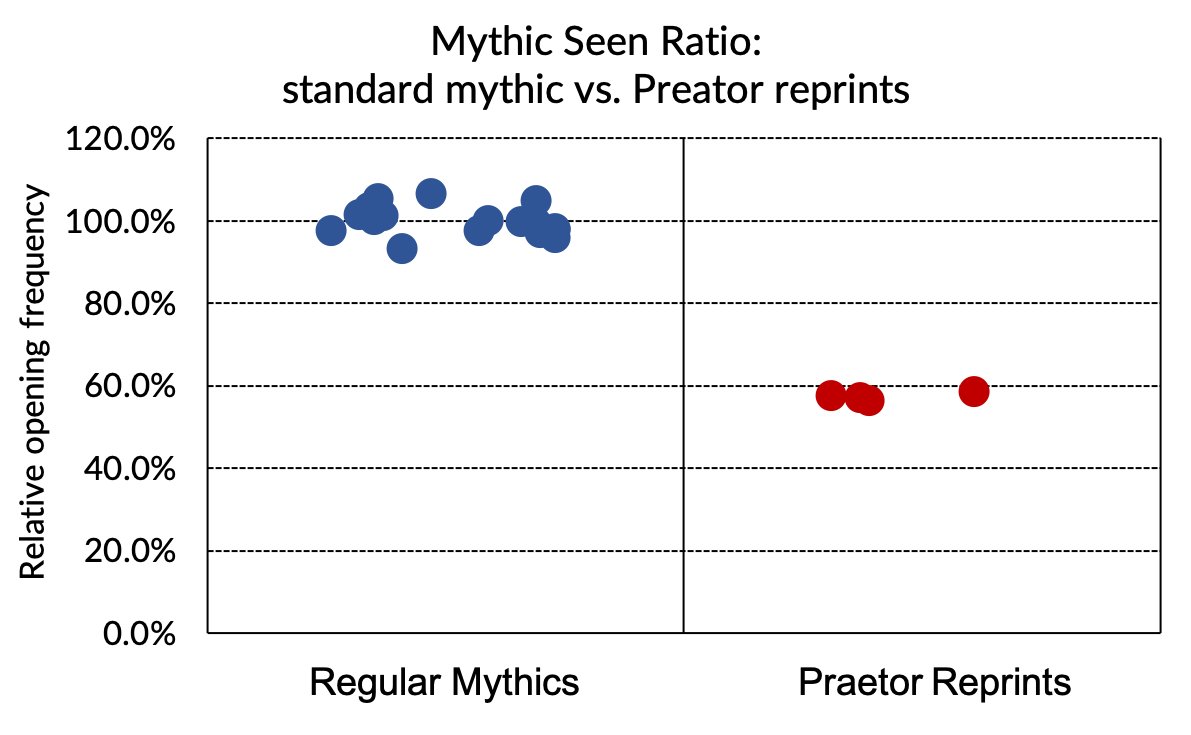
Did you ever wonder what are the odds of opening that Vorinclex in ONE pack in Arena? Well...
It is ~57.5%. There - no clickbaiting. But if you want to know how to get that number out of @17Lands - explanation in the thread.
1/x
@17Lands You need to look at the times a card has been seen in the Card performance data. Number times seen depends on number times open. But! Of course cards that go later will be seen even more. Just look at the difference between Staff of Compleation (2313) and Nissa (777) 2/x
@17Lands Luckily next to "Seen" you get the ALSA value. And also luckily - cards with high ALSA (AKA early picks) have a perfect correlation: the higher the ALSA, the more you see of a card. Because it is true, you can just divide Seen by ALSA to get a value you can easily compare. 3/x