Trapped Trader Reversals : Full Guide 🧵 
Here's what's covered:
Trapped Trader Theory.
Understanding OI with Delta.
Significance of key levels.
Traps within a candle.
Delta candle traps.
Range chart traps.
Trapped Trader Theory.
Understanding OI with Delta.
Significance of key levels.
Traps within a candle.
Delta candle traps.
Range chart traps.
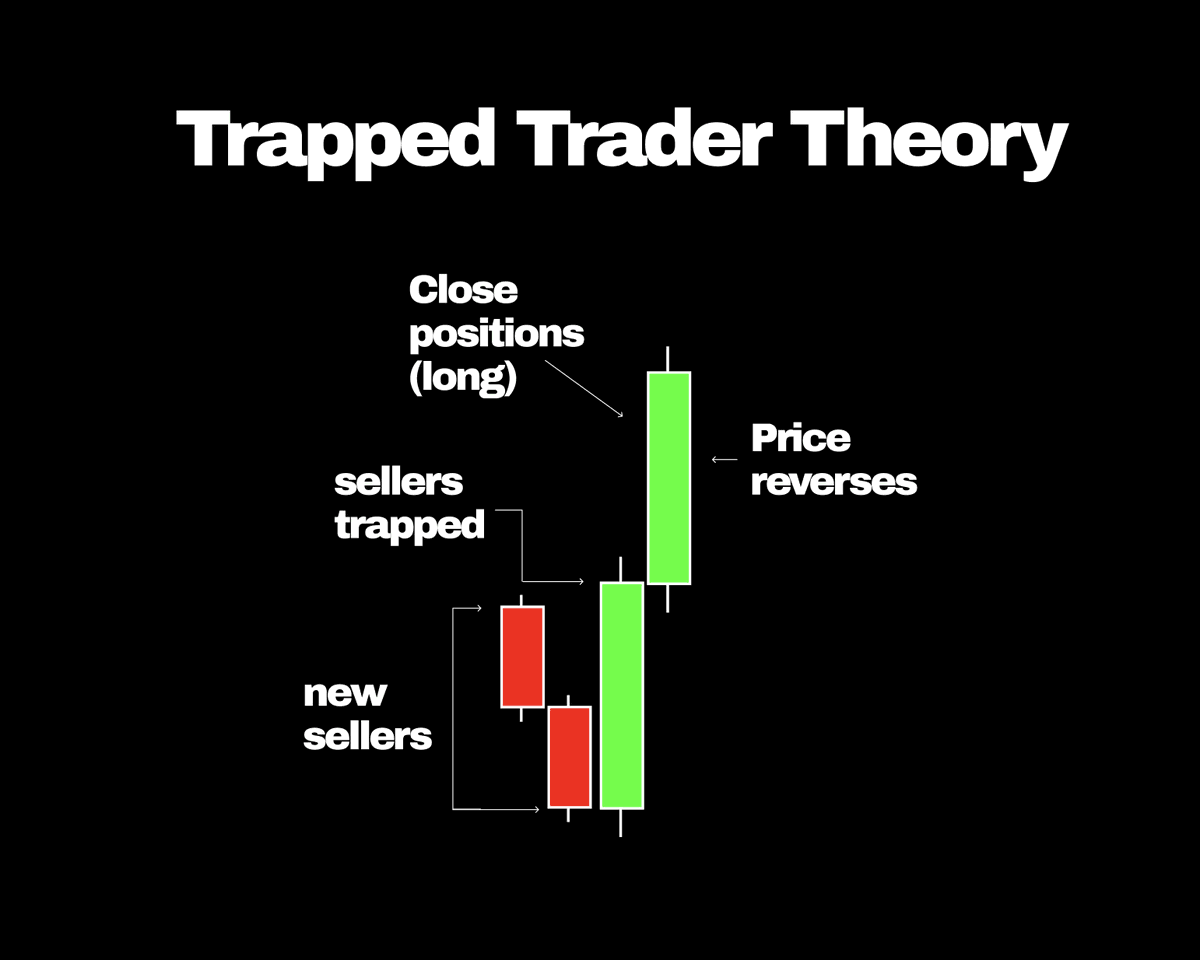
Trapped Trader Theory :
When traders become trapped (underwater and in drawdown) with their positions, they evidently look to close partial or full position size.
By doing so they reverse their positions in order to close, which fuels momentum in a reversal scenario.
When traders become trapped (underwater and in drawdown) with their positions, they evidently look to close partial or full position size.
By doing so they reverse their positions in order to close, which fuels momentum in a reversal scenario.
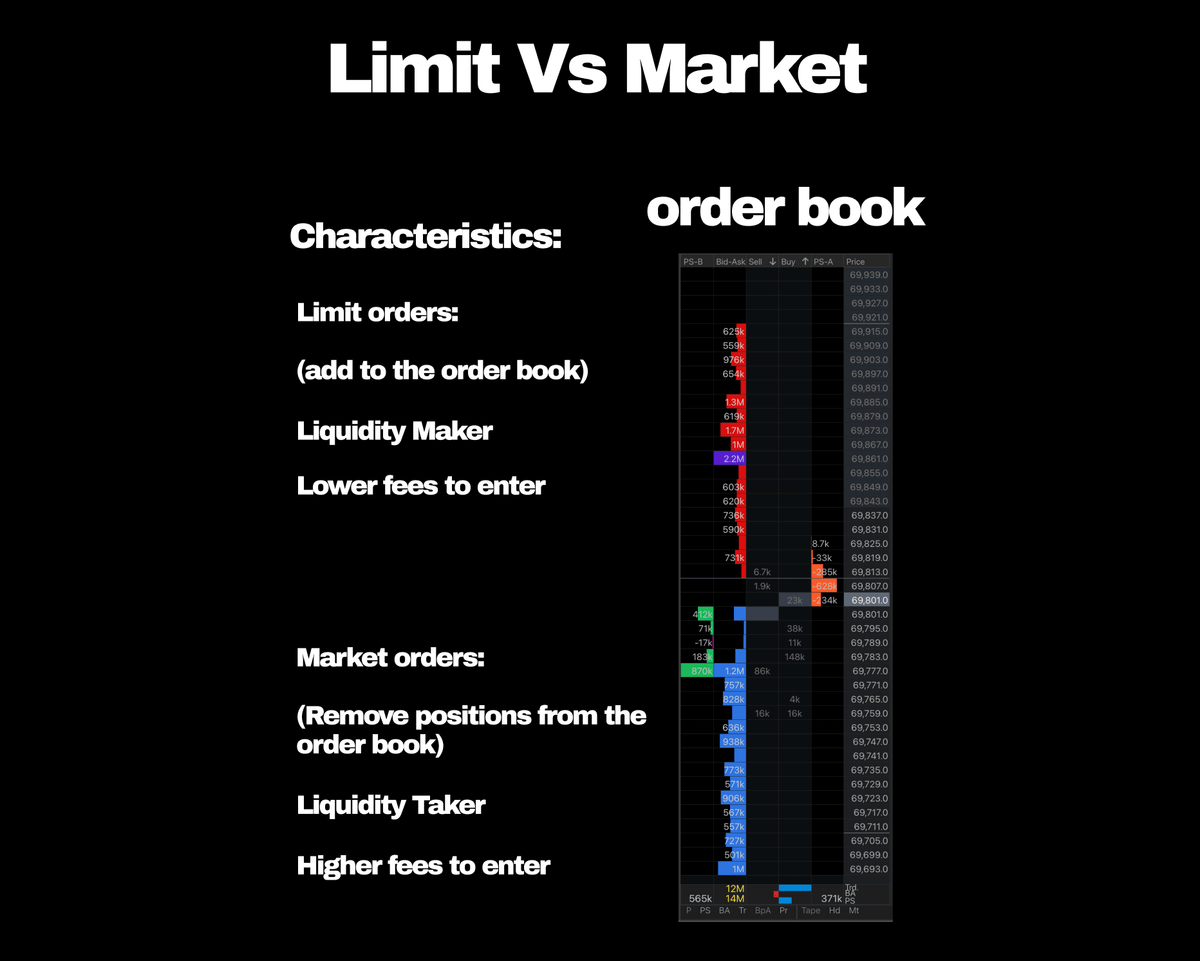
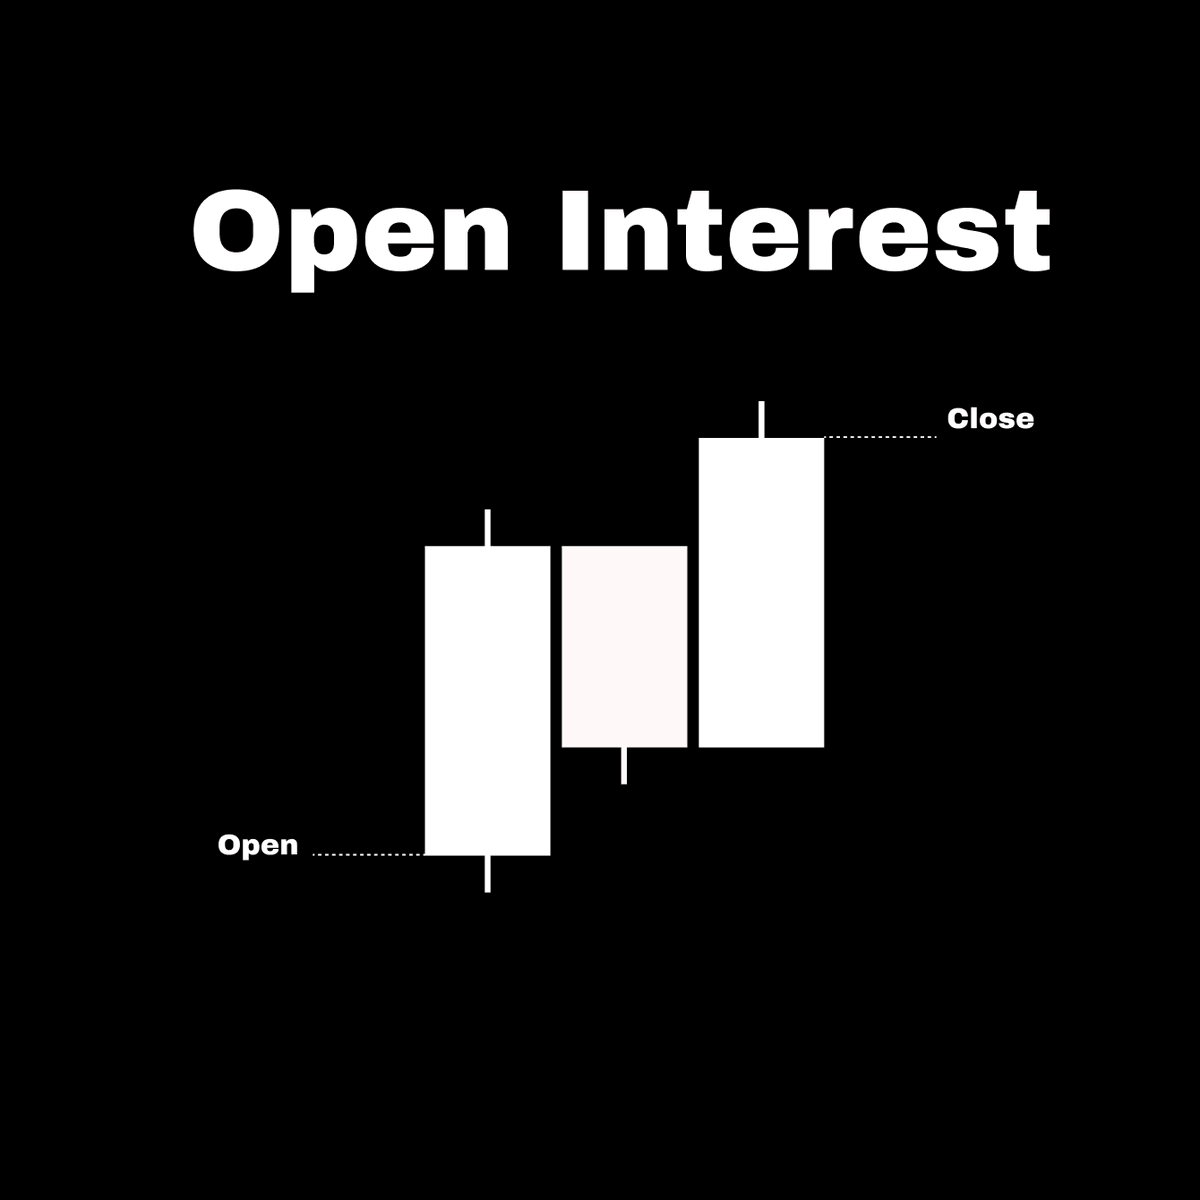
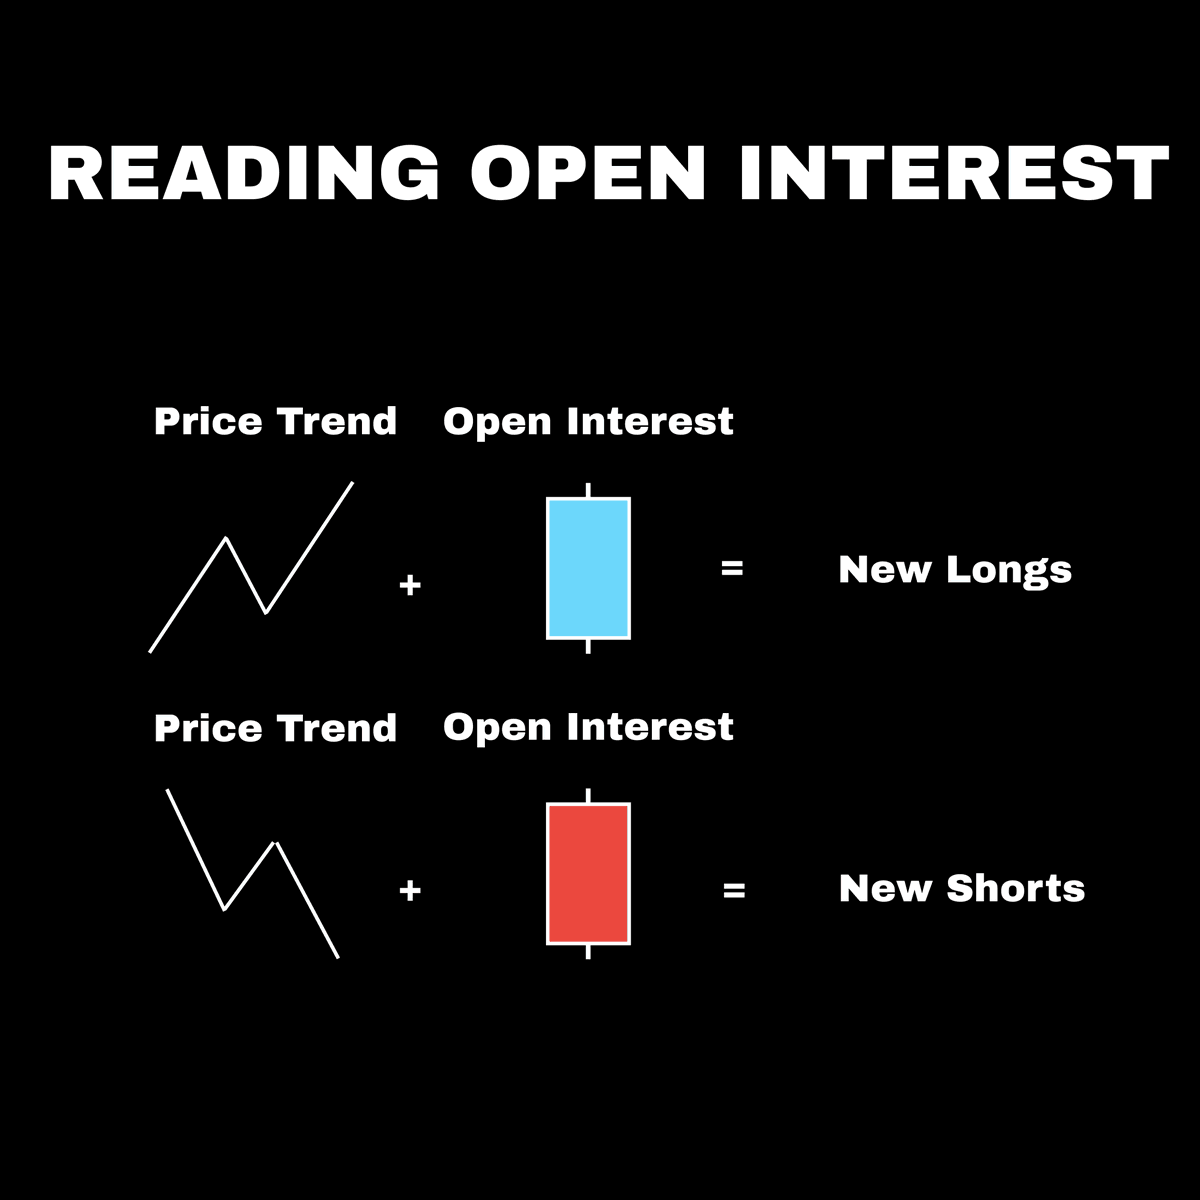
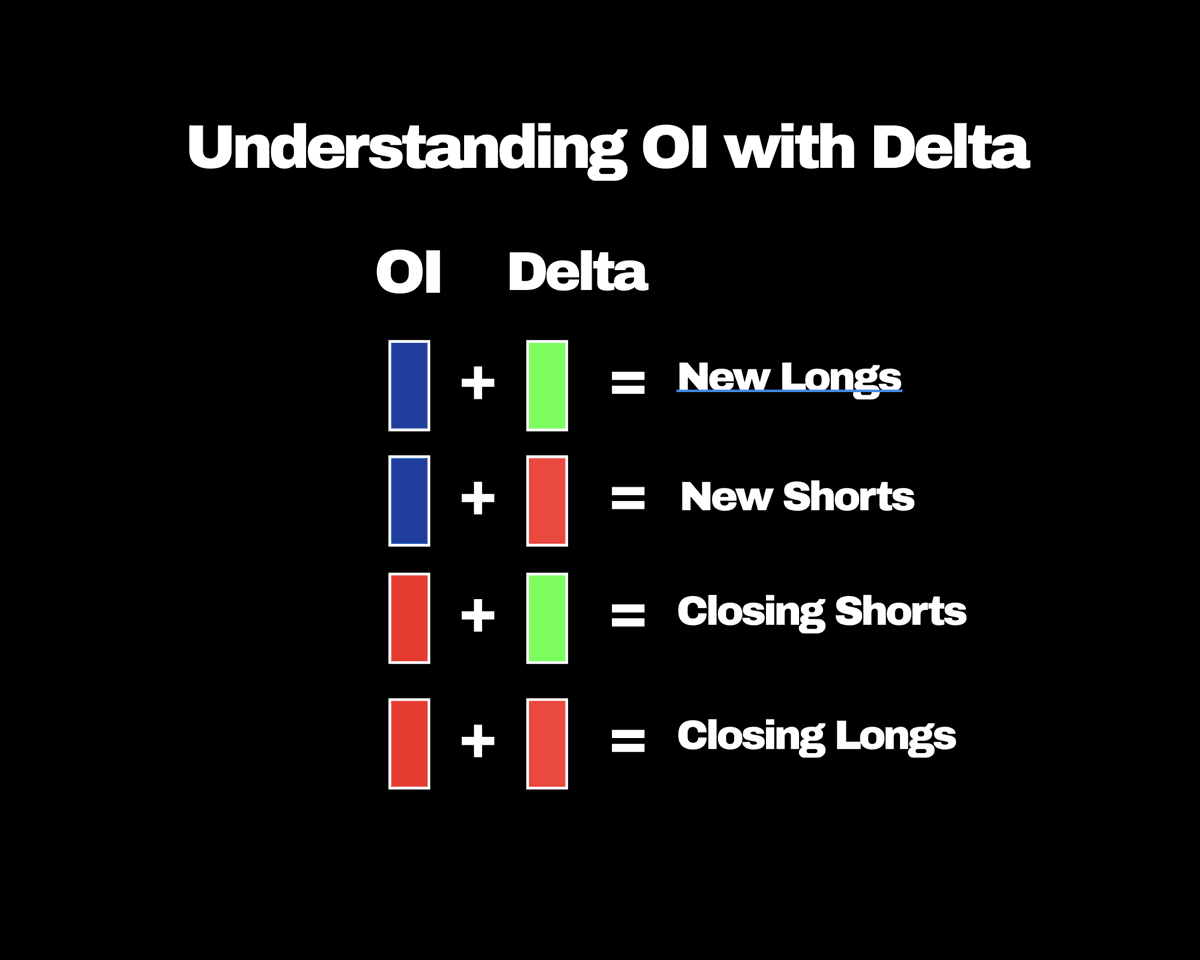
Understanding OI with Delta:
OI is the sum of opened and closed positions within a candle.
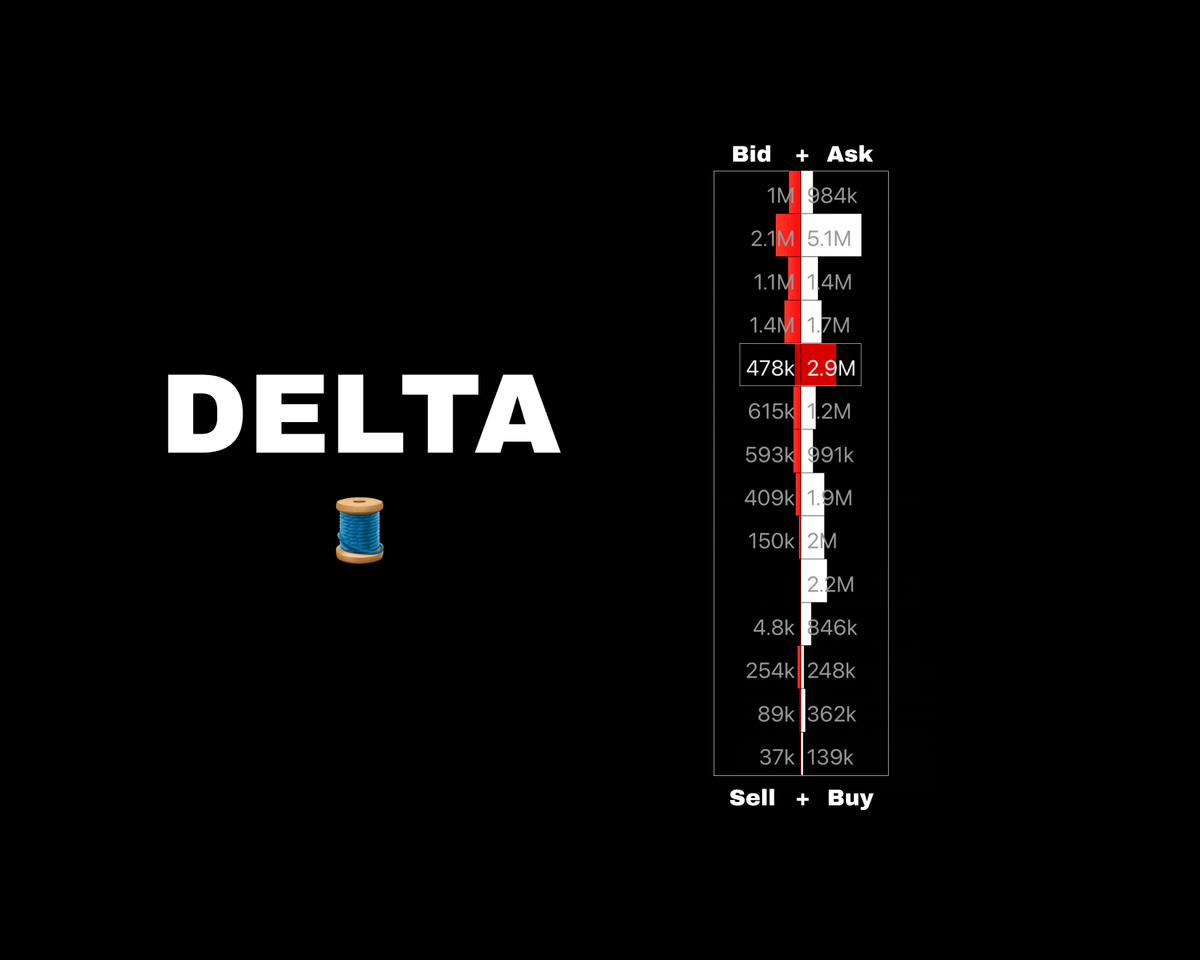
Delta is the sum of market orders in a candle.
Here's a guide to use for understanding the nature of positions and whether they're opening or closing.
OI is the sum of opened and closed positions within a candle.
Delta is the sum of market orders in a candle.
Here's a guide to use for understanding the nature of positions and whether they're opening or closing.
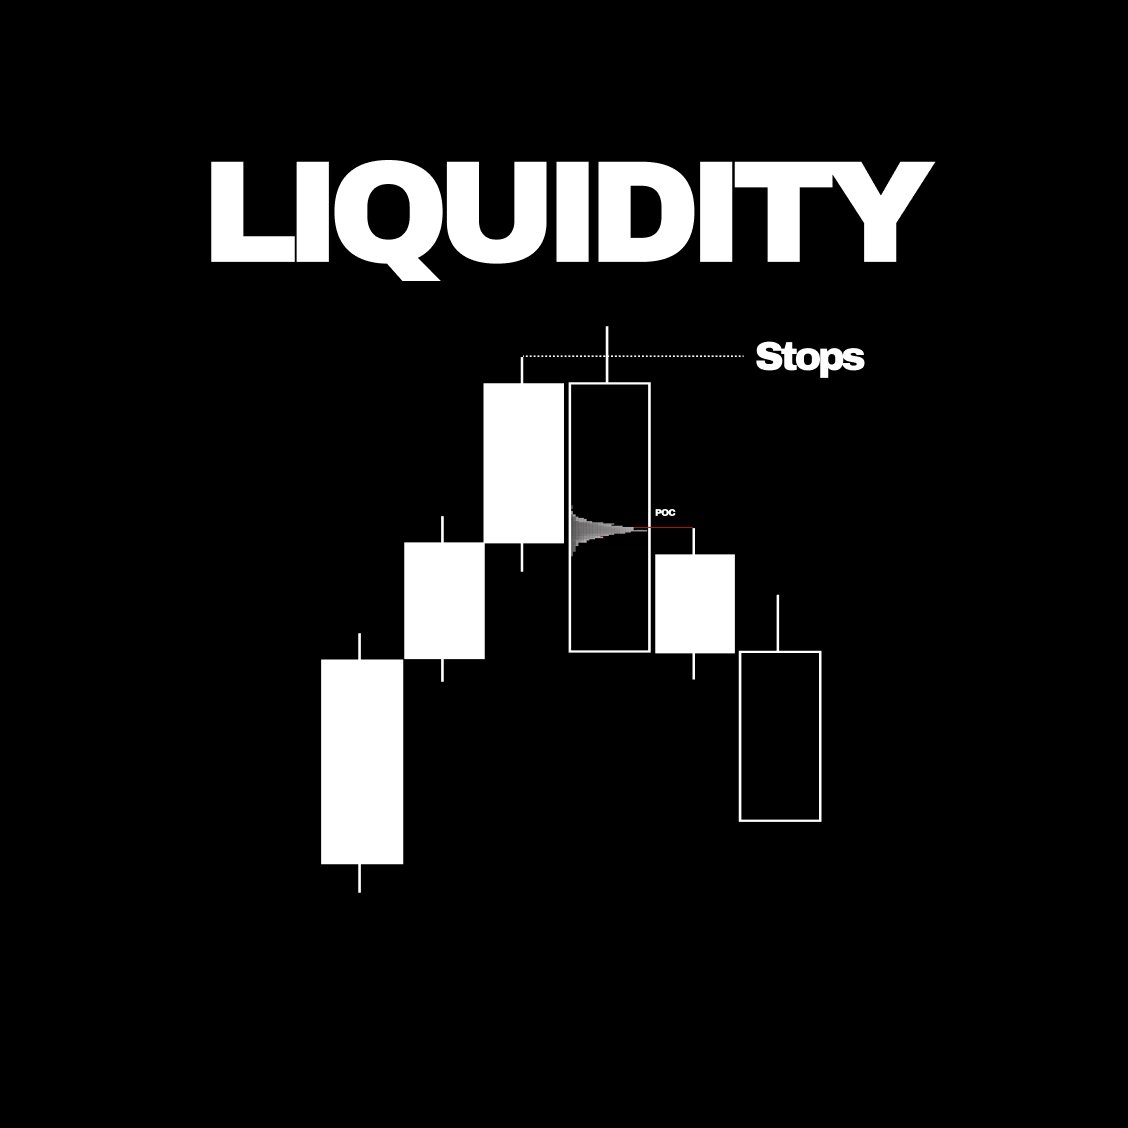
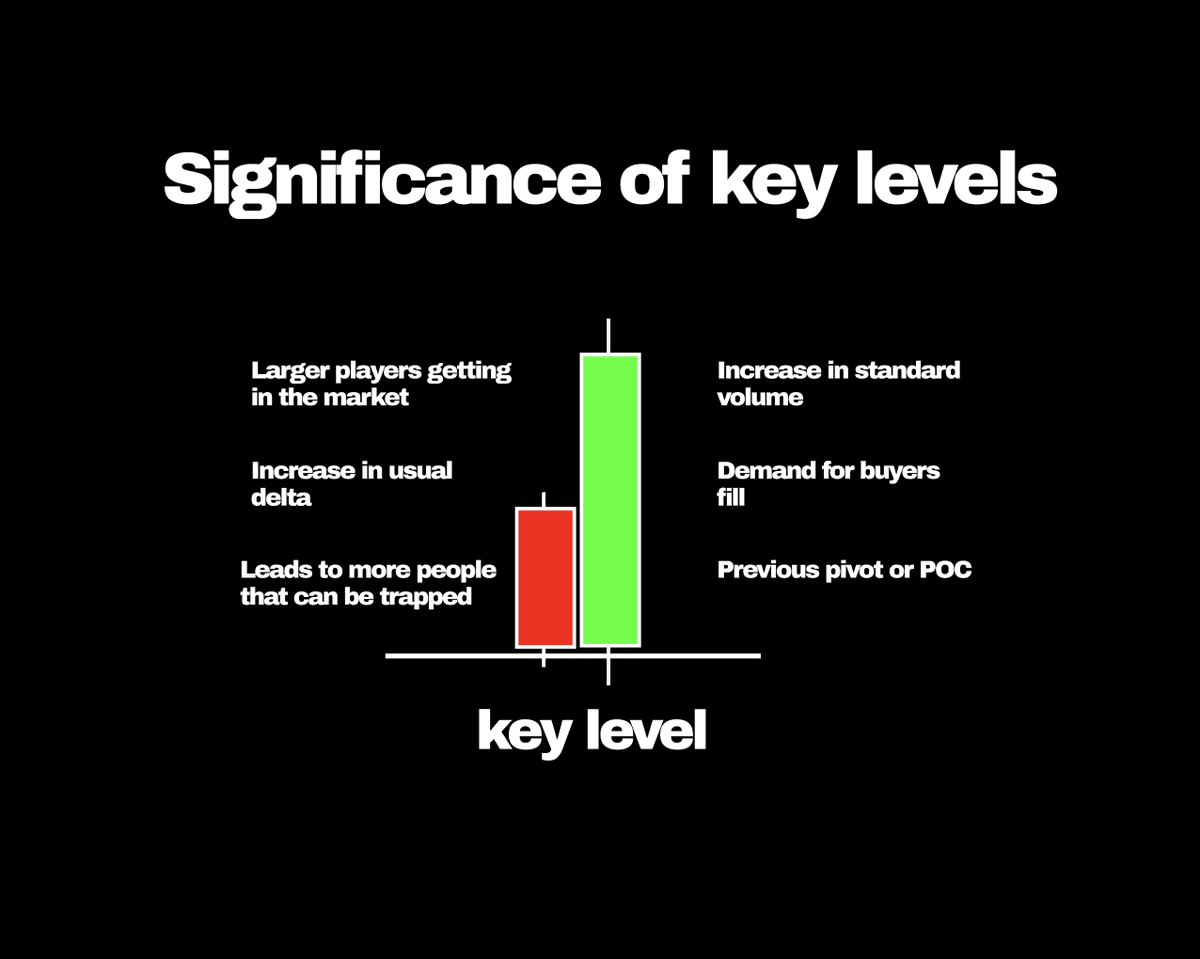
Significance of key levels :
A key level such as a POC or pivot high/low, provides the location for where market demand may shift.
Hence, this is when a lot of traders can become trapped quickly, elevating the effectiveness of a reversal in play.
A key level such as a POC or pivot high/low, provides the location for where market demand may shift.
Hence, this is when a lot of traders can become trapped quickly, elevating the effectiveness of a reversal in play.
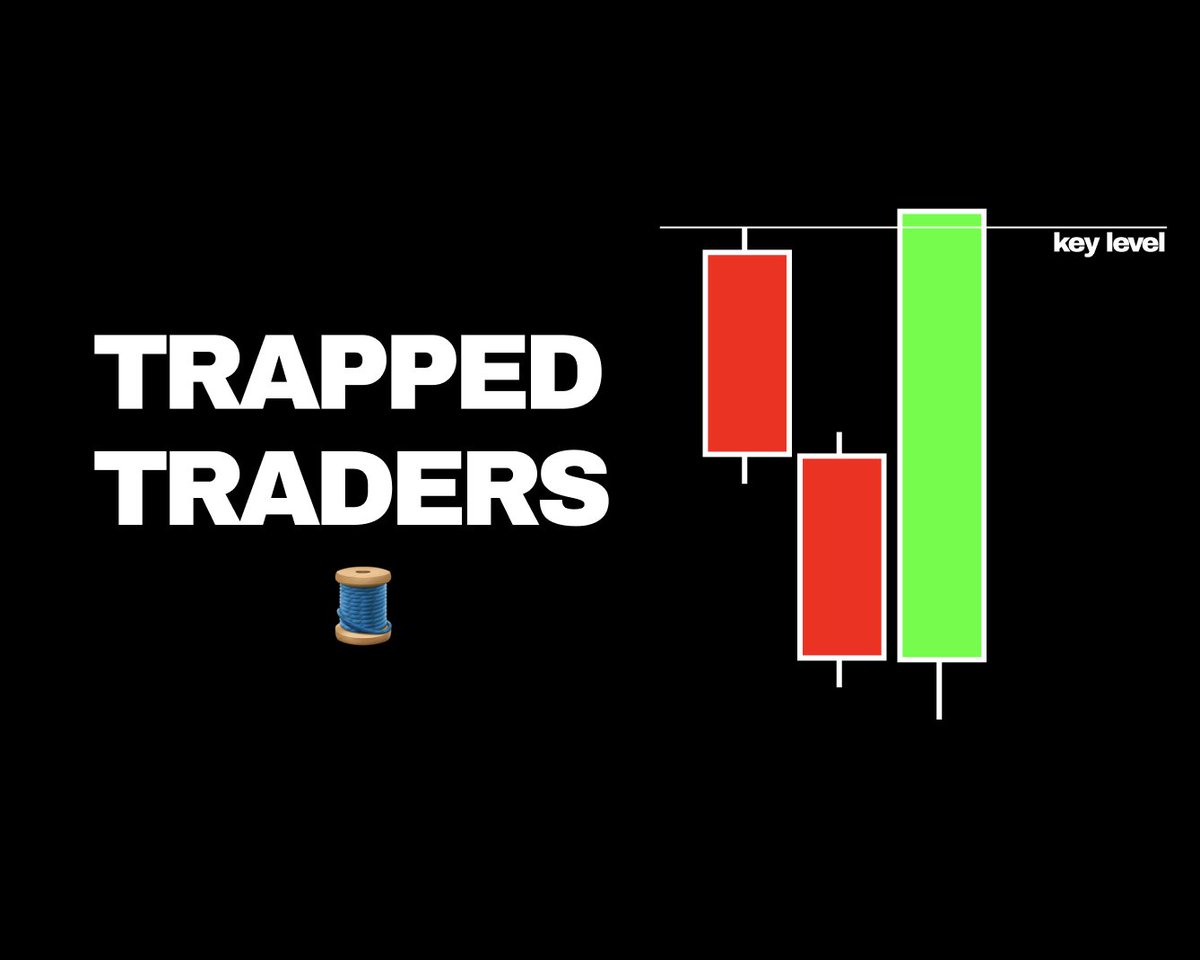
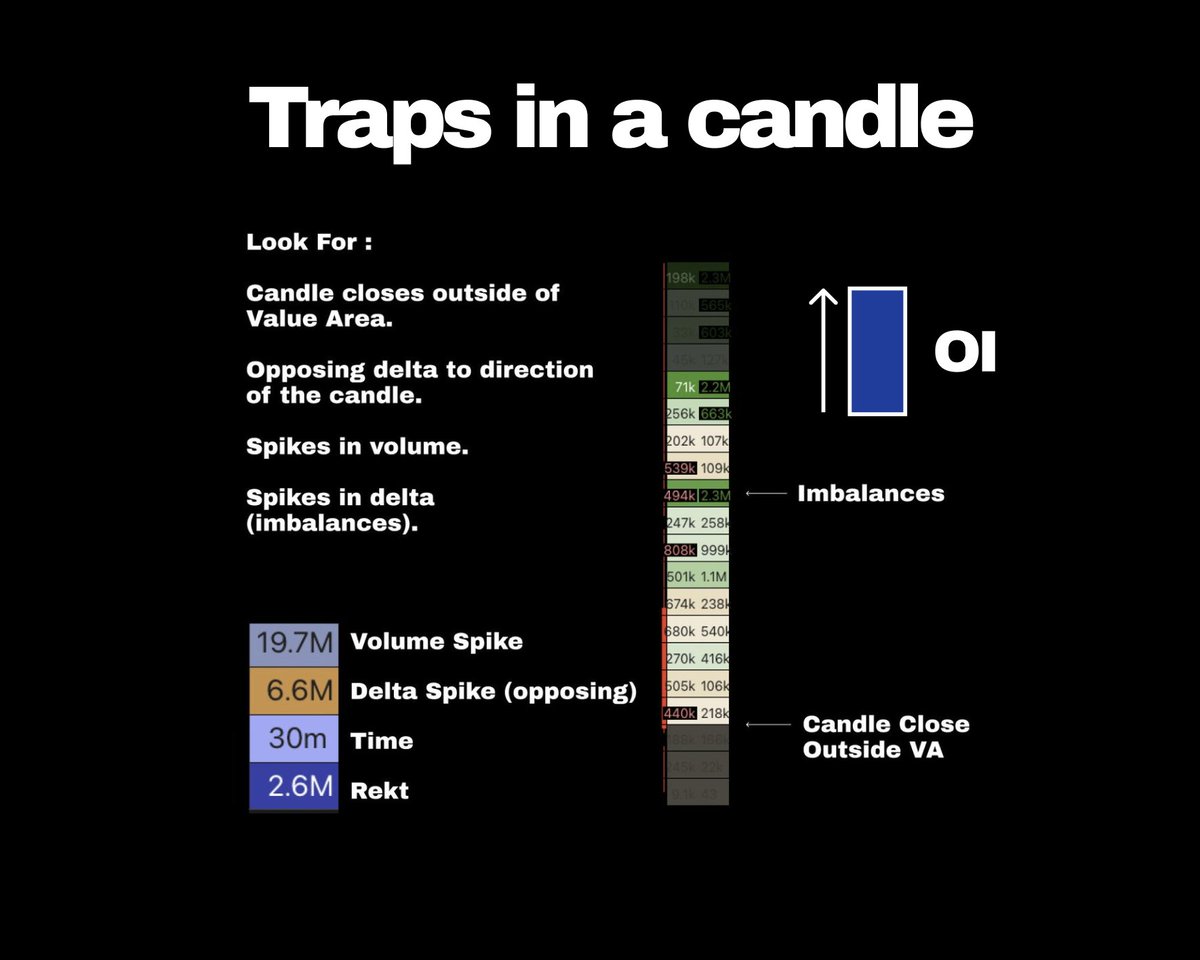
Traps within a candle :
For trapping traders we can look for the following in a candle when met at a key level.
1. Candle closes outside of the VA.
2. Spikes in delta relative to surrounding candles.
3. Spikes in volume.
4. Increase in OI.
5. Imbalances.
6. Liquidations.
For trapping traders we can look for the following in a candle when met at a key level.
1. Candle closes outside of the VA.
2. Spikes in delta relative to surrounding candles.
3. Spikes in volume.
4. Increase in OI.
5. Imbalances.
6. Liquidations.
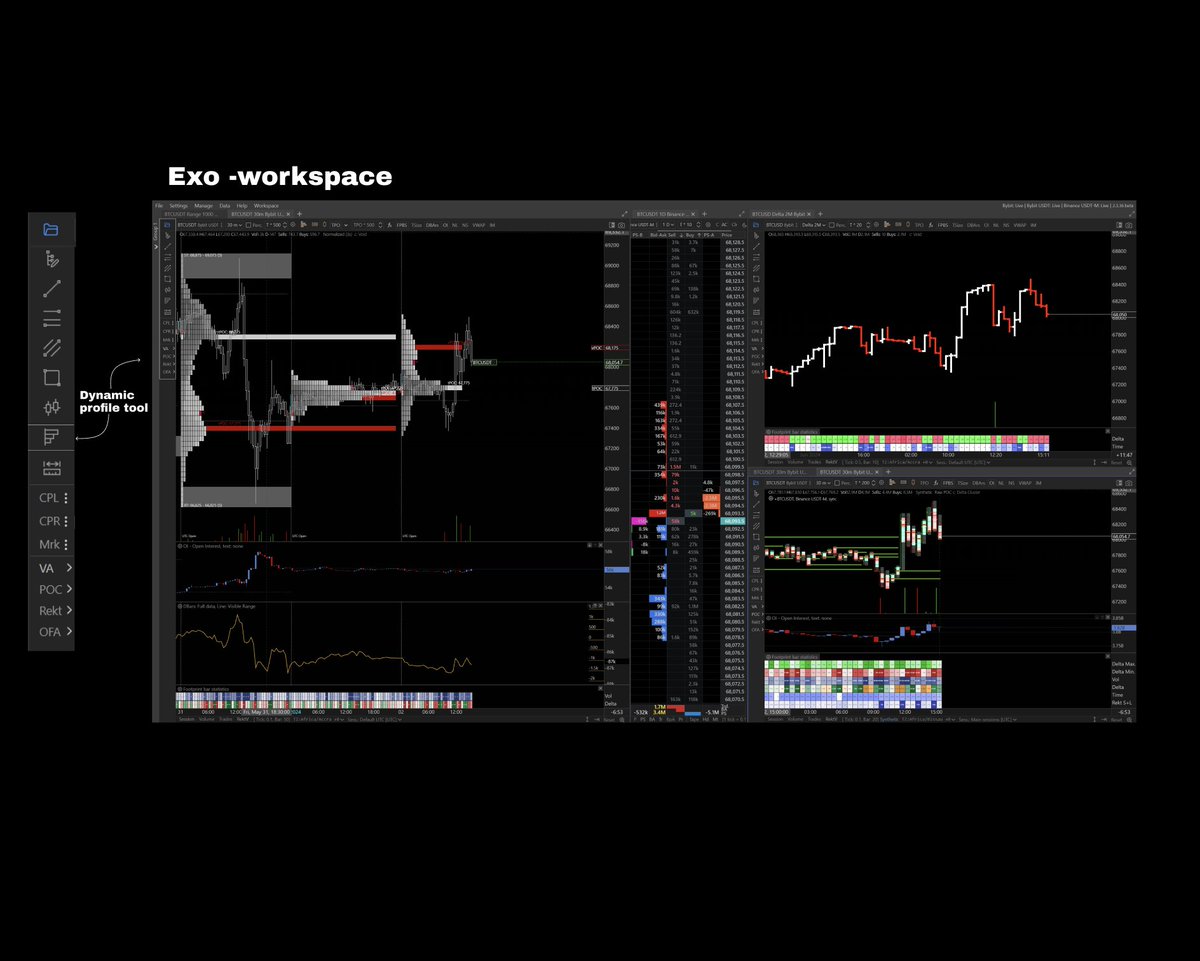
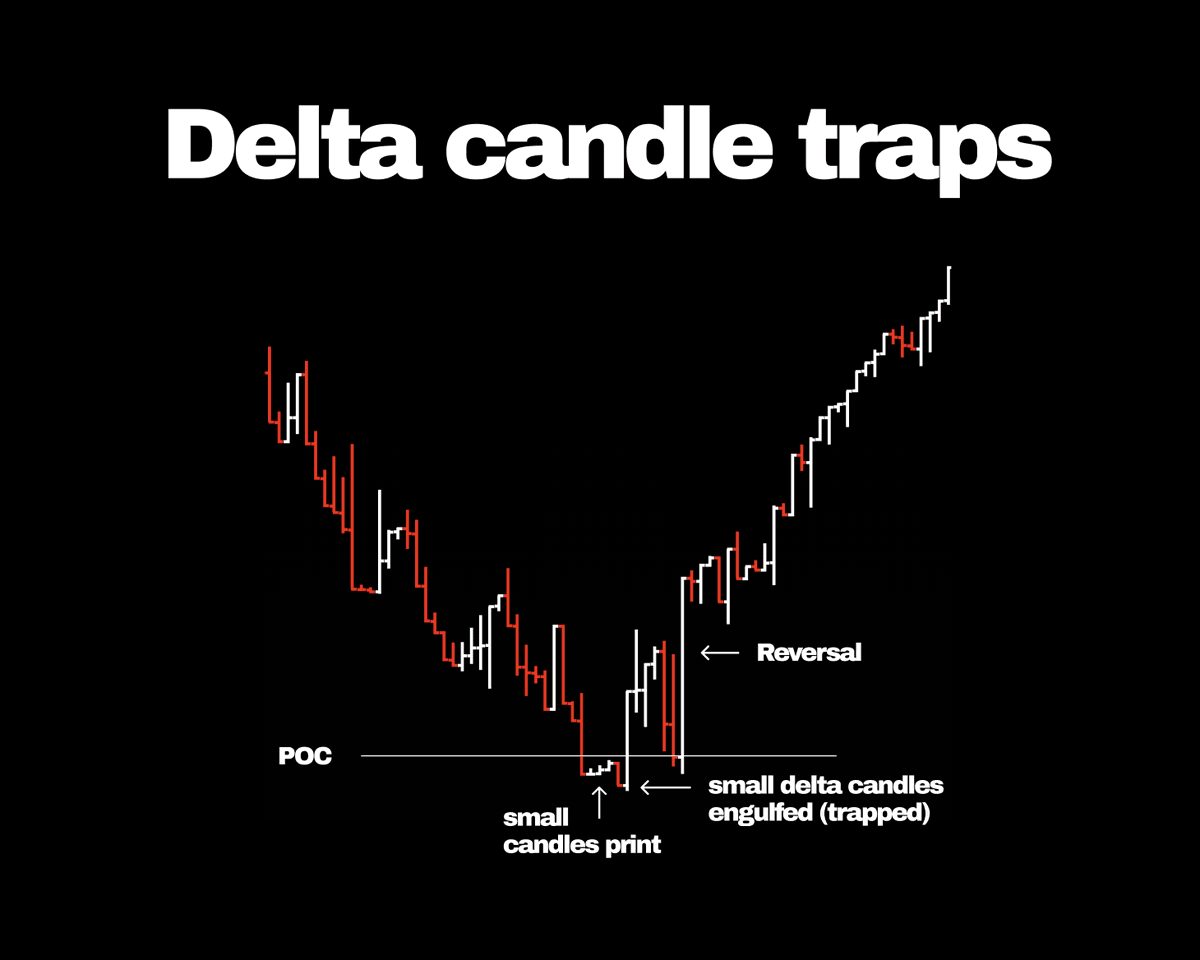
Delta candle traps :
Looking for a move into a key level.
Candle size of delta candle becoming smaller in size between the high and low signifying interest for passive fill.
Then a larger candle in the opposing direction which engulfs the previous smaller candles.
Looking for a move into a key level.
Candle size of delta candle becoming smaller in size between the high and low signifying interest for passive fill.
Then a larger candle in the opposing direction which engulfs the previous smaller candles.
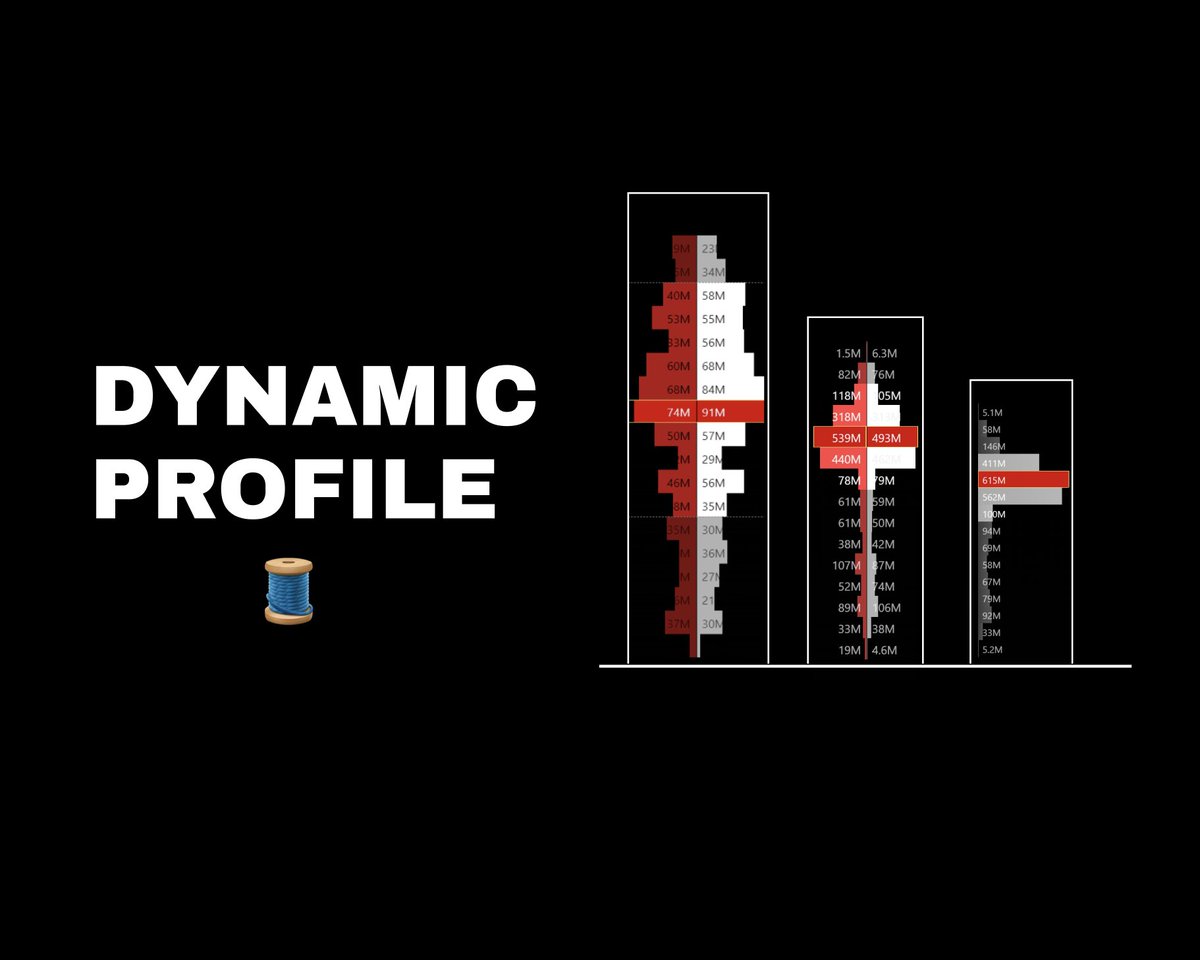
Range chart traps :
Traps on range charts similar to delta charts can highlight the amount of delta to move price by a certain amount.
Looking for high spikes of delta in comparison to previous candles show more pressure needed to move price.
Then using general trap rules.
Traps on range charts similar to delta charts can highlight the amount of delta to move price by a certain amount.
Looking for high spikes of delta in comparison to previous candles show more pressure needed to move price.
Then using general trap rules.

Conclusion:
In general when looking for potential reversal moves, looking for trapped positions is a really effective and useful method for execution on trades.
Until next time.
Stay smart. Trade safe.
Exotick.
In general when looking for potential reversal moves, looking for trapped positions is a really effective and useful method for execution on trades.
Until next time.
Stay smart. Trade safe.
Exotick.
• • •
Missing some Tweet in this thread? You can try to
force a refresh